Largest combined-cycle power plant running in Beijing

By Industrial Info Resources


NFPA 70e Training

Our customized live online or in‑person group training can be delivered to your staff at your location.

  • Live Online
  • 6 hours Instructor-led
  • Group Training Available
Regular Price:
$199
Coupon Price:
$149
Reserve Your Seat Today
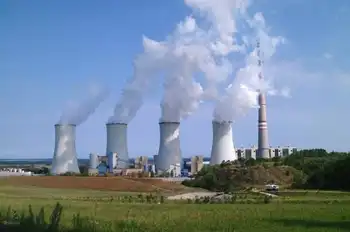
Just in time for the opening of the 2008 Olympic Games, Taiyanggong Gas Thermal Power Plant, the largest combined-cycle power plant in China, was put into official operation in Beijing on July 22.

Taiyanggong Gas Thermal Power Plant is an important support project for the Beijing 2008 Olympic Games. The project is built and operated by Beijing Taiyanggong Gas Thermal Power Company Limited (BTGTPC), a project company jointly invested by Power Beijing and GD Power Development Company Limited, the listed flagship of China Guodian Corporation.

The project is furnished with two 350-megawatt (MW) 9F-class gas-steam combined-cycle generating units with an annual power output of about 3.4 billion kilowatt-hours and a heat-supply capacity of 10 million square meters in an area of 40 square kilometers.

During the construction of the project, BTGTPC overcame a series of technical difficulties such as arrangement of the units and noise treatment. With strong support from the municipal government, construction quality, progress and cost control are within desired boundaries.

Unit 1 of the plant was successfully connected to the grid on December 29, 2007, and Unit 2 passed the 168-hour trial operation in March 2008.

The project is currently ready to supply heat and power to the Olympic venues.

Related News

Oil crash only a foretaste of what awaits energy industry

Oil and Gas Profitability Decline reflects shale-driven oversupply, OPEC-Russia dynamics, LNG exports, renewables growth, and weak demand, signaling compressed margins for producers, stressed petrodollar budgets, and shifting energy markets post-Covid.


Key Points

A sustained squeeze on hydrocarbon margins from agile shale supply, weaker OPEC leverage, and expanding renewables.

✅ Shale responsiveness caps prices and erodes industry rents

✅ OPEC-Russia cuts face limited impact versus US supply

✅ Renewables and EVs slow long-term oil and gas demand


The oil-price crash of March 2020 will probably not last long. As in 2014, when the oil price dropped below $50 from $110 in a few weeks, this one will trigger a temporary collapse of the US shale industry. Unless the coronavirus outbreak causes Armageddon, cheap oil will also support policymakers’ efforts to help the global economy.

But there will be at least one important and lasting difference this time round — and it has major market and geopolitical implications.

The oil price crash is a foretaste of where the whole energy sector was going anyway — and that is down.

It may not look that way at first. Saudi Arabia will soon realise, as it did in 2015, that its lethal decision to pump more oil is not only killing US shale but its public finances as well. Riyadh will soon knock on Moscow’s door again. Once American shale supplies collapse, Russia will resume co-operation with Saudi Arabia.

With the world economy recovering from the Covid-19 crisis by then, and with electricity demand during COVID-19 shifting, moderate supply cuts by both countries will accelerate oil market recovery. In time, US shale producers will return too.

Yet this inevitable bounceback should not distract from two fundamental factors that were already remaking oil and gas markets. First, the shale revolution has fundamentally eroded industry profitability. Second, the renewables’ revolution will continue to depress growth in demand.

The combined result has put the profitability of the entire global hydrocarbon industry under pressure. That means fewer petrodollars to support oil-producing countries’ national budgets, including Canada's oil sector exposures. It also means less profitable oil companies, which traditionally make up a large segment of stock markets, an important component of so many western pension funds.

Start with the first factor to see why this is so. Historically, the geological advantages that made oil from countries such as Saudi Arabia so cheap to produce were unique. Because oil and gas were produced at costs far below the market price, the excess profits, or “rent”, enjoyed by the industry were very large.

Furthermore, collusion among low-cost producers has been a winning strategy. The loss of market share through output cuts was more than compensated by immediately higher prices. It was the raison d’être of Opec.

The US shale revolution changed all this, exposing the limits of U.S. energy dominance narratives. A large oil-producing region emerged with a remarkable ability to respond quickly to price changes and shrink its costs over time. Cutting back cheap Opec oil now only increases US supplies, with little effect on world prices.

That is why Russia refused to cut production this month. Even if its cuts did boost world prices — doubtful given the coronavirus outbreak’s huge shock to demand — that would slow the shrinkage of US shale that Moscow wants.

Shale has affected the natural gas industry even more. Exports of US liquefied natural gas now put an effective ceiling on global prices, and debates over a clean electricity push have intensified when gas prices spike.

On top of all this, there is also the renewables’ revolution, though a green revolution has not been guaranteed in the near term. Around the world, wind and solar have become ever-cheaper options to generate electricity. Storage costs have also dropped and network management improved. Even in the US, renewables are displacing coal and gas. Electrification of vehicle fleets will damp demand further, as U.S. electricity, gas, and EVs face evolving pressures.

Eliminating fossil fuel consumption completely would require sustained and costly government intervention, and reliability challenges such as coal and nuclear disruptions add to the complexity. That is far from certain. Meanwhile, though, market forces are depressing the sector’s usual profitability.

The end of oil and gas is not immediately around the corner. Still, the end of hydrocarbons as a lucrative industry is a distinct possibility. We are seeing that in dramatic form in the current oil price crash. But this collapse is merely a message from the future.


Related News

View more

Hydro One CEO's $4.5M salary won't be reduced to help cut electricity costs

Hydro One CEO Salary shapes debate on Ontario electricity costs, executive compensation, sunshine list transparency, and public disclosure rules, as officials argue pay is not driving planned hydro rate cuts for consumers.


Key Points

Hydro One CEO pay disclosed in public filings, central to debates on Ontario electricity rates and transparency.

✅ 2016 compensation: $4.5M (salary + bonuses)

✅ Excluded from Ontario's sunshine list after privatization

✅ Government says pay won't affect planned hydro rate cuts


The $4.5 million in pay received by Hydro One's CEO is not a factor in the government's plan to cut electricity costs for consumers, an Ontario cabinet minister said Thursday amid opposition concerns about the executive's compensation and wider sector pressures such as Manitoba Hydro's rising debt in other provinces.

Treasury Board President Liz Sandals made her comments on the eve of the release of the province's so-called sunshine list.

The annual disclosure of public-sector salaries over $100,000 will be released Friday, but Hydro One salaries such as that of company boss Mayo Schmidt won't be on it.Though the government still owns most of Hydro One — 30 per cent has been sold — the company is required to follow the financial disclosure rules of publicly traded companies, which means disclosing the salaries of its CEO, CFO and next three highest-paid executives, and financial results such as a Q2 profit decline in filings.

New filings show that Schmidt was paid $4.5 million in 2016 — an $850,000 salary plus bonuses — and those top five executives were paid a total of about $11.7 million. 

"Clearly that's a very large amount," said Sandals. Sandals wouldn't say whether or not she thought the pay was appropriate at a time when the government is trying to reduce system costs and cut people's hydro bills.

Mayo Schmidt, President & CEO of Hydro One Limited and Hydro One Inc. (Hydro One )

But she suggested the CEO's salary was not a factor in efforts to bring down hydro prices, even as Hydro One shares fell after a leadership shakeup in a later period. "The CEO salary is not part of the equation of will 'we be able to make the cut,"' she said. "Regardless of what those salaries are, we will make a 25-per-cent-off cut." The cut coming this summer is actually an average of 17 per cent -- the 25-per-cent figure factors in an earlier eight-per-cent rebate.

NDP Leader Andrea Horwath, who has proposed to make hydro public again in Ontario, said the executive salaries are relevant to cutting hydro costs.

"All of this is cost of operating the electricity system, it's part of the operating of Hydro One and so of course those increased salaries are going to impact the cost of our electricity," she said.

Schmidt was appointed Aug. 31, 2015, and in the last four months of that year earned $1.3 million, but the former CEO was paid $745,000 in 2014. About 3,800 workers were paid over $100,000 that year, none of whom will be on the sunshine list this year.

Progressive Conservative energy critic Todd Smith has a private member's bill that would put Hydro One salaries back on the list, amid investor concerns about Hydro One that cite too many unknowns.

"The Wynne Liberals don't want the people of Ontario to know that their rates have helped create a new millionaire's club at Hydro One," Smith said. "Hydro One is still under the majority ownership of the public, but Premier Kathleen Wynne has removed these salaries from the public's watchful eye."

The previous sunshine list showed 115,431 people were earning more than $100,000 — an increase of nearly 4,000 people despite the fact 3,774 Hydro One workers were not on the list for the first time.

Tom Mitchell, the former CEO at Ontario Power Generation who resigned last summer, topped the 2015 list at $1.59 million.


Related News

View more

UK must start construction of large-scale storage or fail to meet net zero targets.

UK Hydrogen Storage Caverns enable long-duration, low-carbon electricity balancing, storing surplus wind and solar power as green hydrogen in salt formations to enhance grid reliability, energy security, and net zero resilience by 2035 and 2050.


Key Points

They are salt caverns storing green hydrogen to balance wind and solar, stabilizing a low-carbon UK grid.

✅ Stores surplus wind and solar as green hydrogen in salt caverns

✅ Enables long-duration, low-carbon grid balancing and security

✅ Complements wind and solar; reduces dependence on flexible CCS


The U.K. government must kick-start the construction of large-scale hydrogen storage facilities if it is to meet its pledge that all electricity will come from low-carbon electricity sources by 2035 and reach legally binding net zero targets by 2050, according to a report by the Royal Society.

The report, "Large-scale electricity storage," published Sep. 8, examines a wide variety of ways to store surplus wind and solar generated electricity—including green hydrogen, advanced compressed air energy storage (ACAES), ammonia, and heat—which will be needed when Great Britain's electricity generation is dominated by volatile wind and solar power.

It concludes that large scale electricity storage is essential to mitigate variations in wind and sunshine, particularly long-term variations in the wind, and to keep the nation's lights on. Storing most of the surplus as hydrogen, in salt caverns, would be the cheapest way of doing this.

The report, based on 37 years of weather data, finds that in 2050 up to 100 Terawatt-hours (TWh) of storage will be needed, which would have to be capable of meeting around a quarter of the U.K.'s current annual electricity demand. This would be equivalent to more than 5,000 Dinorwig pumped hydroelectric dams. Storage on this scale, which would require up to 90 clusters of 10 caverns, is not possible with batteries or pumped hydro.

Storage requirements on this scale are not currently foreseen by the government, and the U.K.'s energy transition faces supply delays. Work on constructing these caverns should begin immediately if the government is to have any chance of meeting its net zero targets, the report states.

Sir Chris Llewellyn Smith FRS, lead author of the report, said, "The need for long-term storage has been seriously underestimated. Demand for electricity is expected to double by 2050 with the electrification of heat, transport, and industrial processing, as well as increases in the use of air conditioning, economic growth, and changes in population.

"It will mainly be met by wind and solar generation. They are the cheapest forms of low-carbon electricity generation, but are volatile—wind varies on a decadal timescale, so will have to be complemented by large scale supply from energy storage or other sources."

The only other large-scale low-carbon sources are nuclear power, gas with carbon capture and storage (CCS), and bioenergy without or with CCS (BECCS). While nuclear and gas with CCS are expected to play a role, they are expensive, especially if operated flexibly.

Sir Peter Bruce, vice president of the Royal Society, said, "Ensuring our future electricity supply remains reliable and resilient will be crucial for our future prosperity and well-being. An electricity system with significant wind and solar generation is likely to offer the lowest cost electricity but it is essential to have large-scale energy stores that can be accessed quickly to ensure Great Britain's energy security and sovereignty."

Combining hydrogen with ACAES, or other forms of storage that are more efficient than hydrogen, could lower the average cost of electricity overall, and would lower the required level of wind power and solar supply.

There are currently three hydrogen storage caverns in the U.K., which have been in use since 1972, and the British Geological Survey has identified the geology for ample storage capacity in Cheshire, Wessex and East Yorkshire. Appropriate, novel business models and market structures will be needed to encourage construction of the large number of additional caverns that will be needed, the report says.

Sir Chris observes that, although nuclear, hydro and other sources are likely to play a role, Britain could in principle be powered solely by wind power and solar, supported by hydrogen, and some small-scale storage provided, for example, by batteries, that can respond rapidly and to stabilize the grid. While the cost of electricity would be higher than in the last decade, we anticipate it would be much lower than in 2022, he adds.


Related News

View more

What Will Drive Utility Revenue When Electricity Is Free?

AI-Powered Utility Customer Experience enables transparency, real-time pricing, smart thermostats, demand response, and billing optimization, helping utilities integrate distributed energy resources, battery storage, and microgrids while boosting customer satisfaction and reducing costs.


Key Points

An approach where utilities use AI and real-time data to personalize service, optimize billing, and cut energy costs.

✅ Real-time pricing aligns retail and wholesale market signals

✅ Device control via smart thermostats and home energy management

✅ Analytics reveal appliance-level usage and personalized savings


The latest electric utility customer satisfaction survey results from the American Customer Satisfaction Index (ACSI) Energy Utilities report reveal that nearly every investor-owned utility saw customer satisfaction go down from 2018 to 2019. Residential customers are sending a clear message in the report: They want more transparency and control over energy usage, billing and ways to reduce costs.

With both customer satisfaction and utility revenues on the decline, utilities are facing daunting challenges to their traditional business models amid flat electricity demand across many markets today. That said, it is the utilities that see these changing times as an opportunity to evolve that will become the energy leaders of tomorrow, where the customer relationship is no longer defined by sales volume but instead by a utility company's ability to optimize service and deliver meaningful customer solutions.

We have seen how the proliferation of centralized and distributed renewables on the grid has already dramatically changed the cost profile of traditional generation and variability of wholesale energy prices. This signals the real cost drivers in the future will come from optimizing energy service with things like batteries, microgrids and peer-to-peer trading networks. In the foreseeable future, flat electricity rates may be the norm, or electricity might even become entirely free as services become the primary source of utility revenue.

The key to this future is technological innovation that allows utilities to better understand a customer’s unique needs and priorities and then deliver personalized, well-timed solutions that make customers feel valued and appreciated as their utility helps them save and alleviates their greatest pain points.

I predict utilities that adopt new technologies focused on customer experience, aligned with key utility trends shaping the sector, and deliver continual service improvements and optimization will earn the most satisfied, most loyal customers.

To illustrate this, look at how fixed pricing today is applied for most residential customers. Unless you live in one of the states with deregulated utilities where most customers are free to choose a service provider in a competitive marketplace, as consumers in power markets increasingly reshape offerings, fixed-rate tariffs or time-of-use tariffs might be the only rate structures you have ever known, though new utility rate designs are being tested nationwide today. These tariffs are often market distortions, bearing little relation to the real-time price that the utility pays on the wholesale market.

It can be easy enough to compare the rate you pay as a consumer and the market rate that utilities pay. The California ISO has a public dashboard -- as do other grid operators -- that shows the real-time marginal cost of energy. On a recent Friday, for example, a buyer in San Francisco could go to the real-time market and procure electricity at a rate of around 9.5 cents per kilowatt-hour (kWh), yet a residential customer can pay the utility PG&E between 22 cents and 49 cents per kWh amid major changes to electric bills being debated, depending on usage.

The problem is that utility customers do not usually see this data or know how to interpret it in a way that helps add value to their service or drive down the cost.

This is a scenario ripe for innovation. Artificial intelligence (AI) technologies are beginning to be applied to give customers the transparency and control over the energy they desire, and a new type of utility is emerging using real-time pricing signals from wholesale markets to give households hassle-free energy savings. Evolve Energy in Texas is developing a utility service model, even as Texas utilities revisit smart home network strategies, that delivers electricity to consumers at real-time market prices and connects to smart thermostats and other connected devices in the home for simple monitoring and control -- all managed via an intuitive consumer app.

My company, Bidgely, partners with utilities and energy retailers all over the world to apply artificial intelligence and machine learning algorithms to customer data in order to bring transparency to their electricity bills, showing exactly where the customers’ money is going down to the appliance and offering personalized, actionable advice on how to save.

Another example is from energy management company Keewi. Its wireless outlet adaptors are revealing real-time energy usage information to Texas A&M dorm residents as well as providing students the ability to conserve energy through controlling items in their rooms from their smartphones.

These are but a few examples of innovations among many in play that answer the consumer demand for increased transparency and control over energy usage.

Electric service providers will be closely watching how consumers respond to AI-driven innovation, including providers in traditionally regulated markets that are exploring equitable regulation approaches now, to stay aligned with policy and customer expectations. While regulated utilities have no reason to fear that their customers might sign up with a competitor, they understand that the revenues from electricity sales are going down and the deployment of distributed energy resources is going up. Both trends were reflected in a March report from Bloomberg New Energy Finance (via ThinkProgress) that claimed unsubsidized storage projects co-located with solar or wind are starting to compete with coal and gas for dispatchable power. Change is coming to regulated markets, and some of that change can be attributed to customer dissatisfaction with utility service.

Like so many industries before, the utility-customer relationship is on track to become less about measuring unit sales and more about driving revenue through services and delivering the best customer value. Loyal customers are most likely to listen and follow through on the utility’s advice and to trust the utility for a wide range of energy-related products and services. Utilities that make customer experience the highest priority today will emerge tomorrow as the leaders of a new energy service era.


Related News

View more

German renewables deliver more electricity than coal and nuclear power for the first time

Germany renewable energy milestone 2019 saw wind, solar, hydropower, and biomass outproduce coal and nuclear, as low gas prices and high CO2 costs under the EU ETS reshaped the electricity mix, per Fraunhofer ISE.


Key Points

It marks H1 2019 when renewables supplied 47.3% of Germany's electricity, surpassing coal and nuclear.

✅ Driven by high CO2 prices and cheap natural gas

✅ Wind and solar output rose; coal generation declined sharply

✅ Flexible gas plants outcompeted inflexible coal units


In Lippendorf, Saxony, the energy supplier EnBW is temporarily taking part of a coal-fired power plant offline. Not because someone ordered it — it simply wasn't paying off. Gas prices are low, CO2 prices are high, and with many hours of sunshine and wind, renewable methods are producing a great deal of electricity as part of Germany's energy transition now reshaping operations. And in the first half of the year there was plenty of sun and wind.

The result was a six-month period in which renewable energy sources, a trend echoed by the EU wind and solar record across the bloc, produced more electricity than coal and nuclear power plants together. For the first time 47.3% of the electricity consumers used came from renewable sources, while 43.4% came from coal-fired and nuclear power plants.

In addition to solar and wind power, renewable sources also include hydropower and biomass. Gas supplied 9.3%, reflecting how renewables are crowding out gas across European power markets, while the remaining 0.4% came from other sources, such as oil, according to figures published by the Fraunhofer Institute for Solar Energy Systems in July.

Fabian Hein from the think tank Agora Energiewende stresses that the situation is only a snapshot in time, with grid expansion woes still shaping outcomes. For example, the first half of 2019 was particularly windy and wind power production rose by around 20% compared to the first half of 2018.

Electricity production from solar panels rose by 6%, natural gas by 10%, while the share of nuclear power in German electricity consumption has remained virtually unchanged despite a nuclear option debate in climate policy.

Coal, on the other hand, declined. Black coal energy production fell by 30% compared to the first half of 2018, lignite fell by 20%. Some coal-fired power plants were even taken off the grid, even as coal still provides about a third of Germany's electricity. It is difficult to say whether this was an effect of the current market situation or whether this is simply part of long-term planning, says Hein.


Activists storm German mine in anti-coal protest

It is clear, however, that an increased CO2 price has made the ongoing generation of electricity from coal more expensive. Gas-fired power plants also emit CO2, but less than coal-fired power plants. They are also more efficient and that's why gas-fired power plants are not so strongly affected by the CO2 price

The price is determined at a European level and covers power plants and energy intensive industries in Europe. Other areas, such as heating or transport are not covered by the CO2 price scheme. Since a reform of CO2 emissions trading in 2017, the price has risen sharply. Whereas in September 2016 it was just over €5 ($5.6), by the end of June 2019 it had climbed to over €26.


Ups and downs

Gas as a raw material is generally more expensive than coal. But coal-fired power plants are more expensive to build. This is why operators want to run them continuously. In times of high demand, and therefore high prices, gas-fired power plants are generally started up, as seen when European power demand hit records during recent heatwaves, since it is worth it at these times.

Gas-fired power plants can be flexibly ramped up and down. Coal-fired power plants take 11 hours or longer to get going. That's why they can't be switched on quickly for short periods when prices are high, like gas-fired power plants. In the first half of the year, however, coal-fired power plants were also ramped up and down more often because it was not always worthwhile to let the power plant run around the clock.

Because gas prices were particularly low in the first half of 2019, some gas-fired power plants were more profitable than coal-fired plants. On June 29, 2019, the gas price at the Dutch trading point TTF was around €10 per megawatt hour. A year earlier, it had been almost €20. This is partly due to the relatively mild winter, as there is still a lot of gas in reserve, confirmed a spokesman for the Federal Association of the Energy and Water Industries (BDEW). There are also several new export terminals for liquefied natural gas. Additionally, weaker growth and trade wars are slowing demand for gas. A lot of gas comes to Europe, where prices are still comparatively high, reported the Handelsblatt newspaper.

The increase in wind and solar power and the decline in nuclear power have also reduced CO2 emissions. In the first half of 2019, electricity generation emitted around 15% less CO2 than in the same period last year, reported BDEW. However, the association demands that the further expansion of renewable energies should not be hampered. The target of 65% renewable energy can only be achieved if the further expansion of renewable energy sources is accelerated.


Related News

View more

Which of the cleaner states imports dirty electricity?

Hourly Electricity Emissions Tracking maps grid balancing areas, embodied emissions, and imports/exports, revealing carbon intensity shifts across PJM, ERCOT, and California ISO, and clarifying renewable energy versus coal impacts on health and climate.


Key Points

An hourly method tracing generation, flows, and embodied emissions to quantify carbon intensity across US balancing areas.

✅ Hourly traces of imports/exports and generation mix

✅ Consumption-based carbon intensity by balancing area

✅ Policy insights for renewables, coal, health costs


In the United States, electricity generation accounts for nearly 30% of our carbon emissions. Some states have responded to that by setting aggressive renewable energy standards; others are hoping to see coal propped up even as its economics get worse. Complicating matters further is the fact that many regional grids are integrated, and as America goes electric the stakes grow, meaning power generated in one location may be exported and used in a different state entirely.

Tracking these electricity exports is critical for understanding how to lower our national carbon emissions. In addition, power from a dirty source like coal has health and environment impacts where it's produced, and the costs of these aren't always paid by the parties using the electricity. Unfortunately, getting reliable figures on how electricity is produced and where it's used is challenging, even for consumers trying to find where their electricity comes from in the first place, leaving some of the best estimates with a time resolution of only a month.

Now, three Stanford researchers—Jacques A. de Chalendar, John Taggart, and Sally M. Benson—have greatly improved on that standard, and they have managed to track power generation and use on an hourly basis. The researchers found that, of the 66 grid balancing areas within the United States, only three have carbon emissions equivalent to our national average, and they have found that imports and exports of electricity have both seasonal and daily changes. de Chalendar et al. discovered that the net results can be substantial, with imported electricity increasing California's emissions/power by 20%.

Hour by hour
To figure out the US energy trading landscape, the researchers obtained 2016 data for grid features called balancing areas. The continental US has 66 of these, providing much better spatial resolution on the data than the larger grid subdivisions. This doesn't cover everything—several balancing areas in Canada and Mexico are tied in to the US grid—and some of these balancing areas are much larger than others. The PJM grid, serving Pennsylvania, New Jersey, and Maryland, for example, is more than twice as large as Texas' ERCOT, in a state that produces and consumes the most electricity in the US.

Despite these limitations, it's possible to get hourly figures on how much electricity was generated, what was used to produce it, and whether it was used locally or exported to another balancing area. Information on the generating sources allowed the researchers to attach an emissions figure to each unit of electricity produced. Coal, for example, produces double the emissions of natural gas, which in turn produces more than an order of magnitude more carbon dioxide than the manufacturing of solar, wind, or hydro facilities. These figures were turned into what the authors call "embodied emissions" that can be traced to where they're eventually used.

Similar figures were also generated for sulfur dioxide and nitrogen oxides. Released by the burning of fossil fuels, these can both influence the global climate and produce local health problems.

Huge variation
The results were striking. "The consumption-based carbon intensity of electricity varies by almost an order of magnitude across the different regions in the US electricity system," the authors conclude. The low is the Bonneville Power grid region, which is largely supplied by hydropower; it has typical emissions below 100kg of carbon dioxide per megawatt-hour. The highest emissions come in the Ohio Valley Electric region, where emissions clear 900kg/MW-hr. Only three regional grids match the overall grid emissions intensity, although that includes the very large PJM (where capacity auction payouts recently fell), ERCOT, and Southern Co balancing areas.

Most of the low-emissions power that's exported comes from the Pacific Northwest's abundant hydropower, while the Rocky Mountains area exports electricity with the highest associated emissions. That leads to some striking asymmetries. Local generation in the hydro-rich Idaho Power Company has embodied emissions of only 71kg/MW-hr, while its imports, coming primarily from Rocky Mountain states, have a carbon content of 625kg/MW-hr.

The reliance on hydropower also makes the asymmetry seasonal. Local generation is highest in the spring as snow melts, but imports become a larger source outside this time of year. As solar and wind can also have pronounced seasonal shifts, similar changes will likely be seen as these become larger contributors to many of these regional grids. Similar things occur daily, as both demand and solar production (and, to a lesser extent, wind) have distinct daily profiles.

The Golden State
California's CISO provides another instructive case. Imports represent less than 30% of its total electric use in 2016, yet California electricity imports provided 40% of its embodied emissions. Some of these, however, come internally from California, provided by the Los Angeles Department of Water and Power. The state itself, however, has only had limited tracking of imported emissions, lumping many of its sources as "other," and has been exporting its energy policies to Western states in ways that shape regional markets.

Overall, the 2016 inventory provides a narrow picture of the US grid, as plenty of trends are rapidly changing our country's emissions profile, including the rise of renewables and the widespread adoption of efficiency measures and other utility trends in 2017 that continue to evolve. The method developed here can, however, allow for annual updates, providing us with a much better picture of trends. That could be quite valuable to track things like how the rapid rise in solar power is altering the daily production of clean power.

More significantly, it provides a basis for more informed policymaking. States that wish to promote low-emissions power can use the information here to either alter the source of their imports or to encourage the sites where they're produced to adopt more renewable power. And those states that are exporting electricity produced primarily through fossil fuels could ensure that the locations where the power is used pay a price that includes the health costs of its production.


Related News

View more

Sign Up for Electricity Forum’s Newsletter

Stay informed with our FREE Newsletter — get the latest news, breakthrough technologies, and expert insights, delivered straight to your inbox.

Electricity Today T&D Magazine Subscribe for FREE

Stay informed with the latest T&D policies and technologies.
  • Timely insights from industry experts
  • Practical solutions T&D engineers
  • Free access to every issue

Download the 2025 Electrical Training Catalog

Explore 50+ live, expert-led electrical training courses –

  • Interactive
  • Flexible
  • CEU-cerified