Regulators may OK $10 monthly NV Energy rate hike

By Las Vegas Review-Journal


Substation Relay Protection Training

Our customized live online or in‑person group training can be delivered to your staff at your location.

  • Live Online
  • 12 hours Instructor-led
  • Group Training Available
Regular Price:
$699
Coupon Price:
$599
Reserve Your Seat Today
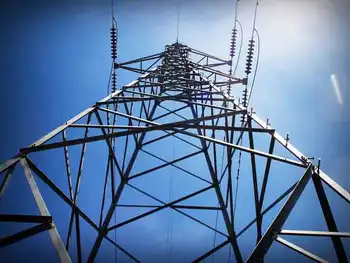
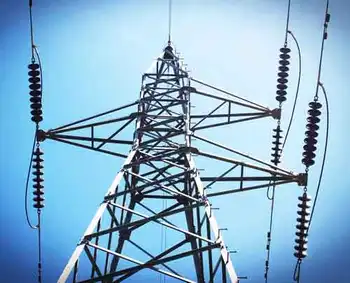
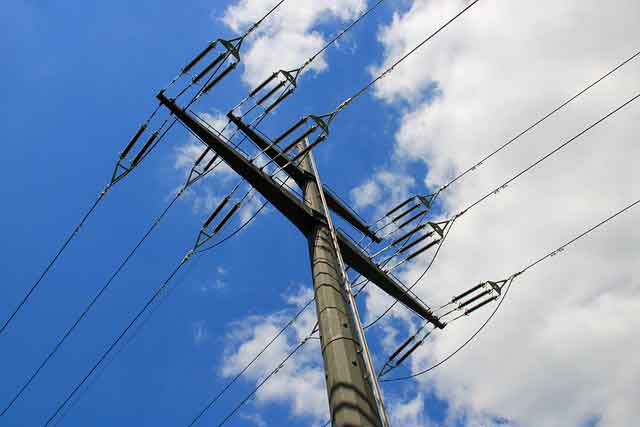
State utility regulators are considering letting NV Energy phase in an electricity rate hike that would eventually cost the average Las Vegas-area customer a little more than $10 a month.

The Nevada Public Utilities Commission is due to consider a proposal to cut the Las Vegas-based utility's request for a 16.7 percent rate hike to 9.3 percent.

The PUC would add savings from expected drops in the cost of fuel and power to lower the rate hike even more, to about 6.8 percent or $10.05 a month.

Part of the increase would kick in July 1, pushing the average summertime single-family residential power bill from about $256 to $263 a month. The rest of the increase would come January 1.

Related News

Economic Crossroads: Bank Earnings, EV Tariffs, and Algoma Steel

Canada Economic Crossroads highlights bank earnings trends, interest rates, loan delinquencies, EV tariffs on Chinese imports, domestic manufacturing, Algoma Steel decarbonization, sustainability, and housing market risks shaping growth, investment, consumer prices, and climate policy.


Key Points

An overview of how bank earnings, EV tariffs, and Algoma Steel's transition shape Canada's economy.

✅ Higher rates lift margins but raise delinquencies and housing risks

✅ EV tariffs aid domestic makers but pressure consumer prices

✅ Algoma invests to decarbonize, boosting efficiency and compliance


In a complex economic landscape, recent developments have brought attention to several pivotal issues affecting Canada's business sector. The Globe and Mail’s latest report delves into three major topics: the latest bank earnings, the implications of new tariffs on Chinese electric vehicles (EVs), and Algoma Steel’s strategic maneuvers. These factors collectively paint a picture of the challenges and opportunities facing Canada's economy.

Bank Earnings Reflect Economic Uncertainty

The recent financial reports from major Canadian banks have revealed a mixed picture of the nation’s economic health. As the Globe and Mail reports, earnings results show robust performances in some areas while highlighting growing concerns in others. Banks have generally posted strong quarterly results, buoyed by higher interest rates which have improved their net interest margins. This uptick is largely attributed to the central bank's monetary policies aimed at combating inflation and stabilizing the economy.

However, the positive earnings are tempered by underlying economic uncertainties. Rising loan delinquencies and a slowing housing market are areas of concern. Increased interest rates, while beneficial for banks’ margins, have also led to higher borrowing costs for consumers and businesses. This dynamic has the potential to impact overall economic growth and consumer confidence.

Tariffs on Chinese EVs: A Strategic Shift

Another significant development is the imposition of new tariffs on Chinese electric vehicles. This move is part of a broader strategy to protect domestic automotive industries and address trade imbalances, aligning with public support for tariffs in key sectors. The tariffs are expected to increase the cost of Chinese EVs in Canada, which could have several implications for the market.

On one hand, the tariffs might provide a temporary boost to Canadian and North American manufacturers by reducing competition from lower-priced Chinese imports. This protectionist measure could encourage investments in local production and innovation, mirroring tariff threats boosting support for energy projects in other sectors. However, the increased cost of Chinese EVs may also lead to higher prices for consumers, potentially slowing the adoption of electric vehicles—a critical goal in Canada’s climate strategy.

The tariffs come at a time when the Canadian government is keen on accelerating the transition to electric mobility to meet its environmental targets, even as a critical crunch in electrical supply raises questions about grid readiness. Balancing the protection of domestic industries with the broader goal of reducing emissions will be a significant challenge moving forward.

Algoma Steel’s Strategic Evolution

In the steel industry, Algoma Steel has been making headlines with its strategic initiatives aimed at transforming its operations, in a broader shift toward clean grids and industrial decarbonization. The Globe and Mail highlights Algoma Steel's efforts to modernize its production processes and shift towards more sustainable practices. This includes significant investments in technology and infrastructure to enhance production efficiency and reduce environmental impact.

Algoma's focus on reducing carbon emissions aligns with broader industry trends towards sustainability. The company’s efforts are part of a larger push within the steel sector to address climate change and meet regulatory requirements. As one of Canada’s leading steel producers, Algoma’s actions could set a precedent for the industry, showcasing how traditional manufacturing sectors can adapt to evolving environmental standards.

Implications and Future Outlook

The interplay of these developments reflects a period of significant transition for Canada's economy, shaped in part by U.S. policy where Biden is seen as better for Canada's energy sector by some analysts. For banks, the challenge will be to navigate the balance between profitability and potential risks from a changing economic environment. The new tariffs on Chinese EVs represent a strategic shift with mixed implications for the automotive market, potentially influencing both domestic production and consumer prices. Meanwhile, Algoma Steel’s push towards sustainability could serve as a model for other industries seeking to align with environmental goals.

As these issues unfold, stakeholders across sectors will need to stay informed and adaptable. For policymakers, the challenge will be to support domestic industries while fostering innovation and sustainability, including the dilemma over electricity rates and innovation they must weigh. For businesses, the focus will be on navigating financial pressures and leveraging opportunities for growth. Consumers, in turn, will face the impact of these developments in their daily lives, from the cost of borrowing to the price of electric vehicles.

In summary, Canada’s current economic landscape is characterized by a blend of financial resilience, strategic adjustments, and evolving industry practices, amid policy volatility such as a tariff threat delaying Quebec's green energy bill earlier this year. As the country navigates these crossroads, the outcomes of these developments will play a crucial role in shaping the future economic environment.


Related News

View more

BC Hydro Expects To See Electricity Usage Rise This Holiday Season

BC Hydro Holiday Electricity Usage is set to rise as energy demand increases during peak 4-10 pm on Christmas and Boxing Day, driven by larger gatherings, more cooking, and eased COVID-19 restrictions province-wide.


Key Points

Expected rise in power demand on Christmas and Boxing Day evenings versus 2020, driven by larger gatherings and cooking.

✅ Peak hours 4-10 pm expected to rise in provincial load.

✅ 2020 saw 4% and 7% drops vs 2019 on Christmas and Boxing Day.

✅ Holiday lighting adds ~3% to use; switching to LED can save ~$40.


BC Hydro data showed residential electricity load in the Cariboo and throughout the province, even as drought affects generation dynamics heading into winter, dropped on Christmas Day and Boxing Day in 2020.

Northern Community Relations Manager, Bob Gammer, said the decrease was due in part to more people following the COVID-19 restrictions and not getting together for big meals, even though 2018 Earth Hour usage increased elsewhere illustrates how behavior can sometimes raise demand.

However, this year Gammer said between 4 and 10 pm on those two days, BC Hydro does expect to see a change in overall usage, aligning with all-time high demand trends reported recently in B.C.

“On Christmas Day and Boxing Day, we expect to see increases through those hours and a little bit more so between 4 and 10 pm we should see the amount of power being consumed across the province, as record-breaking 2021 demand indicated earlier, going up compared to what it was on those two days last year.”

In 2020 on Christmas Day evening hydro usage dropped by over 4 percent and Boxing Day evening decreased by 7 percent compared to 2019, whereas regions like Calgary's winter demand have seen spikes during extreme cold.

Gammer added after BC Hydro surveyed their customers and introduced a winter payment plan, they expect to see a lot more cooking happening on Christmas Day and Boxing Day this year as people are intending to have larger gatherings and visit friends.

We asked Gammer about hydro usage when it comes to homes decked out for the holidays, and how that compares to newer loads like crypto mining activity in B.C.

“The Christmas lighting displays people have, not just indoors but outdoors as well, what we’re seeing is about a 3 percent increase in electricity consumption overall through the Christmas season. If people switch, if you still have older lights that are incandescent, switch those over to LED, and through the season it could wind up saving you $40 in electricity just switching over about 8 strings of lights to LED.”


Related News

View more

Cheap oil contagion is clear and present danger to Canada

Canada Oil Recession Outlook analyzes the Russia-Saudi price war, OPEC discord, COVID-19 demand shock, WTI and WCS collapse, Alberta oilsands exposure, U.S. shale stress, and GDP risks from blockades and fiscal responses.


Key Points

An outlook on how the oil price war and COVID-19 demand shock could tip Canada into recession and strain producers.

✅ WTI and WCS prices plunge on OPEC-Russia discord

✅ Alberta oilsands face break-even pressure near 30 USD WTI

✅ RBC flags global recession; GDP hit from blockades, virus


A war between Russia and Saudi Arabia for market share for oil may have been triggered by the COVID-19 pandemic in China, but the oil price crash contagion that it will spread could have impacts that last longer than the virus.

The prospects for Canada are not good.

Plunging oil prices, reduced economic activity from virus containment, and the fallout from weeks of railway blockades over the Coastal GasLink pipeline all add up to “a one-two-three punch that I think is almost inevitably going to put Canada in a position where its growth has to be negative,” said Dan McTeague, a former Liberal MP and current president of Canadians for Affordable Energy. The situation “certainly has the makings” of a recession, said Ken Peacock, chief economist for the Business Council of British Columbia.

“At a minimum, it’s going to be very disruptive and we’re going to have maybe one negative quarter,” Peacock said. “Whether there’s a second one, where it gets labeled a recession, is a different question. But it’s going to generate some turmoil and challenges over the next two quarters – there’s no doubt about that.”

RBC Economics on March 13 announced it now predicts a global recession and cut its growth projections for Canada's economy in 2020 by half a per cent.

Oil price futures plunged 30% last week, dragging stock markets and currencies, including the Canadian dollar, down with them, even as a deep freeze strained U.S. energy systems. That drop came on top of a 17% decline in February, due to falling demand for oil due to the virus.

The latest price plunge – the worst since the 1991 Gulf War – was the result of Russia and the Organization of Petroleum Exporting Countries (OPEC), led by Saudi Arabia, failing to agree on oil production cuts.

The COVID-19 outbreak in China – the world’s second-largest oil consumer – had resulted in a dramatic drop in oil demand in that country, and a sudden glut of oil, with the U.S. energy crisis affecting electricity, gas and EV markets.

OPEC has historically been able to moderate global oil prices by controlling output. But when Russia refused to co-operate with OPEC and agree to production cuts, Saudi Arabia’s state-owned company, Aramco, announced it plans to boost its oil output from 9.7 million barrels per day (bpd) to 12.3 million bpd in April.

In response to that announcement, West Texas Intermediate (WTI) prices dropped 18% to below US$34 per barrel while the Canadian Crude Index fell 24% to US$21. Western Canadian Select dropped 39% to US$15.73.

The effect on Alberta oilsands producers was severe and immediate. Cenovus Energy Inc. (TSX:CVE) saw roughly $2 billion in market cap erased on March 9, when its stock dropped by 52%, which came on top of a 12% drop March 6.

The company responded the very next day by announcing it would cut spending by 32% in 2020, suspend its oil-by-rail program and defer expansion projects.

MEG Energy Corp. (TSX:MEG), which suffered a 56% share price drop on March 9, also announced a 20% reduction in its 2020 capital spending plan.

Peter Tertzakian, chief economist for ARC Energy Research Institute, wrote last week that Russia’s plan is to try to hurt U.S. shale oil producers, who have more than doubled U.S. oil production over the past decade.

Anas Alhajji, a global oil analyst, expects that plan could work. Even before the oil price shock, he had predicted the great shale boom in the U.S. was coming to an end.

“Shale production will decline, and the myth of ‘explosive growth’ will end,” he told Business in Vancouver. “The impact is global and Canadian producers might suffer even more if the oil that Saudi Arabia sends to the U.S. is medium and heavy. This might last longer than what people think.”

The question for Alberta is how Canadian producers can continue to operate through a period of cheap oil. Alberta producers do not compete on the global market. They serve a niche market of U.S. heavy oil refiners, and Biden-era policy is seen as potentially more favourable for Canada’s energy sector than alternatives.

“On the positive side, the industry is battle-hardened,” Tertzakian wrote. “Over the past five years, innovative companies have already learned to endure some of the lowest prices in the world.”

But he added that they need WTI prices of US$30 per barrel just to break even.

“But that’s an average break-even threshold for an industry with a wide variation in costs. That means at that level about half the companies can’t pay their bills and half are treading water.”

Just prior to the oil price plunge, the International Energy Agency (IEA) updated its 2020 forecast for global oil consumption from an 825,000 bpd increase in oil consumption to a 90,000 bpd decrease, due to the COVID-19 virus and consequent economic contraction and reduction in travel.

The IEA predicts global oil demand won’t return to “normal” until the second half of 2020. But even if demand does return to pre-virus levels, that doesn’t mean oil prices will – not if Saudi Arabia can sustain increased oil production at low prices, and evolving clean grid priorities could influence the trajectory too.

The oil plunge was greeted in Alberta with alarm. Alberta Premier Jason Kenney warned Alberta is in “uncharted territory” as consumers are urged to lock in rates and said his government might have to review its balanced budget and resort to emergency deficit spending.

While British Columbians – who pay some of the highest gasoline prices in North America – will enjoy lower gasoline prices at a time when prices are usually starting a seasonal spike, B.C.’s economy could feel knock-on effects from a recession in Alberta.

“We sell a lot of inputs, do a lot of trade with Alberta, so it’s important for B.C., Alberta’s economic health,” Peacock said, “and recent tensions over electricity purchase talks underscore that.”

Last week, the Trudeau government announced $1 billion in emergency funding to cope with the virus and waived a one-week waiting period for unemployment insurance.


Related News

View more

IAEA reactor simulators get more use during Covid-19 lockdown

IAEA Nuclear Reactor Simulators enable virtual nuclear power plant training on IPWR/PWR systems, load-following operations, baseload dynamics, and turbine coupling, supporting advanced reactor education, flexible grid integration, and low-carbon electricity skills development during remote learning.


Key Points

IAEA Nuclear Reactor Simulators are tools for training on reactor operations, safety, and flexible power management.

✅ Simulates IPWR/PWR systems with real-time parameter visualization.

✅ Practices load-following, baseload, and grid flexibility scenarios.

✅ Supports remote training on safety, controls, and turbine coupling.


Students and professionals in the nuclear field are making use of learning opportunities during lockdown made necessary by the Covid-19 pandemic, drawing on IAEA low-carbon electricity lessons for the future.

Requests to use the International Atomic Energy Agency’s (IAEA’s) basic principle nuclear reactor simulators have risen sharply in recent weeks, IAEA said on 1 May, as India takes steps to get nuclear back on track. New users will have the opportunity to learn more about operating them.

“This suite of nuclear power plant simulators is part of the IAEA education and training programmes on technology development of advanced reactors worldwide. [It] can be accessed upon request by interested parties from around the world,” said Stefano Monti, head of the IAEA’s Nuclear Power Technology Development Section.

Simulators include several features to help users understand fundamental concepts behind the behaviour of nuclear plants and their reactors. They also provide an overview of how various plant systems and components work to power turbines and produce low-carbon electricity, while illustrating roles beyond electricity as well.

In the integral pressurised water reactor (IPWR) simulator, for instance, a type of advanced nuclear power design, users can navigate through several screens, each containing information allowing them to adjust certain variables. One provides a summary of reactor parameters such as primary pressure, flow and temperature. Another view lays out the status of the reactor core.

The “Systems” screen provides a visual overview of how the plant’s main systems, including the reactor and turbines, work together. On the “Controls” screen, users can adjust values which affect reactor performance and power output.

This simulator provides insight into how the IPWR works, and also allows users to see how the changes they make to plant variables alter the plant’s operation. Operators can also perform manoeuvres similar to those that would take place in the course of real plant operations e.g. in load following mode.

“Currently, most nuclear plants operate in ‘baseload’ mode, continually generating electricity at their maximum capacity. However, there is a trend of countries, aligned with green industrial revolution strategies, moving toward hybrid energy systems which incorporate nuclear together with a diverse mix of renewable energy sources. A greater need for flexible operations is emerging, and many advanced power plants offer standard features for load following,” said Gerardo Martinez-Guridi, an IAEA nuclear engineer who specialises in water-cooled reactor technology.

Prospective nuclear engineers need to understand the dynamics of the consequences of reducing a reactor’s power output, for example, especially in the context of next-generation nuclear systems and emerging grids, and simulators can help students visualise these processes, he noted.

“Many reactor variables change when the power output is adjusted, and it is useful to see how this occurs in real-time,” said Chirayu Batra, an IAEA nuclear engineer, who will lead the webinar on 12 May.

“Users will know that the operation is complete once the various parameters have stabilised at their new values.”

Observing and comparing the parameter changes helps users know what to expect during a real power manoeuvre, he added.


Related News

View more

World Bank Backs India's Low-Carbon Transition with $1.5 Billion

World Bank Financing for India's Low-Carbon Transition accelerates clean energy deployment, renewable energy capacity, and energy efficiency, channeling climate finance into solar, wind, grid upgrades, and green jobs for sustainable development and climate resilience.


Key Points

$1.5B World Bank support to scale renewables, boost energy efficiency, and drive India's low-carbon growth.

✅ Funds solar, wind, and grid modernization projects

✅ Backs industrial and building energy-efficiency upgrades

✅ Catalyzes green jobs, innovation, and climate resilience


In a significant move towards bolstering India's efforts towards a low-carbon future, the World Bank has approved an additional $1.5 billion in financing. This article explores how this funding aims to support India's transition to cleaner energy sources, informed by global moves toward clean and universal electricity standards and market access, the projects it will fund, and the broader implications for sustainable development.

Commitment to Low-Carbon Transition

India, as one of the world's largest economies, faces substantial challenges in balancing economic growth with environmental sustainability. The country has committed to reducing its carbon footprint and enhancing energy efficiency through various initiatives and partnerships. The World Bank's financing represents a crucial step towards achieving these goals within the context of the global energy transition now underway, providing essential resources to accelerate India's transition towards a low-carbon economy.

Projects Supported by World Bank Funding

The $1.5 billion financing package will support several key projects aimed at advancing India's renewable energy sector and promoting sustainable development practices. These projects may include the expansion of solar and wind energy capacity, enhancing energy efficiency in industries and buildings, improving waste management systems, and fostering innovation in clean technologies.

Impact on Renewable Energy Sector

India's renewable energy sector stands to benefit significantly from the World Bank's financial support. With investments in solar and wind power projects, and broader shifts toward carbon-free electricity across utilities, the country can increase its renewable energy capacity, reduce dependency on fossil fuels, and mitigate greenhouse gas emissions. This expansion not only enhances energy security but also creates opportunities for job creation and economic growth in the clean energy sector.

Enhancing Energy Efficiency

In addition to renewable energy projects, the financing will likely focus on enhancing energy efficiency across various sectors. Improving energy efficiency in industries, transportation, and residential buildings is critical to reducing overall energy consumption, and analyses of decarbonizing Canada's electricity grid highlight how efficiency supports lower carbon emissions and progress toward sustainable development goals. The World Bank's support in this area can facilitate technological advancements and policy reforms that promote energy conservation practices.

Promoting Sustainable Development

The World Bank's financing is aligned with India's broader goals of promoting sustainable development and addressing climate change impacts. By investing in clean energy infrastructure and promoting environmentally sound practices, and amid momentum from the U.S. climate deal that shapes investment expectations, the funding contributes to enhancing resilience to climate risks, improving air quality, and fostering inclusive economic growth that benefits all segments of society.

Collaboration and Partnership

The approval of $1.5 billion in financing underscores the importance of international collaboration and partnership in advancing global climate goals, drawing lessons from China's path to carbon neutrality where relevant. The World Bank's engagement with India demonstrates a commitment to supporting developing countries in their efforts to transition towards sustainable development pathways and build resilience against climate change impacts.

Challenges and Opportunities

Despite the positive impact of the World Bank's financing, India faces challenges such as regulatory barriers, funding constraints, and technological limitations in scaling up renewable energy and energy efficiency initiatives, as well as evolving investor sentiment amid U.S. oil policy shifts that affect energy strategy. Addressing these challenges requires coordinated efforts from government agencies, private sector stakeholders, and international partners to overcome barriers and maximize the impact of investments in sustainable development.

Conclusion

The World Bank's approval of $1.5 billion in financing to support India's low-carbon transition marks a significant milestone in global efforts to combat climate change and promote sustainable development. By investing in renewable energy, enhancing energy efficiency, and fostering innovation, the funding contributes to building a cleaner, more resilient future for India and sets a precedent for international cooperation in addressing pressing environmental challenges worldwide.


Related News

View more

Potent greenhouse gas declines in the US, confirming success of control efforts

US SF6 Emissions Decline as NOAA analysis and EPA mitigation show progress, with atmospheric measurements and Greenhouse Gas Reporting verifying reductions from the electric power grid; sulfur hexafluoride's extreme global warming potential underscores inventory improvements.


Key Points

A documented drop in US sulfur hexafluoride emissions, confirmed by NOAA atmospheric data and EPA reporting reforms.

✅ NOAA towers and aircraft show 2007-2018 decline

✅ EPA reporting and utility mitigation narrowed inventory gaps

✅ Winter leaks and servicing signal further reduction options


A new NOAA analysis shows U.S. emissions of the super-potent greenhouse gas sulfur hexafluoride (SF6) have declined between 2007-2018, likely due to successful mitigation efforts by the Environmental Protection Agency (EPA) and the electric power industry, with attention to SF6 in the power industry across global markets. 

At the same time, significant disparities that existed previously between NOAA’s estimates, which are based on atmospheric measurements, and EPA’s estimates, which are based on a combination of reported emissions and industrial activity, have narrowed following the establishment of the EPA's Greenhouse Gas Reporting Program. The findings, published in the journal Atmospheric Chemistry and Physics, also suggest how additional emissions reductions might be achieved. 

SF6 is most commonly used as an electrical insulator in high-voltage equipment that transmits and distributes electricity, and its emissions have been increasing worldwide as electric power systems expand, even as regions hit milestones like California clean energy surpluses in recent years. Smaller amounts of SF6 are used in semiconductor manufacturing and in magnesium production. 

SF6 traps 25,000 times more heat than carbon dioxide over a 100-year time scale for equal amounts of emissions, and while CO2 emissions flatlined in 2019 globally, that comparison underscores the potency of SF6. That means a relatively small amount of the gas can have a significant impact on climate warming. Because of its extremely large global warming potential and long atmospheric lifetime, SF6 emissions will influence Earth’s climate for thousands of years.

In this study, researchers from NOAA’s Global Monitoring Laboratory, as record greenhouse gas concentrations drive demand for better data, working with colleagues at EPA, CIRES, and the University of Maryland, estimated U.S. SF6 emissions for the first time from atmospheric measurements collected at a network of tall towers and aircraft in NOAA’s Global Greenhouse Gas Reference Network. The researchers provided an estimate of SF6 emissions independent from the EPA’s estimate, which is based on reported SF6 emissions for some industrial facilities and on estimated SF6 emissions for others.

“We observed differences between our atmospheric estimates and the EPA’s activity-based estimates,” said study lead author Lei Hu, a Global Monitoring Laboratory researcher who was a CIRES scientist at the time of the study. “But by closely collaborating with the EPA, we were able to identify processes potentially responsible for a significant portion of this difference, highlighting ways to improve emission inventories and suggesting additional emission mitigation opportunities, such as forthcoming EPA carbon capture rules for power plants, in the future.” 

In the 1990s, the EPA launched voluntary partnerships with the electric power, where power-sector carbon emissions are falling as generation shifts, magnesium, and semiconductor industries to reduce SF6 emissions after the United States recognized that its emissions were significant. In 2011, large SF6 -emitting facilities were required to begin tracking and reporting their emissions under the EPA Greenhouse Gas Reporting Program. 

Hu and her colleagues documented a decline of about 60 percent in U.S. SF6 emissions between 2007-2018, amid global declines in coal-fired power in some years—equivalent to a reduction of between 6 and 20 million metric tons of CO2 emissions during that time period—likely due in part to the voluntary emission reduction partnerships and the EPA reporting requirement. A more modest declining trend has also been reported in the EPA’s national inventories submitted annually under the United Nations Framework Convention on Climate Change. 

Examining the differences between the NOAA and EPA independent estimates, the researchers found that the EPA’s past inventory analyses likely underestimated SF6 emissions from electrical power transmission and distribution facilities, and from a single SF6 production plant in Illinois. According to Hu, the research collaboration has likely improved the accuracy of the EPA inventories. The 2023 draft of the EPA’s U.S. Greenhouse Gas Emissions and Sinks: 1990-2021 used the results of this study to support revisions to its estimates of SF6 emissions from electrical transmission and distribution. 

The collaboration may also lead to improvements in the atmosphere-based estimates, helping NOAA identify how to expand or rework its network to better capture emitting industries or areas with significant emissions, according to Steve Montzka, senior scientist at GML and one of the paper’s authors.

Hu and her colleagues also found a seasonal variation in SF6 emissions from the atmosphere-based analysis, with higher emissions in winter than in summer. Industry representatives identified increased servicing of electrical power equipment in the southern states and leakage from aging brittle sealing materials in the equipment in northern states during winter as likely explanations for the enhanced wintertime emissions—findings that suggest opportunities for further emissions reductions.

“This is a great example of the future of greenhouse gas emission tracking, where inventory compilers and atmospheric scientists work together to better understand emissions and shed light on ways to further reduce them,” said Montzka.


Related News

View more

Sign Up for Electricity Forum’s Newsletter

Stay informed with our FREE Newsletter — get the latest news, breakthrough technologies, and expert insights, delivered straight to your inbox.

Electricity Today T&D Magazine Subscribe for FREE

Stay informed with the latest T&D policies and technologies.
  • Timely insights from industry experts
  • Practical solutions T&D engineers
  • Free access to every issue

Download the 2025 Electrical Training Catalog

Explore 50+ live, expert-led electrical training courses –

  • Interactive
  • Flexible
  • CEU-cerified