Canada's looming power problem is massive but not insurmountable: report


power tower

NFPA 70e Training - Arc Flash

Our customized live online or in‑person group training can be delivered to your staff at your location.

  • Live Online
  • 6 hours Instructor-led
  • Group Training Available
Regular Price:
$199
Coupon Price:
$149
Reserve Your Seat Today

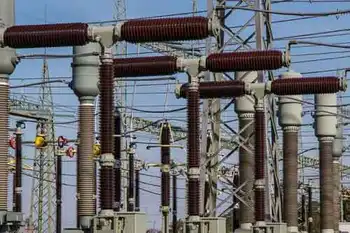
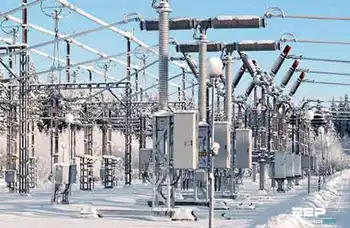
Canada Net-Zero Electricity Buildout will double or triple power capacity, scaling clean energy, renewables, nuclear, hydro, and grid transmission, with faster permitting, Indigenous consultation, and trillions in investment to meet 2035 non-emitting regulations.


Key Points

A national plan to rapidly expand clean, non-emitting power and grid capacity to enable a net-zero economy by 2050.

✅ Double to triple generation; all sources non-emitting by 2035

✅ Accelerate permitting, transmission, and Indigenous partnerships

✅ Trillions in investment; cross-jurisdictional coordination


Canada must build more electricity generation in the next 25 years than it has over the last century in order to support a net-zero emissions economy by 2050, says a new report from the Public Policy Forum.

Reducing our reliance on fossil fuels and shifting to emissions-free electricity, as provinces such as Ontario pursue new wind and solar to ease a supply crunch, to propel our cars, heat our homes and run our factories will require doubling — possibly tripling — the amount of power we make now, the federal government estimates.

"Imagine every dam, turbine, nuclear plant and solar panel across Canada and then picture a couple more next to them," said the report, which will be published Wednesday.

It's going to cost a lot, and in Ontario, greening the grid could cost $400 billion according to one report. Most estimates are in the trillions.

It's also going to require the kind of cross-jurisdictional co-operation, with lessons from Europe's power crisis underscoring the stakes, Indigenous consultation and swift decision-making and construction that Canada just isn't very good at, the report said.

"We have a date with destiny," said Edward Greenspon, president of the Public Policy Forum. "We need to build, build, build. We're way behind where we need to be and we don't have a lot of a lot of time remaining."

Later this summer, Environment Minister Steven Guilbeault will publish new regulations to require that all power be generated from non-emitting sources by 2035 clean electricity goals, as proposed.

Greenspon said that means there are two major challenges ahead: massively expanding how much power we make and making all of it clean, even though some natural gas generation will be permitted under federal rules.

On average, it takes more than four years just to get a new electricity generating project approved by Ottawa, and more than three years for new transmission lines.

That's before a single shovel touches any dirt.

Building these facilities is another thing, and provinces such as Ontario face looming electricity shortfalls as projects drag on. The Site C dam in British Columbia won't come on line until 2025 and has been under construction since 2015. A new transmission line from northern Manitoba to the south took more than 11 years from the first proposal to operation.

"We need to move very quickly, and probably with a different approach ... no hurdles, no timeouts," Greenspon said.

There are significant unanswered questions about the new power mix, and the pace at which Canada moves away from fossil fuel power is one of the biggest political issues facing the country, with debates over whether scrapping coal-fired electricity is cost-effective still unresolved.


Related News

Related News

BC Hydro electricity demand down 10% amid COVID-19 pandemic

BC Hydro electricity demand decline reflects COVID-19 impacts across British Columbia, with reduced industrial load, full reservoirs, strategic spilling, and potential rate increases, as hydropower plants adjust operations at Seven Mile, Revelstoke, and Site C.


Key Points

A 10% COVID-19-driven drop in BC power use, prompting reservoir spilling, plant curtailment, and potential rate hikes.

✅ 10% load drop; industrial demand down 7% since mid-March

✅ Reservoirs near capacity; controlled spilling to mitigate risk

✅ Possible rate hikes; Site C construction continues


Elecricity demand is down 10 per cent across British Columbia, an unprecedented decline in commercial electricity consumption sparked by the COVID-19 pandemic, according to a BC Hydro report.

Power demand across hotels, offices, recreational facilities and restaurants have dwindled as British Columbians self isolate, and bill relief for residents and businesses was introduced during this period.

The shortfall means there's a surplus of water in reservoirs across the province.

"This drop in load in addition to the spring snow melt is causing our reservoirs to reach near capacity, which could lead to environmental concerns, as well as public safety risks if we don't address the challenges now," said spokesperson Tanya Fish.

Crews will have to strategically spill reservoirs to keep them from overflowing, a process that can have negative impacts on downstream ecosystems. Excessive spilling can increase fish mortality rates.

Spilling is currently underway at the Seven Mile and Revelstoke reservoirs. In addition, several small plants have been shut down.

Site C and hydro rates
According to the report, titled Demand Dilemma, the decline could continue into April 2021 and drop by another two per cent, even as a regulator report alleged BC Hydro misled oversight bodies.

Major industry — forestry, mining and oil and gas — accounts for about 30 per cent of BC Hydro's overall electricity load. Energy demand from these customers has dropped by seven per cent since mid-March, while in Manitoba a Consumers Coalition has urged rejection of proposed rate increases.

BC Hydro says a prolonged drop in demand could have an impact on future rates, which could potentially go up as the power provider looks to recoup deferred operating costs and financial losses.

In Manitoba, Manitoba Hydro's debt has grown significantly, underscoring the financial risks utilities face during demand shocks.

Fish said the crown corporation still expects there to be increased demand in the long-term. She said construction of the Site C Dam is continuing as planned to support clean-energy generation in the province. There are currently nearly 1,000 workers on-site.


Related News

View more

EIA expects solar and wind to be larger sources of U.S. electricity generation this summer

US Summer Electricity Outlook 2022 projects rising renewable energy generation as utility-scale solar and wind capacity additions surge, while coal declines and natural gas shifts amid higher fuel prices and regional supply constraints.


Key Points

An EIA forecast of summer 2022 power: more solar and wind, less coal, and shifting gas use amid higher fuel prices.

✅ Solar +10 million MWh; wind +8 million MWh vs last summer

✅ Coal generation -20 million MWh amid supply constraints, retirements

✅ Gas prices near $9/MMBtu; slight national gen decline


In our Summer Electricity Outlook, a supplement to our May 2022 Short-Term Energy Outlook, we expect the largest increases in U.S. electric power sector generation this summer will come from renewable energy sources such as wind and solar generation. These increases are the result of new capacity additions. We forecast utility-scale solar generation between June and August 2022 will grow by 10 million megawatthours (MWh) compared with the same period last summer, and wind generation will grow by 8 million MWh. Forecast generation from coal and natural gas declines by 26 million MWh this summer, although natural gas generation could increase in some electricity markets where coal supplies are constrained.

For recent context, overall U.S. power generation in January rose 9.3% year over year, the EIA reports.

Wind and solar power electric-generating capacity has been growing steadily in recent years. By the start of June, we estimate the U.S. electric power sector will have 65 gigawatts (GW) of utility-scale solar-generating capacity, a 31% increase in solar capacity since June 2021. Almost one-third of this new solar capacity will be built in the Texas electricity market. The electric power sector will also have an estimated 138 GW of wind capacity online this June, which is a 12% increase from last June.

Along with growth in renewables capacity, we expect that an additional 6 GW of new natural gas combined-cycle generating capacity will come online by June 2022, an increase of 2% from last summer. Despite this increase in capacity, we expect natural gas-fired electricity generation at the national level will be slightly (1.3%) lower than last summer.

We forecast the price of natural gas delivered to electric generators will average nearly $9 per million British thermal units between June and August 2022, which would be more than double the average price last summer. The higher expected natural gas prices and growth in renewable generation will likely lead to less natural gas-fired generation in some regions of the country.

In contrast to renewables and natural gas, the electricity industry has been steadily retiring coal-fired power plants over the past decade. Between June 2021 and June 2022, the electric power sector will have retired 6 GW (2%) of U.S. coal-fired generating capacity.

In previous years, higher natural gas prices would have resulted in more coal-fired electricity generation across the fleet. However, coal-fired power plants have been limited in their ability to replenish their historically low inventories in recent months as a result of mine closures, rail capacity constraints, and labor market tightness. These coal supply constraints, along with continued retirement of generating capacity, contribute to our forecast that U.S. coal-fired generation will decline by 20 million MWh (7%) this summer. In some regions of the country, these coal supply constraints may lead to increased natural gas-fired electricity generation despite higher natural gas prices.


Related News

View more

Nova Scotia Power says it now generates 30 per cent of its power from renewables

Nova Scotia Power Renewable Energy delivers 30% in 2018, led by wind power, hydroelectric and biomass, with coal and natural gas declining, as Muskrat Falls imports from Labrador target 40% renewables to cut emissions.


Key Points

It is the utility's 30% 2018 renewable mix and plan to reach 40% via Muskrat Falls while reducing carbon emissions.

✅ 18% wind, 9% hydro and tidal, 3% biomass in 2018

✅ Coal reliance fell from 76% in 2007 to 52% in 2018

✅ 58% carbon emissions cut from 2005 levels projected by 2030


Nova Scotia's private utility says it has hit a new milestone in its delivery of electricity from renewable resources, a trend highlighted by Summerside wind generation in nearby P.E.I.

Nova Scotia Power says 30 per cent of the electricity it produced in 2018 came from renewable sources such as wind power.

The utility says 18 per cent came from wind turbines, nine per cent from hydroelectric and tidal turbines and three per cent by burning biomass.

However, over half of the province's electrical generation still comes from the burning of coal or petroleum coke. Another 13 per cent come from burning natural gas and five per cent from imports, even as U.S. renewable generation hits record shares.

The utility says that since 2007, the province's reliance on coal-fired plants has dropped from 76 per cent of electricity generated to 52 per cent last year, as Prairie renewables growth accelerates nationally.

It says it expects to meet the province's legislated renewable target of 40 per cent in 2020, when it begins accessing hydroelectricity from the Muskrat Falls project in Labrador.

"We have made greener, cleaner energy a priority," utility president and CEO Karen Hutt said in a news release.

"As we continue to achieve new records in renewable electricity, we remain focused on ensuring electricity prices stay predictable and affordable for our customers, including solar customers across the province."

Nova Scotia Power also projects achieving a 58 per cent reduction in carbon emissions from 2005 levels by 2030.


Related News

View more

Four Facts about Covid and U.S. Electricity Consumption

COVID-19 Impact on U.S. Electricity Consumption shows commercial and industrial demand dropped as residential use rose, with flattened peak loads, weekday-weekend convergence, Texas hourly data, and energy demand as a real-time economic indicator.


Key Points

It reduced commercial and industrial demand while raising residential use, shifting peaks and weekday patterns.

✅ Commercial electricity down 12%; industrial down 14% in Q2 2020

✅ Residential use up 10% amid work-from-home and lockdowns

✅ Peaks flattened; weekday-weekend loads converged in Texas


This is an important turning point for the United States. We have a long road ahead. But one of the reasons I’m optimistic about Biden-Harris is that we will once again have an administration that believes in science.

To embrace this return to science, I want to write today about a fascinating new working paper by Tufts economist Steve Cicala.

Professor Cicala has been studying the effect of Covid on electricity consumption since back in March, when the Wall Street Journal picked up his work documenting an 18% decrease in electricity consumption in Italy.

The new work, focused on the United States, is particularly compelling because it uses data that allows him to distinguish between residential, commercial, and industrial sectors, against a backdrop of declining U.S. electricity sales over recent years.

Without further ado, here are four facts he uncovers about Covid and U.S. electricity demand during COVID-19 and consumption.


Fact #1: Firms Are Using Less
U.S. commercial electricity consumption fell 12% during the second quarter of 2020. U.S. industrial electricity consumption fell 14% over the same period.

This makes sense. The second quarter was by some measures, the worst quarter for the U.S. economy in over 145 years!

Economic activity shrank. Schools closed. Offices closed. Factories closed. Restaurants closed. Malls closed. Even health care offices closed as patients delayed going to the dentist and other routine care. All this means less heating and cooling, less lighting, less refrigeration, less power for computers and other office equipment, less everything.

The decrease in the industrial sector is a little more surprising. My impression had been that the industrial sector had not fallen as far as commercial, but amid broader disruptions in coal and nuclear power that strained parts of the energy economy, the patterns for both sectors are quite similar with the decline peaking in May and then partially rebounding by July. The paper also shows that areas with higher unemployment rates experienced larger declines in both sectors.


Fact #2: Households Are Using More
While firms are using less, households are using more. U.S. residential electricity consumption increased 10% during the second quarter of 2020. Consumption surged during March, April, and May, a reflection of the lockdown lifestyle many adopted, and then leveled off in June and July – with much less of the rebound observed on the commercial/industrial side.

This pattern makes sense, too. In Professor Cicala’s words, “people are spending an inordinate amount of time at home”. Many of us switched over to working from home almost immediately, and haven’t looked back. This means more air conditioning, more running the dishwasher, more CNN (especially last week), more Zoom, and so on.

The paper also examines the correlates of the decline. Areas in the U.S. where more people can work from home experienced larger increases. Unemployment rates, however, are almost completely uncorrelated with the increase.


Fact #3: Firms are Less Peaky
The paper next turns to a novel dataset from Texas, where Texas grid reliability is under active discussion, that makes it possible to measure hourly electricity consumption by sector.

As the figure above illustrates, the biggest declines in commercial/industrial electricity consumption have occurred Monday through Friday between 9AM and 5PM.

The dashed line shows the pattern during 2019. Notice the large spikes in electricity consumption during business hours. The solid line shows the pattern during 2020. Much smaller spikes during business hours.


Fact #4: Everyday is Like Sunday
Finally, we have what I would like to nominate as the “Energy Figure of the Year”.

Again, start with the pattern for 2019, reflected by the dashed line. Prior to Covid, Texas households used a lot more electricity on Saturdays and Sundays.

Then along comes Covid, and turned every day into the weekend. Residential electricity consumption in Texas during business hours Monday-Friday is up 16%(!).

In the pattern for 2020, it isn’t easy to distinguish weekends from weekdays. If you feel like weekdays and weekends are becoming a big blur – you are not alone.


Conclusion
Researchers are increasingly thinking about electricity consumption as a real-time indicator of economic activity, even as flat electricity demand complicates utility planning and investment. This is an intriguing idea, but Professor Cicala’s new paper shows that it is important to look sector-by-sector.

While commercial and industrial consumption indeed seem to measure the strength of an economy, residential consumption has been sharply countercylical – increasing exactly when people are not at work and not at school.

These large changes in behavior are specific to the pandemic. Still, with the increased blurring of home and non-home activities we may look back on 2020 as a key turning point in how we think about these three sectors of the economy.

More broadly, Professor Cicala’s paper highlights the value of social science research. We need facts, data, and yes, science, if we are to understand the economy and craft effective policies on energy insecurity and shut-offs as well.


Related News

View more

Energy dashboard: how is electricity generated in Great Britain?

Great Britain electricity generation spans renewables and baseload: wind, solar, nuclear, gas, and biomass, supported by National Grid interconnectors, embedded energy estimates, and BMRS data for dynamic imports and exports across Europe.


Key Points

A diverse, weather-driven mix of renewables, gas, nuclear, and imports coordinated by National Grid.

✅ Baseload from nuclear and biomass; intermittent wind and solar

✅ Interconnectors trade zero carbon imports via subsea cables

✅ Data from BMRS and ESO covers embedded energy estimates


Great Britain has one of the most diverse ranges of electricity generation in Europe, with everything from windfarms off the coast of Scotland to a nuclear power station in Suffolk tasked with keeping the lights on. The increasing reliance on renewable energy sources, as part of the country’s green ambitions, also means there can be rapid shifts in the main source of electricity generation. On windy days, most electricity generation comes from record wind generation across onshore and offshore windfarms. When conditions are cold and still, gas-fired power stations known as peaking plants are called into action.

The electricity system in Great Britain relies on a combination of “baseload” power – from stable generators such as nuclear and biomass plants – and “intermittent” sources, such as wind and solar farms that need the right weather conditions to feed energy into the grid. National Grid also imports energy from overseas, through subsea cables known as interconnectors that link to France, Belgium, Norway and the Netherlands. They allow companies to trade excess power, such as renewable energy created by the sun, wind and water, between different countries. By 2030 it is hoped that 90% of the energy imported by interconnectors will be from zero carbon energy sources, though low-carbon electricity generation stalled in 2019 for the UK.

The technology behind Great Britain’s power generation has evolved significantly over the last century, and at times wind has been the main source of electricity. The first integrated national grid in the world was formed in 1935 linking seven regions of the UK. In the aftermath of industrialisation, coal provided the vast majority of power, before oil began to play an increasingly important part in the 1950s. In 1956, the world’s first commercial nuclear reactor, Calder Hall 1 at Windscale (later Sellafield), was opened by Queen Elizabeth II. Coal use fell significantly in the 1990s while the use of combined cycle gas turbines grew, and in 2016 wind generated more electricity than coal for the first time. Now a combination of gas, wind, nuclear and biomass provide the bulk of Great Britain’s energy, with smaller sources such as solar and hydroelectric power also used. From October 2024, coal will no longer be used to generate electricity, following coal-free power records set in recent years.

Energy generation data is fetched from the Balancing Mechanism Reporting Service public feed, provided by Elexon – which runs the wholesale energy market – and is updated every five minutes, covering periods when wind led the power mix as well.

Elexon’s data does not include embedded energy, which is unmetered and therefore invisible to Great Britain’s National Grid. Embedded energy comprises all solar energy and wind energy generated from non-metered turbines. To account for these figures we use embedded energy estimates from the National Grid electricity system operator, which are published every 30 minutes.

Import figures refer to the net flow of electricity from the interconnectors with Europe and with Northern Ireland. A positive value represents import into the GB transmission system, while a negative value represents an export.

Hydro figures combine renewable run-of-the-river hydropower and pumped storage.

Biomass figures include Elexon’s “other” category, which comprises coal-to-biomass conversions and biomass combined heat and power plants.


Related News

View more

Could selling renewable energy be Alberta's next big thing?

Alberta Renewable Energy Procurement is surging as corporate PPAs drive wind and solar growth, with the Pembina Institute and the Business Renewables Centre linking buyers and developers in Alberta's energy-only market near Medicine Hat.


Key Points

A market-led approach where corporations use PPAs to secure wind and solar power from Alberta projects.

✅ Corporate PPAs de-risk projects and lock in clean power.

✅ Alberta's energy-only market enables efficient transactions.

✅ Skilled workforce supports wind, solar, legal, and financing.


Alberta has big potential when it comes to providing renewable energy, advocates say.

The Pembina Institute says the practice of corporations committing to buy renewable energy is just taking off in Canada, and Alberta has both the energy sector and the skilled workforce to provide it.

Earlier this week, a company owned by U.S. billionaire Warren Buffett announced a large new wind farm near Medicine Hat. It has a buyer for the power.

Sara Hastings-Simon, director of the Pembina's Business Renewables Centre, says this is part of a trend.

"We're talking about the practice of corporate institutions purchasing renewables to meet their own electricity demand. And this is a really well-established driver for renewable energy development in the U.S.," she said. "You may be hearing headlines like Google, Apple and others that are buying renewables and we're helping to bring this practice to Canada."

The Business Renewables Centre (BRC) is a not-for-profit working to accelerate corporate and institutional procurement of renewables in Canada. The group held its inaugural all members event in Calgary on Thursday.

Hastings-Simon says shareholders and investors are encouraging more use of solar and wind power in Canada.

"We have over 10 gigawatts of renewable energy projects in the pipeline that are ready for buyers. And so we see multinational companies coming to Canada to start to procure here, as well as Canadian companies understanding that this is an opportunity for them as well," Hastings-Simon said.

"It's really exciting to see business interests driving renewable energy development."

Sara Hastings-Simon is the director of the Pembina Institute's Business Renewables Centre, which seeks to build up Alberta's renewable energy industry. (Mike Symington/CBC)

Hastings-Simon says renewable procurement could help dispel the narrative that it's all about oil and gas in Alberta by highlighting Alberta as a powerhouse for both green energy and fossil fuels in Canada.

She says the practice started with a handful of tech companies in the U.S. and has become more mainstream there, even as Canada remains a solar laggard to some observers, with more and more large companies wanting to reduce their energy footprint.

He says his U.S.-based organization has been working for years to speed up and expand the renewables market for companies that want to address their own sustainability.

"We try and make that a little bit easier by building out a community that can help to really reinforce each other, share lessons learned, best practices and then drive for transactions to have actual material impact worldwide," he said.

"We're really excited to be working with the Pembina group and the BRC Canada team," he said. "We feel our best value for this is just to support them with our experiences and lessons. They've been basically doing the same thing for many years helping to grow and grow and cultivate the market."


Porter says Alberta's market is more than ready.

"There are some precedent transactions already so people know it can work," he said. "The way Alberta is structured, being an energy-only market is useful. And I think that there is a strong ecosystem of both budget developers and service providers … that can really help these transactions get over the line."

As procurement ramps up, Hastings-Simon says Alberta already has the skilled workers needed to fill renewable energy jobs across the province.

"We have a lot of the knowledge that's needed, and that's everybody from the construction down through the legal and financing — all those pieces of building big projects," she said. "We are seeing increasing interest in people that want to become involved in that industry, and so there is increasing demand for training in things like solar power installation and wind technicians."

Hastings-Simon predicts an increase in demand for both the services and the workers.

"As this industry ramps up, we're going to need to have more workers that are active in those areas," she said. "So I think we can see a very nice increase — both the demand and the number of folks that are able to work in this field."


Related News

View more

Sign Up for Electricity Forum’s Newsletter

Stay informed with our FREE Newsletter — get the latest news, breakthrough technologies, and expert insights, delivered straight to your inbox.

Electricity Today T&D Magazine Subscribe for FREE

Stay informed with the latest T&D policies and technologies.
  • Timely insights from industry experts
  • Practical solutions T&D engineers
  • Free access to every issue

Live Online & In-person Group Training

Advantages To Instructor-Led Training – Instructor-Led Course, Customized Training, Multiple Locations, Economical, CEU Credits, Course Discounts.

Request For Quotation

Whether you would prefer Live Online or In-Person instruction, our electrical training courses can be tailored to meet your company's specific requirements and delivered to your employees in one location or at various locations.