Record heat causing Saudi power outages

By Associated Press


NFPA 70e Training - Arc Flash

Our customized live online or in‑person group training can be delivered to your staff at your location.

  • Live Online
  • 6 hours Instructor-led
  • Group Training Available
Regular Price:
$199
Coupon Price:
$149
Reserve Your Seat Today
Blistering summer temperatures coupled with a sandstorm caused power failures in western Saudi Arabia, as the region suffered from a debilitating heat wave.

The skyrocketing demand for demand for electricity to power air conditioners forced eight power turbines to go off line, causing several Saudi cities to lose their power, said the Saudi Electricity Company.

"Blackouts are taking place this summer because of an increase in the electrical loads," company official Ahmed al-Dubekhi said in a recent statement.

Speaking before the turbine failures, he maintained that the company was prepared for the spikes in demand.

Temperatures in Saudi Arabia reached 124 degrees 50 degrees Celsius, several degrees above average. Energy shortages often happen between May and September during the searing Gulf summers.

"Such blackouts are not uncommon for the region, which has been suffering and will continue to suffer over the next couple years in the summer due to their inability to meet their electricity demands," said Samuel Ciszuk, IHS Global Insight Middle East Energy analyst.

While Saudi Arabia has struggled to increase its electrical capacity, its situation is not as tough as that of neighboring Iraq and Kuwait.

Kuwait, for example, often suffers daily blackouts in the summer months.

Just recently, temperatures of up to 126 degrees 52 Celsius pushed power stations in Kuwait to 99 percent of their production capacity of around 11,000 megawatts.

Kuwait's parliament recommended to cut the working day for public sector employees in order to conserve energy. A parliament discussion of the country's power problems is slated soon.

Soaring temperatures and lengthy power outages in Iraq have resulted in protests in two southern cities and the resignation of the electricity minister.

Related News

In 2021, 40% Of The Electricity Produced In The United States Was Derived From Non-Fossil Fuel Sources

Renewable Electricity Generation is accelerating the shift from fossil fuels, as wind, solar, and hydro boost the electric power sector, lowering emissions and overtaking nuclear while displacing coal and natural gas in the U.S. grid.


Key Points

Renewable electricity generation is power from non-fossil sources like wind, solar, and hydro to cut emissions.

✅ Driven by wind, solar, and hydro adoption

✅ Reduces fossil fuel dependence and emissions

✅ Increasing share in the electric power sector


The transition to electric vehicles is largely driven by a need to reduce our reliance on fossil fuels and reduce emissions associated with burning fossil fuels, while declining US electricity use also shapes demand trends in the power sector. In 2021, 40% of the electricity produced by the electric power sector was derived from non-fossil fuel sources.

Since 2007, the increase in non-fossil fuel sources has been largely driven by “Other Renewables” which is predominantly wind and solar. This has resulted in renewables (including hydroelectric) overtaking nuclear power’s share of electricity generation in 2021 for the first time since 1984. An increasing share of electricity generation from renewables has also led to a declining share of electricity from fossil fuel sources like coal, natural gas, and petroleum, with renewables poised to eclipse coal globally as deployment accelerates.

Includes net generation of electricity from the electric power sector only, and monthly totals can fluctuate, as seen when January power generation jumped on a year-over-year basis.

Net generation of electricity is gross generation less the electrical energy consumed at the generating station(s) for station service or auxiliaries, and the projected mix of sources is sensitive to policies and natural gas prices over time. Electricity for pumping at pumped-storage plants is considered electricity for station service and is deducted from gross generation.

“Natural Gas” includes blast furnace gas and other manufactured and waste gases derived from fossil fuels, while in the UK wind generation exceeded coal for the first time in 2016.

“Other Renewables” includes wood, waste, geo-thermal, solar and wind resources among others.

“Other” category includes batteries, chemicals, hydrogen, pitch, purchased steam, sulfur, miscellaneous technologies, and, beginning in 2001, non-renewable waste (municipal solid waste from non-biogenic sources, and tire-derived fuels), noting that trends vary by country, with UK low-carbon generation stalling in 2019.


Related News

View more

Opinion: Cleaning Up Ontario's Hydro Mess - Ford government needs to scrap the Fair Hydro Plan and review all options

Ontario Hydro Crisis highlights soaring electricity rates, costly subsidies, nuclear refurbishments, and stalled renewables in Ontario. Policy missteps, weak planning, and rising natural gas emissions burden ratepayers while energy efficiency and storage remain underused.


Key Points

High power costs and subsidies from policy errors, nuclear refurbishments, stalled efficiency and renewables in Ontario.

✅ $5.6B yearly subsidy masks electricity rates and deficits

✅ Nuclear refurbishments embed rising costs for decades

✅ Efficiency, storage, and DERs stalled amid weak planning


By Mark Winfield

While the troubled Site C and Muskrat Falls hydroelectric dam projects in B.C. and Newfoundland and Labrador have drawn a great deal of national attention over the past few months, Ontario has quietly been having a hydro crisis of its own.

One of the central promises in the 2018 platform of the Ontario Progressive Conservative party was to “clean up the hydro mess,” and then-PC leader Doug Ford vowed to fire Hydro One's leadership as part of that effort. There certainly is a mess, with the costs of subsidies taken from general provincial revenues to artificially lower hydro rates nearing $7 billion annually. That is a level approaching the province’s total pre-COVID-19 annual deficit. After only two years, that will also exceed total expected cost overruns of the Site C and Muskrat Falls projects, currently estimated at $12 billion ($6 billion each).

There is no doubt that Doug Ford’s government inherited a significant mess around the province’s electricity system from the previous Liberal governments of former premiers Dalton McGuinty and Kathleen Wynne. But the Ford government has also demonstrated a remarkable capacity for undoing the things its predecessors had managed to get right while doubling down on their mistakes.

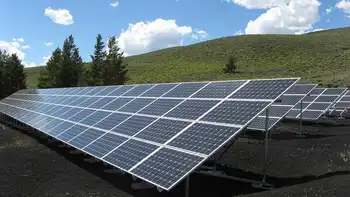
The Liberals did have some significant achievements. Most notably: coal-fired electricity generation, which constituted 25 per cent of the province’s electricity supply in the early 2000s, was phased out in 2014. The phaseout dramatically improved air quality in the province. There was also a significant growth in renewable energy production. From  virtually zero in 2003, the province installed 4,500 MW of wind-powered generation, and 450 MW of solar photovoltaic by 2018, a total capacity more than double that of the Sir Adam Beck Generating Stations at Niagara Falls.

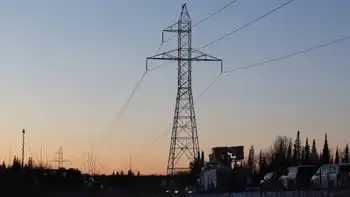
At the same time, public concerns over rising hydro rates flowing from a major reconstruction of the province’s electricity system from 2003 onwards became a central political issue in the province. But rather than reconsider the role of the key drivers of the continuing rate increases – namely the massively expensive and risky refurbishments of the Darlington and Bruce nuclear facilities, the Liberals adopted a financially ruinous Fair Hydro Plan. The central feature of the 2017 plan was a short-term 25 per cent reduction in hydro rates, financed by removing the provincial portion of the HST from hydro bills, and by extending the amortization period for capital projects within the system. The total cost of the plan in terms of lost revenues and financing costs has been estimated in excess of $40 billion over 29 years, with the burden largely falling on future ratepayers and taxpayers.


Decision-making around the electricity system became deeply politicized, and a secret cabinet forecast of soaring prices intensified public debate across Ontario. Legislation adopted by the Wynne government in 2016 eliminated the requirement for the development of system plans to be subject to any form of meaningful regulatory oversight or review. Instead, the system was guided through directives from the provincial cabinet. Major investments like the Darlington and Bruce refurbishments proceeded without meaningful, public, external reviews of their feasibility, costs or alternatives.

The Ford government proceeded to add more layers to these troubles. The province’s relatively comprehensive framework for energy efficiency was effectively dismantled in March, 2019, with little meaningful replacement. That was despite strong evidence that energy efficiency offered the most cost-effective strategy for reducing greenhouse gas emissions and electricity costs.

The Ford government basically retained the Fair Hydro Plan and promised further rate reductions, later tabling legislation to lower electricity rates as well. To its credit, the government did take steps to clarify real costs of the plan. Last year, these were revealed to amount to a de facto $5.6 billion-per-year subsidy coming from general revenues, and rising. That constituted the major portion of the province’s $7.4 billion pre-COVID-19 deficit. The financial hole was deepened further through November’s financial statement, with the addition of a further $1.3 billion subsidy to commercial and industrial consumers. The numbers can only get worse as the costs of the Darlington and Bruce refurbishments become embedded more fully into electricity rates.

The government also quietly dispensed with the last public vestige of an energy planning framework, relieving itself of the requirement to produce a Long-Term Energy Plan every three years. The next plan would normally have been due next month, in February.

Even the gains from the 2014 phaseout of coal-fired electricity are at risk. Major increases are projected in emissions of greenhouse gases, smog-causing nitrogen oxides and particulate matter from natural gas-fired power plants as the plants are run to cover electricity needs during the Bruce and Darlington refurbishments over the next decade. These developments could erode as much as 40 per cent of the improvements in air quality and greenhouse gas emission gained through the coal phaseout.

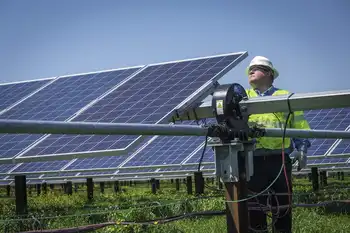
The province’s activities around renewable energy, energy storage and distributed energy resources are at a standstill, with exception of a few experimental “sandbox” projects, while other jurisdictions face profound electricity-sector change and adapt. Globally, these technologies are seen as the leading edge of energy-system development and decarbonization. Ontario seems to have chosen to make itself an energy innovation wasteland instead.

The overall result is a system with little or no space for innovation that is embedding ever-higher costs while trying to disguise those costs at enormous expense to the provincial treasury and still failing to provide effective relief to low-income electricity consumers.

The decline in electricity demand associated with the COVID-19 pandemic, along with the introduction of a temporary recovery rate for electricity, gives the province an opportunity to step back and consider its next steps with the electricity system. A phaseout of the Fair Hydro Plan electricity-rate reduction and its replacement with a more cost-effective strategy of targeted relief aimed at those most heavily burdened by rising hydro rates, particularly rural and low-income consumers, as reconnection efforts for nonpayment have underscored the hardship faced by many households, would be a good place to start.

Next, the province needs to conduct a comprehensive, public review of electricity options available to it, including additional renewables – the costs of which have fallen dramatically over the past decade – distributed energy resources, hydro imports from Quebec and energy efficiency before proceeding with further nuclear refurbishments.

In the longer term, a transparent, evidence-based process for electricity system planning needs to be established – one that is subject to substantive public and regulatory oversight and review. Finally, the province needs to establish a new organization to be called Energy Efficiency Ontario to revive its efforts around energy efficiency, developing a comprehensive energy-efficiency strategy for the province, covering electricity and natural gas use, and addressing the needs of marginalized communities.

Without these kinds of steps, the province seems destined to continue to lurch from contradictory decision after contradictory decision as the economic and environmental costs of the system’s existing trajectory continue to rise.

Mark Winfield is a professor of environmental studies at York University and co-chair of the university’s Sustainable Energy Initiative.


Related News

View more

Australia PM rules out taxpayer funded power plants amid energy battle

ACCC energy underwriting guarantee proposes government-backed certainty for new generation, cutting electricity prices and supporting gas, pumped hydro, renewables, batteries, and potentially coal-fired power, addressing market failure without direct subsidies.


Key Points

A tech-neutral, government-backed plan underwriting new generation revenue to increase certainty and cut power prices.

✅ Government guarantee provides a revenue floor for new generators.

✅ Technology neutral: coal, gas, renewables, pumped hydro, batteries.

✅ Intended to reduce bills by up to $400 and address market failure.


Australian Taxpayers won't directly fund any new power plants despite some Coalition MPs seizing on a new report to call for a coal-fired power station.

The Australian Competition and Consumer Commission recommended the government give financial certainty to new power plants, guaranteeing energy will be bought at a cheap price if it can't be sold, as part of an electricity market plan to avoid threats to supply.

It's part of a bid to cut up to $400 a year from average household power prices.

Prime Minister Malcolm Turnbull said the finance proposal had merit, but he ruled out directly funding specific types of power generation.

"We are not in the business of subsidising one technology or another," he told reporters in Queensland today.

"We've done enough of that. Frankly, there's been too much of that."

Renewable subsidies, designed in the 1990s to make solar and wind technology more affordable, have worked and will end in 2020.

Some Coalition MPs claim the ACCC's recommendation to underwrite power generation is vindication for their push to build new coal-fired power plants.

But ACCC chair Rod Sims said no companies had proposed building new coal plants - instead they're trying to build new gas projects, pumped hydro or renewable projects.

Opposition Leader Bill Shorten said Mr Turnbull was offering solutions years away, having overseen a rise in power prices over the past year.

"You don't just go down to K-Mart and get a coal-fired power station off the shelf," Mr Shorten told reporters, admitting he had not read the ACCC report.

Energy Minister Josh Frydenberg said the recommendation to underwrite new power generators had a lot of merit, as it would address a market failure highlighted by AEMO warnings about reduced reserves.

"What they're saying is the government needs to step in here to provide some sort of assurance," Mr Frydenberg told 9NEWS today.

He said that could include coal, gas, renewable energy or battery storage.

Deputy Nationals leader Bridget McKenzie said science should determine which technology would get the best outcomes for power bills, with a scrapping coal report suggesting it can be costly.

Mr Turnbull said there was strong support for the vast majority of the ACCC's 56 recommendations, but the government would carefully consider the report, which sets out a blueprint to cut electricity bills by 25 percent.

Acting Greens leader Adam Bandt said Australia should exit coal-fired power in favour of renewable energy to cut pollution.

In contrast, Canada has seen the Stop the Shock campaign advocate a return to coal power in some provinces.

The Australian Energy Council, which represents 21 major energy companies, said the government should consult on changes to avoid "unintended consequences".


Related News

View more

Hurricane Michael by the numbers: 32 dead, 1.6 million homes, businesses without power

Hurricane Michael Statistics track catastrophic wind speed, storm surge, rainfall totals, power outages, evacuations, and fatalities across Florida and the Southeast, detailing Category 4 intensity, Saffir-Simpson scale impacts, and emergency response resources.


Key Points

Hurricane Michael statistics detail wind speed, storm surge, rainfall, outages, and deaths from Category 4 landfall.

✅ 155 mph landfall winds; 14 ft storm surge; 12 in rainfall max

✅ 1.6M without power; 30,000 restoring crews; 6 states emergency

✅ 325k ordered evacuations; 32 deaths; FEMA and Guard deployed


Hurricane Michael, a historic Category 4 storm, struck the Florida Panhandle early Wednesday afternoon, unleashing heavy rain, high winds and a devastating storm surge.


Here is a look at the dangerous storm by the numbers:

155 mph: Wind speed -- nearly the highest possible for a Category 4 hurricane -- with which Michael made landfall near Mexico Beach and Panama City. A hurricane with 157 mph or higher is a Category 5, the strongest on the Saffir-Simpson hurricane wind scale.

129 mph: Peak wind gust reported Wednesday at Tyndall Air Force Base, which is about 12 miles southeast of Panama City, Florida.

32: Number of storm-related deaths attributed to Michael thus far, including an 11-year-old girl who local officials say was killed when part of a metal carport crashed into her family's mobile home in Lake Seminole, Georgia, and a 38-year-old man who was killed when a tree fell onto his moving car in Statesville, North Carolina.


Waves take over a house as Hurricane Michael comes ashore in Alligator Point, Fla., Oct. 10, 2018.

14 feet: Maximum height forecast for the storm surge when Michael's strong winds pushed the ocean water onto land. A storm surge just over 9 feet was reported Wednesday in Apalachicola, Florida.

12 inches: Isolated maximum amount of rain that Michael was expected to dump across the Florida Panhandle and the state's Big Bend region, as well as in southeast Alabama and parts of southwest and central Georgia.

9 inches: Maximum amount of rain that Michael could bring to isolated areas from Virginia to North Carolina.

1.6 million: Number of homes and businesses without power in Florida, Alabama, Georgia, South Carolina, North Carolina and Virginia as of Friday morning, a reminder that extended outages can persist after major disasters.

30,000: Number of workers mobilized from across the country to help restore power, underscoring the risks of field repairs such as line crew injuries during recovery.

6: Number of states that had emergency declarations in anticipation of Michael: Florida, Alabama, Georgia, South Carolina, North Carolina and Virginia.

325,000: Estimated number of people in the storm's path who were told to evacuate by local authorities.

6,000: Approximate number of people who stayed in the roughly 80 shelters across Florida, Alabama, Georgia, South Carolina and North Carolina on Wednesday night, while those sheltering at home were urged to avoid overheated power strips that can spark fires.

3,000: Number of personnel the Federal Emergency Management Agency deployed ahead of landfall, while utilities prepared on-site staffing plans to maintain operations during widespread disruptions.

35: Number of counties in Florida, of the state's 67, where Gov. Rick Scott declared a state of emergency prior to landfall, and grid reliability warnings often underscore systemic risks during national emergencies.

3,500: Number of Florida National Guard troops activated for pre-landfall coordination and planning, with an emphasis on high water and search-and-rescue operations.

600: Number of Florida state troopers assigned to the Panhandle and Big Bend region to assist with response and recovery efforts, including public reminders about downed line safety in affected communities.

500: Number of disaster relief workers that the American Red Cross was sending to affected areas in the Sunshine State.

200: Approximate number of patients being evacuated from at least two hospitals in Florida due to damage from the hurricane, highlighting how critical facilities depend on staff who have raised workforce safety concerns during other crises. Bay Medical Center Sacred Heart in Panama City said in a statement Thursday that its facility was damaged during the storm and thus is transferring more than 200 patients, including 39 who are critically ill, to regional hospitals. Gulf Coast Regional Medical Center, also in Panama City, announced in a statement Thursday that it's evacuating its roughly approximately patients, starting with the most critically ill, "because of the infrastructure challenges in our community."


Related News

View more

Duke solar solicitation nearly 6x over-subscribed

Duke Energy Carolinas Solar RFP draws 3.9 GW of utility-scale bids, oversubscribed in DEP and DEC, below avoided cost rates, minimal battery storage, strict PPA terms, and interconnection challenges across North and South Carolina.


Key Points

Utility-scale solar procurement in DEC and DEP, evaluated against avoided cost, with few storage bids and PPA terms.

✅ 3.9 GW bids for 680 MW; DEP most oversubscribed

✅ Most projects 7-80 MWac; few include battery storage

✅ Bids must price below 20-year avoided cost estimate


Last week the independent administrator for Duke’s 680 MW solar solicitation revealed data about the projects which have bid in response to the offer, showing a massive amount of interest in the opportunity.

Overall, 18 individuals submitted bids for projects in Duke Energy Carolinas (DEC) territory and 10 in Duke Energy Progress (DEP), with a total of more than 3.9 GW of proposals – more nearly 6x the available volume. DEP was relatively more over-subscribed, with 1.2 GWac of projects vying for only 80 MW of available capacity.

This is despite a requirement that such projects come in below the estimate of Duke’s avoided cost for the next 20 years, and amid changes in solar compensation that could affect project economics. Individual projects varied in capacity from 7-80 MWac, with most coming within the upper portion of that range.

These bids will be evaluated in the spring of 2019, and as Duke Energy Renewables continues to expand its portfolio, Duke Energy Communications Manager Randy Wheeless says he expects the plants to come online in a year or two.


Lack of storage

Despite recent trends in affordable batteries, of the 78 bids that came in only four included integrated battery storage. Tyler Norris, Cypress Creek Renewables’ market lead for North Carolina, says that this reflects that the methodology used is not properly valuing storage.

“The lack of storage in these bids is a missed opportunity for the state, and it reflects a poorly designed avoided cost rate structure that improperly values storage resources, commercially unreasonable PPA provisions, and unfavorable interconnection treatment toward independent storage,” Norris told pv magazine.

“We’re hopeful that these issues will be addressed in the second RFP tranche and in the current regulatory proceedings on avoided cost and state interconnection standards and grid upgrades across the region.”


Limited volume for North Carolina?

Another curious feature of the bids is that nearly the same volume of solar has been proposed for South Carolina as North Carolina – despite this solicitation being in response to a North Carolina law and ongoing legal disputes such as a church solar case that challenged the state’s monopoly model.


Related News

View more

Solar Becomes #3 Renewable Electricity Source In USA

U.S. Solar Generation 2017 surpassed biomass, delivering 77 million MWh versus 64 million MWh, trailing only hydro and wind; driven by PV expansion, capacity additions, and utility-scale and small-scale growth, per EIA.


Key Points

It was the year U.S. solar electricity exceeded biomass, hitting 77 million MWh and trailing only hydro and wind.

✅ Solar: 77 million MWh; Biomass: 64 million MWh (2017, EIA)

✅ PV expansion; late-year capacity additions dampen annual generation

✅ Hydro: 300 and wind: 254 million MWh; solar thermal ~3 million MWh


Electricity generation from solar resources in the United States reached 77 million megawatthours (MWh) in 2017, surpassing for the first time annual generation from biomass resources, which generated 64 million MWh in 2017. Among renewable sources, only hydro and wind generated more electricity in 2017, at 300 million MWh and 254 million MWh, respectively. Biomass generating capacity has remained relatively unchanged in recent years, while solar generating capacity has consistently grown.

Annual growth in solar generation often lags annual capacity additions because generating capacity tends to be added late in the year. For example, in 2016, 29% of total utility-scale solar generating capacity additions occurred in December, leaving few days for an installed project to contribute to total annual generation despite being counted in annual generating capacity additions. In 2017, December solar additions accounted for 21% of the annual total. Overall, solar technologies operate at lower annual capacity factors and experience more seasonal variation than biomass technologies.

Biomass electricity generation comes from multiple fuel sources, such as wood solids (68% of total biomass electricity generation in 2017), landfill gas (17%), municipal solid waste (11%), and other biogenic and nonbiogenic materials (4%).These shares of biomass generation have remained relatively constant in recent years, even as renewables' rise in 2020 across the grid.

Solar can be divided into three types: solar thermal, which converts sunlight to steam to produce power; large-scale solar photovoltaic (PV), which uses PV cells to directly produce electricity from sunlight; and small-scale solar, which are PV installations of 1 megawatt or smaller. Generation from solar thermal sources has remained relatively flat in recent years, at about 3 million MWh, even as renewables surpassed coal in 2022 nationwide. The most recent addition of solar thermal capacity was the Crescent Dunes Solar Energy plant installed in Nevada in 2015, and currently no solar thermal generators are under construction in the United States.

Solar photovoltaic systems, however, have consistently grown in recent years, as indicated by 2022 U.S. solar growth metrics across the sector. In 2014, large-scale solar PV systems generated 15 million MWh, and small-scale PV systems generated 11 million MWh. By 2017, annual electricity from those sources had increased to 50 million MWh and 24 million MWh, respectively, with projections that solar could reach 20% by 2050 in the U.S. mix. By the end of 2018, EIA expects an additional 5,067 MW of large-scale PV to come online, according to EIA’s Preliminary Monthly Electric Generator Inventory, with solar and storage momentum expected to accelerate. Information about planned small-scale PV systems (one megawatt and below) is not collected in that survey.


Related News

View more

Sign Up for Electricity Forum’s Newsletter

Stay informed with our FREE Newsletter — get the latest news, breakthrough technologies, and expert insights, delivered straight to your inbox.

Electricity Today T&D Magazine Subscribe for FREE

Stay informed with the latest T&D policies and technologies.
  • Timely insights from industry experts
  • Practical solutions T&D engineers
  • Free access to every issue

Download the 2025 Electrical Training Catalog

Explore 50+ live, expert-led electrical training courses –

  • Interactive
  • Flexible
  • CEU-cerified