
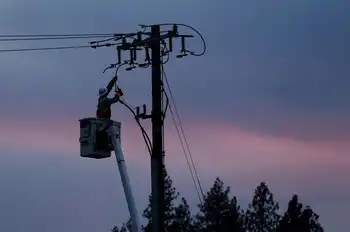
High Voltage Maintenance Training Online
Our customized live online or in‑person group training can be delivered to your staff at your location.

- Live Online
- 12 hours Instructor-led
- Group Training Available
Regular Price:
$599
Coupon Price:
$499
BEIJING
—
Lawa Hydropower Station approved on the Jinsha River, a Yangtze tributary, delivers 2,000 MW via four units; 784 ft dam, 12 sq mi reservoir, Sichuan-Tibet site, US$4.59b investment, Huadian stake, renewable energy generation.
The Important Points
A 2,000 MW dam project on the Jinsha River with four units, a 784 ft barrier, and 8.36 billion kWh annual output.
2,000 MW capacity via four turbine-generator units
784 ft dam; reservoir submerges ~12 sq mi
Generates ~8.36 billion kWh per year
Sichuan-Tibet junction on the Jinsha River
US$4.59b total; Huadian Group holds 48%
China has approved construction of the 2,000-MW Lawa hydropower station, a Yangtze tributary hydropower project on the Jinsha River, multiple news agencies are reporting.
Lawa, at the junction of Sichuan province and the Tibet autonomous region, will feature a 784-foot-high dam and the reservoir will submerge about 12 square miles of land. The Jinsha River is a tributary of the Yangtze River, and the project aligns with green hydrogen development in China.
The National Development and Reform Commission of the People’s Republic of China, which also guides China's nuclear energy development as part of national planning, is reported to have said that four turbine-generator units will be installed, and the project is expected to produce about 8.36 billion kWh of electricity annually.
Total investment in the project is to be US$4.59 billion, and Huadian Group Co. Ltd. will have a 48% stake in the project, reflecting overseas power infrastructure activity, with minority stakes held by provincial firms, according to China Daily.
In other recent news in China, Andritz received an order in December 2018 to supply four 350-MW reversible pump-turbines and motor-generators, alongside progress in compressed air generation technologies, for the 1,400-MW ZhenAn pumped storage plant in Shaanxi province.
Related News
SC nuclear plant on the mend after a leak shut down production for weeks
V.C. Summer nuclear plant leak update: Dominion Energy repaired a valve in the reactor cooling…
View more

Told "no" 37 times, this Indigenous-owned company brought electricity to James Bay anyway
Five Nations Energy Transmission Line connects remote First Nations to the Ontario power grid, delivering…
View more
PG&E restoring power after intentional shut-offs affect 20,500 customers
PG&E power restoration continues across Butte and Yuba counties after PSPS shut-offs from high winds…
View more

Gulf Power to Provide One-Time Bill Decrease of 40%
Gulf Power 40% One-Time Bill Decrease approved by the Florida Public Service Commission delivers a…
View more

Hydro One Q2 profit plunges 23% as electricity revenue falls, costs rise
Hydro One Q2 Earnings show lower net income and EPS as mild weather curbed electricity…
View more
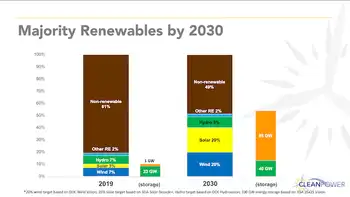
U.S. Renewable and Clean Energy Industries Set Sights on Market Majority
U.S. Majority Renewables by 2030 targets over half of electricity from wind, solar, hydropower, and…
View more
Sign Up for Electricity Forum’s Newsletter
Stay informed with our FREE Newsletter — get the latest news, breakthrough technologies, and expert insights, delivered straight to your inbox.
Electricity Today T&D Magazine Subscribe for FREE

Stay informed with the latest T&D policies and technologies.
- Timely insights from industry experts
- Practical solutions T&D engineers
- Free access to every issue
