Quebec Churchill Falls power deal renewal spotlights Hydro-Qu�e9bec's Labrador hydroelectricity, Churchill River contract extension, Gull Island prospects, and Innu Nation rights, as demand from EV battery manufacturing and the green economy outpaces provincial supply.
Key Points
Extending Quebec's low-price Churchill Falls contract to secure Labrador hydro and address Innu Nation rights.
✅ 1969 contract delivers ~30 TWh at very low fixed price.
✅ Newfoundland seeks higher rates, equity, and consultation.
✅ Innu Nation demands benefits, consent, and land remediation.
As Quebec prepares to ramp up electricity production to meet its ambitious economic goals, the government is trying to extend a power deal that has caused decades of resentment in Newfoundland and Labrador.
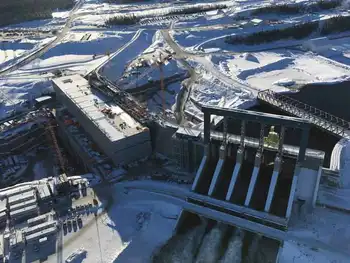
Around 15 per cent of Quebec's electricity comes from the Churchill Falls dam in Labrador, through a deal set to expire in 2041 that is widely seen as unfair. Quebec Premier François Legault not only wants to extend the agreement, he wants another dam on the Churchill River and, for now, has closed the door on nuclear power as an option to help make his province what he has called a "world leader for the green economy."
But renewing that contract "won't be easy," Normand Mousseau, scientific director of the Trottier Energy Institute at Polytechnique Montréal, said in a recent interview. Extending the Churchill Falls deal is not essential to meet Quebec's energy plans, but without it, Mousseau said, "we would have some problems."
The Legault government is enticing global companies, such as manufacturers of electric vehicle batteries, to set up shop in the province and access its hydroelectricity. But demand for Quebec's power has exceeded its supply, and Ontario has chosen not to renew a power-purchase deal with Quebec, limiting the government's vision.
Last month, Quebec's hydro utility released its strategic plan calling for a production increase of 60 terawatt hours by 2035, which represents the installed capacity of three of Hydro-Québec's largest facilities. Churchill Falls produces roughly 30 terawatt hours, and Quebec would need to replace that power if it can't strike a deal to extend the contract, Mousseau said.
If Quebec wants to keep buying power from Churchill Falls, the government is going to have to pay more, said Mousseau, who is also a physics professor at Université de Montréal. "We're paying one-fifth of a cent a kilowatt hour — that's not much," he said.
Under the 1969 contract, Quebec assumed most of the financial risk of building the Churchill Falls dam in exchange for the right to buy power at a fixed price. The deal has generated more than $28 billion for Hydro-Québec; it has returned $2 billion to Newfoundland and Labrador.
That lopsided deal has stoked anti-Quebec sentiment in Newfoundland and Labrador and contributed to nationalist politics, including threats of separation from Canada around a decade and a half ago, when Danny Williams was premier, said Jerry Bannister, a history professor at Dalhousie University.
"We tend to forget what it was like during the Williams era — he hauled down the Canadian flag," Bannister said. "There was a type of angry, combative nationalism which defined energy development. And particularly Muskrat Falls, it was payback, it was revenge."
Power from the Muskrat Falls generating station, also on the Churchill River, would be sold to Nova Scotia instead of Quebec. But that project has suffered technical problems and cost overruns since, and as of June 29, the price of Muskrat Falls had reached $13.5 billion; the province had estimated the total cost would be $7.4 billion when it sanctioned the project in 2012.
Anti-Quebec feelings may have subsided, but Bannister said the Churchill Falls deal continues to influence Newfoundland politics.
In September, Premier Andrew Furey said Legault would have to show him the money(opens in a new tab) to extend th Legault's office said Tuesday that discussions are ongoing, while the Newfoundland and Labrador government said in an emailed statement Thursday that it wants to maximize the value of its "assets and future opportunities" along the Churchill River.
Whatever negotiations are happening, Grand Chief Simon Pokue of the Innu Nation of Labrador(opens in a new tab) said he has been left out of them.
Churchill Falls flooded 6,500 square kilometres of traditional Innu land, Pokue said, adding that in response, the Innu Nation filed a $4 billion lawsuit against Hydro-Québec in 2020, which is ongoing.
"A lot of damage has been done to our lands, our land is flooded and we'll never see it again," Pokue said in a recent interview. "Nobody will ever repair that."
As well, a portion of Muskrat Falls profits was supposed to go to the Innu Nation, but the cost overruns and a refinancing deal between the federal government and Newfoundland and Labrador have limited whatever money they will see.
If Legault wants another dam on the Churchill River, at Gull Island, the Innu Nation needs to be paid the kind of money it was expecting from Muskrat Falls, he said.
"You did it once, but you're not going to do it again," Pokue said. "It's not going to start until we are consulted and involved."
Meanwhile, Quebec may face competition for Churchill Falls power, Mousseau said, with at least one Labrador mining company expressing interest in buying a significant portion of its output — though he added that the dam's capacity could be increased. The low price paid by Quebec has meant there has been little incentive to upgrade the plant's turbines.
As demand for electricity rises across the country, Mousseau said he thinks it would be better for provinces to work together, sharing expertise and costs, for example through NB Power deals to import more Quebec electricity as they look across provincial borders to find the best locations for projects, rather than acting as rivals.
"We need to talk and work with other provinces, and some propose an independent planning body to guide this, but for this you need to build confidence, and there's no confidence from the Newfoundland side with respect to Quebec," he said. "So that's a challenge: how do you work on this relationship that has been broken for 50 years?"e contract, but the two premiers have said little since.
Related News