Falling demand raises doubts about power plants

By Brockton Enterprise


CSA Z463 Electrical Maintenance

Our customized live online or in‑person group training can be delivered to your staff at your location.

  • Live Online
  • 6 hours Instructor-led
  • Group Training Available
Regular Price:
$249
Coupon Price:
$199
Reserve Your Seat Today
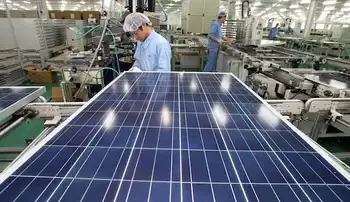
Two Massachusetts power plant projects are on hold due to falling demand for electricity, raising questions about whether a proposed Brockton plant will be next.

The developer behind the two delayed projects, in Billerica and Uxbridge, says he believes other power plant projects around the state are facing the same roadblocks.

“I think it’s across the board,” said Joseph Fitzpatrick, president and chief executive of DG Clean Power.

The company recently won a permit from the state for the Billerica plant, but plans to delay construction for one or two years, Fitzpatrick said. The company also wonÂ’t begin seeking approvals for the Uxbridge project until at least a year from now.

The reason: demand for power is dropping due to the recession and conservation efforts, he said. New power plants canÂ’t get financing under such circumstances, Fitzpatrick said.

“Clearly, it’s going to impact the in-service date of some of these plants,” he said.

Power consumption fell by 1.9 percent last year in New England, said Marcia Blomberg, a spokeswoman for electricity overseer ISO New England.

The organizationÂ’s forecasts are also dropping. Power consumption will be 4 percent lower this year and 5 percent lower next year than had been previously forecast in a 2008 report, Blomberg said.

Most current power plant projects — including the 350-megawatt Brockton plant, first proposed in 2007 — were drawn up at a time when electricity forecasts were going up, not down.

Still, the company behind the Brockton plant contends the project will move forward on schedule. The plant is slated to open in 2011.

“The project is on firm footing,” said Wesley Eberle, a spokesman for Advanced Power.

Eberle said the company believes power demand will eventually rise, and the company is taking a long-term view.

He also said the project will not have trouble finding financing due to project partners such as Siemens Financial Services.

The project is awaiting a final approval from the state Energy Facilities Siting Board to move forward.

The board, which granted its approval to the Billerica plant, has not yet scheduled a vote on the Brockton project.

The project also needs numerous local approvals, including at least one zoning variance, for which the company has not yet applied, said Drew Hoyt, a Plymouth lawyer who has represented the city of Brockton in the legal case of the project.

The plant would burn natural gas and diesel fuel and be built off Oak Hill Way on the cityÂ’s south side.

The project has faced opposition from Brockton officials and residents amid concerns over possible health impacts and the location of the plant near homes, schools and large numbers of low-income and minority residents.

Related News

Switch from fossil fuels to electricity could cost $1.4 trillion, Canadian Gas Association warns

Canada Electrification Costs: report estimates $580B-$1.4T to scale renewable energy, wind, solar, and storage capacity to 2050, shifting from natural gas toward net-zero emissions and raising average household energy spending by $1,300-$3,200 annually.


Key Points

Projected national expense to expand renewables and electrify energy systems by 2050, impacting household energy bills.

✅ $580B-$1.4T forecast for 2020-2050 energy transition

✅ 278-422 GW wind, solar, storage capacity by 2050

✅ Household costs up $1,300-$3,200 per year on average


The Canadian Gas Association says building renewable electricity capacity to replace just half of Canada's current fossil fuel-generated energy, a shift with significant policy implications for grids across provinces, could increase national costs by as much as $1.4 trillion over the next 30 years.

In a report, it contends, echoing an IEA report on net-zero, that growing electricity's contribution to Canada's energy mix from its current 19 per cent to about 60 per cent, a step critical to meeting climate pledges that policymakers emphasize, will require an expansion from 141 gigawatts today to between 278 and 422 GW of renewable wind, solar and storage capacity by 2050.

It says that will increase national energy costs by between $580 billion and $1.4 trillion between 2020 and 2050, a projection consistent with recent reports of higher electricity prices in Alberta amid policy shifts, translating into an average increase in Canadian household spending of $1,300 to $3,200 per year.

The study, prepared by consulting firm ICF for the association, assumes electrification begins in 2020 and is applied in all feasible applications by 2050, with investments in the electricity system, guided by the implications of decarbonizing the grid for reliability and cost, proceeding as existing natural gas and electric end use equipment reaches normal end of life.

Association CEO Tim Egan says the numbers are "pretty daunting" and support the integration of natural gas with electric, amid Canada's race to net-zero commitments, instead of using an electric-only option as the most cost-efficient way for Canada to reach environmental policy goals.

But Keith Stewart, senior energy strategist with Greenpeace Canada, says scientists are calling for the world to get to net-zero emissions by 2050, and Canada's net-zero by 2050 target underscores that urgency to avoid "catastrophic" levels of warming, so investing in natural gas infrastructure to then shut it down seems a "very expensive option."


Related News

View more

Energy authority clears TEPCO to restart Niigata nuclear plant

TEPCO Kashiwazaki-Kariwa restart plan clears NRA fitness review, anchored by a seven-point safety code, Niigata consent, Fukushima lessons, seismic risk analysis, and upgrades to No. 6 and No. 7 reactors, each rated 1.35 GW.


Key Points

TEPCO's plan to restart Kashiwazaki-Kariwa under NRA rules, pending Niigata consent and upgrades to Units 6 and 7.

✅ NRA deems TEPCO fit; legally binding seven-point safety code

✅ Local consent required: Niigata review of evacuation and health impacts

✅ Initial focus on Units 6 and 7; 1.35 GW each, seismic upgrades


Tokyo Electric Power Co. cleared a major regulatory hurdle toward restarting a nuclear power plant in Niigata Prefecture, but the utility’s bid to resume its operations still hangs in the balance of a series of political approvals.

The government’s nuclear watchdog concluded Sept. 23 that the utility is fit to operate the plant, based on new legally binding safety rules TEPCO drafted and pledged to follow, even as nuclear projects worldwide mark milestones across different regulatory environments today. If TEPCO is found to be in breach of those regulations, it could be ordered to halt the plant’s operations.

The Nuclear Regulation Authority’s green light now shifts the focus over to whether local governments will agree in the coming months to restart the Kashiwazaki-Kariwa plant.

TEPCO is keen to get the plant back up and running. It has been financially reeling from the closure of its nuclear plants in Fukushima Prefecture following the triple meltdown at the Fukushima No. 1 nuclear plant in 2011 triggered by the earthquake and tsunami disaster.

In parallel, Japan is investing in clean energy innovations such as a large hydrogen system being developed by Toshiba, Tohoku Electric Power and Iwatani.

The company plans to bring the No. 6 and No. 7 reactors back online at the Kashiwazaki-Kariwa nuclear complex, which is among the world’s largest nuclear plants, amid China’s nuclear energy continuing on a steady development track in the region.

The two reactors each boast 1.35 gigawatts in output capacity, while Kenya’s nuclear plant aims to power industry as part of that country’s expansion. They are the newest of the seven reactors there, first put into service between 1996 and 1997.

TEPCO has not revealed specific plans yet on what to do with the older five reactors.

In 2017, the NRA cleared the No. 6 and No. 7 reactors under the tougher new reactor regulations established in 2013 in response to the Fukushima nuclear disaster, while jurisdictions such as Ontario support continued operation at Pickering under strict oversight.

It also closely scrutinized the operator’s ability to run the Niigata Prefecture plant safely, given its history as the entity responsible for the nation’s most serious nuclear accident.

After several rounds of meetings with top TEPCO managers, the NRA managed to hold the utility’s feet to the fire enough to make it pledge, in writing, to abide by a new seven-point safety code for the Kashiwazaki-Kariwa plant.

The creation of the new code, which is legally binding, is meant to hold the company accountable for safety measures at the facility.

“As the top executive, the president of TEPCO will take responsibility for the safety of nuclear power,” one of the points reads. “TEPCO will not put the facility’s economic performance above its safety,” reads another.

The company promised to abide by the points set out in writing during the NRA’s examination of its safety regulations.

TEPCO also vowed to set up a system where the president is directly briefed on risks to the nuclear complex, including the likelihood of earthquakes more powerful than what the plant is designed to withstand. It must also draft safeguard measures to deal with those kinds of earthquakes and confirm whether precautionary steps are in place.

The utility additionally pledged to promptly release public records on the decision-making process concerning crucial matters related to nuclear safety, and to preserve the documents until the facility is decommissioned.

TEPCO plans to complete its work to reinforce the safety of the No. 7 reactor in December. It has not set a definite deadline for similar work for the No. 6 reactor.

To restart the Kashiwazki-Kariwa plant, TEPCO needs to obtain consent from local governments, including the Niigata prefectural government.

The prefectural government is studying the plant’s safety through a panel of experts, which is reviewing whether evacuation plans are adequate as off-limits areas reopen and the health impact on residents from the Fukushima nuclear disaster.

Niigata Governor Hideyo Hanazumi said he will not decide on the restart until the panel completes its review.

The nuclear complex suffered damage, including from fire at an electric transformer, when an earthquake it deemed able to withstand hit in 2007.


Related News

View more

U.S. Residents Averaged Fewer Power Outages in 2022

2022 U.S. Power Outage Statistics show lower SAIDI as fewer major events hit, with SAIFI trends, electric reliability, outage duration and frequency shaped by hurricanes, winter storms, vegetation, and utility practices across states.


Key Points

They report SAIDI and SAIFI for 2022, showing outage duration, frequency, and impacts of major weather events.

✅ 2022 SAIDI averaged 5.6 hours; SAIFI averaged 1.4 interruptions.

✅ Fewer major events lowered outage duration versus 2021.

✅ Hurricanes and winter storms drove long outages in several states.


In 2022, U.S. electricity consumers on average experienced about 5.5 hours of power disruptions, a decrease from nearly two hours compared to 2021. This information comes from the latest Annual Electric Power Industry Report. The reduction in yearly power interruptions primarily resulted from fewer significant events in 2022 compared to the previous year, and utility disaster planning continues to support grid resilience as severe weather persists.

Since 2013, excluding major events, the annual average duration of power interruptions has consistently hovered around two hours. Factors contributing to major power disruptions include weather-related incidents, vegetation interference near power lines, and specific utility practices, while pandemic-related grid operations influenced workforce planning more than outage frequency. To assess the reliability of U.S. electric utilities, two key indexes are utilized:

  • The System Average Interruption Duration Index (SAIDI) calculates the total length (in hours) an average customer endures non-brief power interruptions over a year.
  • The System Average Interruption Frequency Index (SAIFI) tracks the number of times interruptions occur.

The influence of major events on electrical reliability is gauged by comparing affected states' SAIDI and SAIFI values against the U.S. average, which was 5.6 hours of outages and 1.4 outages per customer in 2022. The year witnessed 18 weather-related disasters in the U.S., each resulting in over $1 billion in damages, and COVID-19 grid assessments indicated the electricity system was largely safe from pandemic impacts. Noteworthy major events include:

  • Hurricane Ian in September 2022, leaving over 2.6 million Floridian customers without electricity, with restoration in some areas taking weeks rather than days.
  • Hurricane Nicole in November 2022, causing over 300,000 Florida customers to lose power.
  • Winter Storm Elliott in December 2022, affecting over 1.5 million customers in multiple states including Texas where utilities struggled after Hurricane Harvey to restore service, and Florida, and bringing up to four feet of snow in parts of New York.

In 2022, states like Florida, West Virginia, Maine, Vermont, and New Hampshire experienced the most prolonged power interruptions, with New Hampshire averaging 10.3 hours and Florida 19.1 hours, and FPL's Irma storm response illustrates how restoration can take days or weeks in severe cases. Conversely, the District of Columbia, Delaware, Rhode Island, Nebraska, and Iowa had the shortest total interruptions, with the District of Columbia averaging just 34 minutes and Iowa 85 minutes.

The frequency of outages, unlike their duration, is more often linked to non-major events. Across the nation, Alaska recorded the highest number of power disruptions per customer (averaging 3.5), followed by several heavily forested states like Tennessee and Maine. Power outages due to falling tree branches are common, particularly during winter storms that burden tree limbs and power lines, as seen in a North Seattle outage affecting 13,000 customers. The District of Columbia stood out with the shortest and fewest outages per customer.


Related News

View more

Ontario's electricity 'recovery rate' could lead to higher hydro bills

Ontario Hydro Flat Rate sets a single electricity rate at 12.8 cents per kWh, replacing time-of-use pricing for Ontario ratepayers, affecting hydro bills this summer, alongside COVID-19 Energy Assistance Program support.


Key Points

A fixed 12.8 cents per kWh electricity price replacing time-of-use rates across Ontario from June to November.

✅ Single rate applies 24/7, replacing time-of-use pricing

✅ May slightly raise bills versus pre-pandemic usage patterns

✅ COVID-19 aid offers one-time credits for households, small firms


A new provincial COVID-19 measure, including a fixed COVID-19 hydro rate designed to give Ontario ratepayers "stability" on their hydro bills this summer, could result in slightly higher hydro costs over the next four months.

Ontario Premier Doug Ford's government announced over the weekend that consumers would be charged a single around-the-clock electricity rate between June and November, before a Nov. 1 rate increase takes effect, replacing the much-derided time-of-use model ratepayers have complained about for years.

Instead of being charged between 10 to 20 cents per kilowatt hour, depending on the time of day electricity is used, including ultra-low TOU rates during off-peak hours, hydro users will be charged a blanket rate of 12.8 cents per kWh.

"The new rate will simply show up on your bill," Premier Doug Ford said at a Monday afternoon news conference.

While the government said the new fixed rate would give customers "greater flexibility" to use their home appliances without having to wait for the cheapest rate -- and has tabled legislation to lower rates as part of its broader plan -- the new policy also effectively erases a pandemic-related hydro discount for millions of consumers.

For example, a pre-pandemic bill of $59.90 with time-of-use rates, will now cost $60.28 with the government's new recovery rate, as fixed pricing ends across the province, before delivery charges, rebates and taxes.

That same bill would have been much cheaper -- $47.57 -- if the government continued applying the lowest tier of time-of-use 24/7 under an off-peak price freeze as it had been doing since March 24.

The government also introduced support for electric bills with two new assistance programs to help customers struggling to pay their bills.

The COVID-19 Energy Assistance Program will provide a one-time payment consumers to help pay off electricity debt incurred during the pandemic -- which will cost the government $9 million.

The government will spend another $8 million to provide similar assistance to small businesses hit hard by the pandemic.


Related News

View more

Here are 3 ways to find out where your electricity comes from

US energy mix shows how the electric grid blends renewables, fossil fuels, nuclear, and hydro, varying by ISO/RTO markets, utilities, and state policies, affecting carbon emissions, pricing, reliability, and access.


Key Points

The US energy mix is the grid's source breakdown by region: fossil fuels, renewables, nuclear, and hydro.

✅ Check ISO or RTO dashboards for real-time generation by fuel source.

✅ Utilities may offer green power plans or RECs at modest premiums.

✅ Energy mix shifts with policy, pricing, and grid reliability needs.


There are few resources more important than energy. Sure, you may die if you don't eat for days. But your phone will die if you go too long without charging it. Energy feeds tech, the internet, city infrastructure, refrigerators, lights, and has evolved throughout U.S. history in profound ways. You get the idea. Yet unlike our other common needs, such as food, energy sources aren't exactly front of mind for most people. 

"I think a lot of people don't put a lot of bandwidth into thinking about this part of their lives," said Richard McMahon, the SVP of energy supply and finance at Edison Electric Institute, a trade group that represents investor-owned electric companies in the US. 

It makes sense. For most Americans, electricity is always there, and in many locations, there's not much of a choice involved, even as electricity demand is flat across the U.S. today. You sign up with a utility when you move into a new residence and pay your bills when they're due. 

But there's an important reality that indifference eschews: In 2018, a third of the energy-related carbon-dioxide emissions in the US came from the electric power sector, according to the US Energy Information Administration (EIA). 

A good chunk of that is from the residential sector, which consistently uses more energy than commercial customers, per EIA data.

Just as many people exercise choice when they eat, you typically also have a choice when it comes to your energy supply. That's not to say your current offering isn't what you want, or that switching will be easy or affordable, but "if you're a customer and want power with a certain attribute," McMahon said, "you can pretty much get it wherever you are." 

But first, you need to know the energy mix you have right now. As it turns out, it's not so straightforward. At all.

This brief guide may help. 

For some utility providers, you can find out if it publishes the energy mix online. Dominion Energy, which serves Idaho, North Carolina, Ohio, South Carolina, Utah, Virginia, West Virginia, and Wyoming, provides this information in a colored graphic. 

"Once you figure out who your utility is you can figure out what mix of resources they use," said Heidi Ratz, an electricity markets researcher at the World Resources Institute.

But not all utilities publish this information.

It has to do with their role in the grid and reflects utility industry trends in structure and markets. Some utility companies are vertically integrated; they generate power through nuclear plants or wind farms and distribute those electrons directly to their customers. Other utilities just distribute the power that different companies produce. 

Consider Consolidated Edison, or Con Ed, which distributes energy to parts of New York City. While reporting this story, Business Insider could not find information about the utility's energy mix online. When reached for comment, a spokesperson said, "we're indifferent to where it comes from."

That's because, in New York, distribution utilities like Con Ed often buy energy through a wholesale marketplace.

Take a look at this map. If you live in one of the colored regions, your electricity is sold on a wholesale market regulated by an organization called a regional transmission organization (RTO) or independent system operator (ISO). Distribution utilities like Con Ed often buy their energy through these markets, based on availability and cost, while raising questions about future utility revenue models as prices shift. 

Still, it's pretty easy to figure out where your energy comes from. Just look up the ISO or RTO website (such as NYISO or CAISO). Usually, these organizations will provide energy supply information in near-real time. 

That's exactly what Con Edison (which buys energy on the NYISO marketplace) suggested. As of Friday morning, roughly 40% of the energy on the market place was natural gas or other fossil fuels, 34% was nuclear, and about 22% was hydro. 

If you live in another region governed by an ISO or RTO, such as in most of California, you can do the same thing. Like NYISO, CAISO has a dashboard that shows (again, as of Friday morning) about 36% of the energy on the market comes from natural gas and more than 20% comes from renewables. 

In the map linked above, you'll notice that some of the ISOs and RTOs like MISO encompass enormous regions. That means that even if you figure out where the energy in your market comes from, it's not going to be geographically specific. But there are a couple of ways to drill down even further. 

The Environmental Protection Agency has a straightforward tool called Power Profiler. You can enter your zip code to see the fuel mix in your area. But it's not perfect. The data are from 2016 and, in some regions of the country like the upper Midwest, they aren't much more localized, and some import dirty electricity due to regional trading. 

The World Resources Institute also has a tool that allows you to see the electricity mix by state, based on 2017 data from EIA. These numbers represent power generation, not the electricity actually flowing into your sockets, but they offer a rough idea of what energy resources are operating in your state. 

One option is to check with your utility to see if it has a "green power" offering. Over 600 utilities across the country have one, according to the Climate Reality Project, though they often come at a slightly higher cost. It's typically on the scale of just a few more cents per kilowatt-hour. 

There are also independent, consumer-facing companies like Arcadia and Green Mountain Energy that allow you to source renewable energy, by virtually connecting you to community solar projects or purchasing Renewable Energy Certificates, or RECs, on your behalf, as America goes electric and more options emerge. 

"RECs measure an investment in a clean energy resource," Ratz said, in an email. "The goal of putting that resource on the grid is to push out the need for dirtier resources."

The good news: Even if you do nothing, your energy mix will get cleaner. Coal production has fallen to lows not seen since the 1980s, amid disruptions in coal and nuclear sectors that affect reliability and costs, while renewable electricity generation has doubled since 2008. So whether you like it or not, you'll be roped into the clean energy boom one way or another. 


Related News

View more

Biden calls for 100 percent clean electricity by 2035. Here’s how far we have to go.

Biden Clean Energy Plan 2035 accelerates carbon-free electricity with renewables, nuclear, hydropower, and biomass, invests $2T in EVs, grid and energy efficiency, and tightens fuel economy standards beyond the Clean Power Plan.


Key Points

A $2T U.S. climate plan for carbon-free power by 2035, boosting renewables, nuclear, EVs, efficiency, and grid upgrades.

✅ Targets a zero-carbon electric grid nationwide by 2035

✅ Includes renewables, nuclear, hydropower, and biomass in standard

✅ Funds EVs, grid modernization, weatherization, and fuel economy rules


This month the Democratic presumptive presidential nominee, Joe Biden, outlined an ambitious plan, including Biden’s solar plan to expand clean energy, for tackling climate change that shows how far the party has shifted on the issue since it controlled the White House.

President Barack Obama’s Clean Power Plan had called for the electricity sector to cut its carbon pollution 32 percent by 2030, and did not lay out a trajectory for phasing out oil, coal or natural gas production.

This year, Democratic 2020 hopefuls such as Sen. Bernie Sanders (I-Vt.) went much further, suggesting the United States should derive all of its electricity from renewable sources by 2030, moving to 100% renewables as part of a $16.3 trillion plan to wean the nation away from fossil fuels. Many other congressional Democrats have embraced the Green New Deal — the nonbinding resolution calling for a carbon-free power sector by 2030 and more energy efficient buildings and vehicles, along with a massive investment in electric vehicles and high-speed rail.

Last year, 38 percent of U.S. electricity generated came from clean sources, according to a Washington Post analysis of data from the U.S. Energy Information Administration, and in April renewables hit a record 28% nationwide.

Biden’s new plan, which carries a price tag of $2 trillion, would eliminate carbon emissions from the electric sector by 2035, impose stricter gas mileage standards, fund investments to weatherize millions of homes and commercial buildings, and upgrade the nation’s transportation system. To reach its 2035 carbon-free electricity goal, the campaign includes wind, solar and several forms of energy, acknowledging why the grid isn’t yet 100% renewable while balancing reliability, that are not always counted in state renewable portfolio standards, such as nuclear, hydropower and biomass.

“A great appeal of the Biden proposal is that it is much closer to targeting carbon directly, which is the ultimate enemy, and plays fewer favorites with particular technologies,” said Michael Greenstone, who directs the University of Chicago’s Energy Policy Institute. “This will reduce the costs to consumers and give more carbon bang for the buck.”

But some environmentalists, such as Friends of the Earth President Erich Pica, question the idea of including more controversial carbon-free technologies. “There is no role for nuclear in a least-cost, low carbon world. Including these dinosaurs in a clean energy standard is going to incentivize industry efforts to keep aging, dangerous facilities online,” Pica said in an email.

Hydropower, which relies on a system of moving water that constantly recharges, is defined as renewable by the Environmental Protection Agency. Biomass is often considered as carbon neutral because even though it releases carbon dioxide when it is burned, the plants capture nearly the same amount of CO2 while growing.


Both forms of energy have come under fire for their environmental impacts, however. Damming streams and rivers can destroy fish habitat and make it more difficult for them to spawn, and it also seems unlikely that hydropower will expand its current 6 percent share of the nation’s electrical grid.

Many experts argue that classifying biomass energy as carbon neutral provides an incentive to cut down trees that would otherwise remain standing and sequester carbon. “If burning this wood were good for the climate, then we should not recycle paper, we should burn it,” noted Tim Searchinger, a research scholar at the Princeton School of Public and International Affairs.

Illinois lead the nation in the amount of electricity generated from nuclear power

More than half of the country — 30 states, Washington, and three territories — have adopted a renewable portfolio standard (RPS), according to the National Conference of State Legislatures, and seven states and one territory have set renewable energy goals. While 14 states, along with the District, Puerto Rico and the Virgin Islands, have established requirements of 50 percent or more carbon-free electricity, nearly as many have set theirs at 15 percent or less.

Maine Gov. Janet Mills (D), who has called for 100% renewable electricity in the state, has pushed clean electricity aggressively since taking office in 2019, lifting a wind energy moratorium imposed by her predecessor and signing bills aimed at expanding the state’s carbon-free energy sources. Biomass accounts for a quarter of the state’s electricity, more than any other state.

New York has one of the country’s most ambitious climate targets, which it scaled up last year. It aims to obtain 70 percent of its power from renewable sources within a decade, a period when renewables surpassed coal in U.S. generation, and eliminate carbon altogether by 2040, even as the state is in the process of shutting down a major nuclear plant near New York City, Indian Point, which is slated to cease operating on April 30, 2021.

... while other states are weakening theirs

Last year, Ohio weakened its renewable energy standard from a target of 12.5 percent in 2027 to 8.5 percent by 2026, even as renewables topped coal nationwide for the first time in over a century, without setting any future goals, and jettisoned its energy efficiency standard. West Virginia — which established modest renewable requirements in 2009 — repealed them altogether in 2015, the year they were set to take effect.


Related News

View more

Sign Up for Electricity Forum’s Newsletter

Stay informed with our FREE Newsletter — get the latest news, breakthrough technologies, and expert insights, delivered straight to your inbox.

Electricity Today T&D Magazine Subscribe for FREE

Stay informed with the latest T&D policies and technologies.
  • Timely insights from industry experts
  • Practical solutions T&D engineers
  • Free access to every issue

Live Online & In-person Group Training

Advantages To Instructor-Led Training – Instructor-Led Course, Customized Training, Multiple Locations, Economical, CEU Credits, Course Discounts.

Request For Quotation

Whether you would prefer Live Online or In-Person instruction, our electrical training courses can be tailored to meet your company's specific requirements and delivered to your employees in one location or at various locations.