GE to host EV experience tour

By Fleet Owner


CSA Z463 Electrical Maintenance

Our customized live online or in‑person group training can be delivered to your staff at your location.

  • Live Online
  • 6 hours Instructor-led
  • Group Training Available
Regular Price:
$249
Coupon Price:
$199
Reserve Your Seat Today
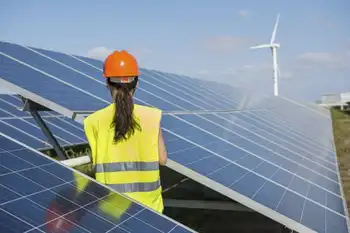
GE has announced it will host an electric vehicle EV tour in seven U.S. cities that will "bring GE experts together with local businesses, industry leaders, and public sector stakeholders for educational workshops, test drives, and dialogue on the business case for EV ecosystems."

GE said it is working with GM, Ford, Toyota, Navistar, Smith Electric Vehicles, Mitsubishi, Coda, Smart, THINK and other organizations on the tour.

The company said it has already committed to purchase 25,000 EVs by 2015 for its own fleet and for fleet customers. GE noted it owns one of the world's largest vehicle fleets, operates a leading global fleet management business, and offers a "portfolio of product solutions including charging stations, circuit protection equipment and transformers that touch every part of electric vehicle infrastructure development."

GE said it is hosting the EV tour help other businesses and key stakeholders understand technical and business approaches for deploying pure electric and plug-in hybrid electric vehicles.

Each day-long stop in cities along the tour will include presentations by GE and community leaders, workshops to help stakeholders with EV planning, deployment, and integration strategies, and test drives.

Scheduled Tour dates are:

• San Francisco, March 10

• Seattle, March 15

• Los Angeles, March 17

• San Diego, March 22

Additional EV Experience Tour dates will be announced in Austin, New York City, and Washington, D.C. for Spring 2011.

"GE is playing a leadership role in the transformation to smarter transportation solutions and a smarter electrical grid," said Luis Ramirez, CEO, GE Energy Industrial Solutions. "Our EV Experience Tour is an important way for us to engage communities across the United States in the discussion about the economic and environmental advantages of EV deployment."

"We're committed to helping our customers learn what electric vehicles can do for their organizations," added Clarence Nunn, president & CEO of GE Capital Fleet Services. "Each of our tour stops will give participants first-hand exposure to the technical and business considerations for EV deployment and put them on a path toward adoption."

In support of the tour, GE is making an electric vehicle readiness toolkit is available on its ecomagination.com website to help municipalities, customers, and individuals prepare for wide-scale electric vehicle deployment.

Related News

Balancing Act: Germany's Power Sector Navigates Energy Transition

Germany January Power Mix shows gas-fired generation rising, coal steady, and nuclear phaseout impacts, amid cold weather, energy prices, industrial demand, and emissions targets shaping renewables, grid stability, and security of supply.


Key Points

The January electricity mix, highlighting gas, coal, renewables, and nuclear exit effects on emissions, prices, and demand.

✅ Gas output up 13% to 8.74 TWh, share at 18.6%.

✅ Coal share 23%, down year on year, steady vs late 2023.

✅ Nuclear gap filled by gas and coal; emissions below Jan 2023.


Germany's electricity generation in January presented a fascinating snapshot of its energy transition journey. As the country strives to move away from fossil fuels, with renewables overtaking coal and nuclear in its power mix, it grapples with the realities of replacing nuclear power and meeting fluctuating energy demands.

Gas Takes the Lead:

Gas-fired power plants saw their highest output in two years, generating 8.74 terawatt hours (TWh). This 13% increase compared to January 2023 compensated for the closure of nuclear reactors, which were extended during the energy crisis to shore up supply, and colder weather driving up heating needs. This reliance on gas, however, pushed its share in the electricity mix to 18.6%, highlighting Germany's continued dependence on fossil fuels.

Coal Fades, but Not Forgotten:

While gas surged, coal-fired generation remained below previous levels, dropping 29% from January 2023. However, it stayed relatively flat compared to late 2023, suggesting utilities haven't entirely eliminated it. Coal still held a 23% share, and periodic coal reliance remains evident, exceeding gas' contribution, reflecting its role as a reliable backup for intermittent renewable sources like wind.

Nuclear Void and its Fallout:

The shutdown of nuclear plants in April 2023 created a significant gap, previously accounting for an average of 12% of annual electricity output. This loss is being compensated through gas and coal, with gas currently the preferred choice, even as a nuclear option debate persists among policymakers. This strategy kept January's power sector emissions lower than the previous year, but rising demand could shift the balance.

Industry's Uncertain Impact:

Germany's industrial sector, a major energy consumer, is facing challenges like high energy prices and weak consumer demand. While the government aims to foster industrial recovery, uncertainties linger due to a shaky coalition and limited budget, and debate about a possible nuclear resurgence continues in parallel, which could reshape policy. Any future industrial revival would likely increase energy demand and potentially necessitate more gas or coal.

Cost-Driven Choices and Emission Concerns:

The choice between gas and coal depends on their relative costs, in a system pursuing a coal and nuclear phase-out under long-term policy. Currently, gas seems more favorable emission-wise, but if its price rises, coal might become more attractive, impacting overall emissions.

Looking Ahead:

Germany's energy transition faces a complex balancing act, with persistent grid expansion woes and exposure to cheap gas complicating progress. While the reliance on gas and coal highlights the difficulties in replacing nuclear, the focus on emissions reduction is encouraging. Navigating the challenges of affordability, industrial needs, and climate goals will be crucial for a successful transition to a clean and secure energy future.


Related News

View more

BC Hydro cryptic about crypto mining electricity use

BC Hydro Crypto Mining Moratorium pauses high-load connection requests, as BCUC reviews electricity demand, gigawatt-hours and megawatt load forecasts, data center growth, and potential rate impacts on the power grid and industrial customers.


Key Points

A BC order pausing crypto mining connections while BC Hydro and BCUC assess load, grid impacts, and ratepayer risks.

✅ 18-month pause on new high-load crypto connections

✅ 1,403 MW in requests suspended; 273 MW existing or pending

✅ Seeks to manage demand, rates, and grid reliability


In its Nov. 1, 2022 load update briefing note to senior executives of the Crown corporation, BC Hydro shows that the entire large industrial sector accounted for 6,591 gigawatt-hours during the period – one percent less than forecast in the service plan.

BC Hydro censored load statistics about crypto mining, coal mining and chemicals from the briefing note, which was obtained under the freedom of information law and came amid scrutiny over B.C. electricity imports because it feared that disclosure would harm Crown corporation finances and third-party business interests.

Crypto mining requires high-powered computers to run and be cooled around the clock constantly. So much so that cabinet ordered the BC Utilities Commission (BCUC) last December to place an 18-month moratorium on crypto mining connection requests, while other jurisdictions, such as the N.B. Power crypto review, undertook similar pauses to assess impacts.


In a news release, the government said 21 projects seeking 1,403 megawatts were temporarily suspended. The government said that would be enough to power 570,000 homes or 2.1 million electric vehicles for a year.

A report issued by BC Hydro before Christmas said there were already 166 megawatts of power from operational projects at seven sites. Another six projects with 107 megawatts were nearing connection, bringing its total load to 273 megawatts.

Richard McCandless, a retired assistant deputy minister who analyzes the performance of BC Hydro and the Insurance Corp of British Columbia, said China's May 2021 ban on crypto mining had a major ripple effect on those seeking cheap and reliable power.

"When China cracked down, these guys fled to different areas," McCandless said in an interview. "So they took their computers and went somewhere else. Some wound up in B.C."

He said BC Hydro's secrecy about crypto loads appears rooted in the Crown corporation underestimating load demand, even as new generating stations were commissioned to bolster capacity.

"Crypto is up so dramatically; they didn't want to show that," McCandless said. "Maybe they didn't want to be seen as being asleep at the switch."

Indeed, BCUC's April 21 decision on BC Hydro's 2021 revenue forecasts through the 2025 fiscal year included BC Hydro's forecast increase for crypto and data centres of about 100 gigawatt-hours through fiscal 2024 before returning to 2021 levels by 2025. In addition, the BCUC document said that BC Hydro's December 2020 load forecast was lower than the previous one because of project cancellations and updated load requests, amid ongoing nuclear power debate in B.C.

"Given the segment's continued uncertainty and volatility, the forecast assumes these facilities are not long-lived," the BC Hydro application said.

A September 2022 report to the White House titled "Crypto-Assets in the United States" said increased electricity demand from crypto-asset mining could lead to rate increases.

"Crypto-asset mining in upstate New York increased annual household electric bills by [US]$82 and annual small business electric bills by [US]$164, with total net losses from local consumers and businesses estimated to be [US]$179 million from 2016-2018," the report said. The information mentioned Plattsburgh, New York's 18-month moratorium in 2018. Manitoba announced a similar suspension almost a month before B.C.

B.C.'s total core domestic load of 23,666 gigawatt-hours was two percent higher than the service plan amid BC Hydro call for power planning, with commercial and light industrial (9,198 gigawatt-hours) and residential (7,877 gigawatt-hours) being the top two customer segments.

"A cooler spring and warmer summer supported increased loads, as the Western Canada drought strained hydropower production regionally. However, warmer daytime temperatures in September impacted heating more than cooling," said the briefing note.

"Commercial and light industrial consumption benefited from warmer temperatures in August but has also been impacted to a lesser degree by the reduced heating load in the first three weeks of October."

Loads improved relative to 2021, but offices, retail businesses and restaurants remained below pre-pandemic levels. Education, recreation and hotel sectors were in line with pre-pandemic levels. Light industrial sector growth offset the declines.

For heavy industry, pulp and paper electricity use was 15 percent ahead of forecast, but wood manufacturing was 16 percent below forecast. The briefing note said oil and gas grew nine percent relative to the previous year but, alongside ongoing LNG power demand, fell nine percent below the service plan.


Related News

View more

Four Facts about Covid and U.S. Electricity Consumption

COVID-19 Impact on U.S. Electricity Consumption shows commercial and industrial demand dropped as residential use rose, with flattened peak loads, weekday-weekend convergence, Texas hourly data, and energy demand as a real-time economic indicator.


Key Points

It reduced commercial and industrial demand while raising residential use, shifting peaks and weekday patterns.

✅ Commercial electricity down 12%; industrial down 14% in Q2 2020

✅ Residential use up 10% amid work-from-home and lockdowns

✅ Peaks flattened; weekday-weekend loads converged in Texas


This is an important turning point for the United States. We have a long road ahead. But one of the reasons I’m optimistic about Biden-Harris is that we will once again have an administration that believes in science.

To embrace this return to science, I want to write today about a fascinating new working paper by Tufts economist Steve Cicala.

Professor Cicala has been studying the effect of Covid on electricity consumption since back in March, when the Wall Street Journal picked up his work documenting an 18% decrease in electricity consumption in Italy.

The new work, focused on the United States, is particularly compelling because it uses data that allows him to distinguish between residential, commercial, and industrial sectors, against a backdrop of declining U.S. electricity sales over recent years.

Without further ado, here are four facts he uncovers about Covid and U.S. electricity demand during COVID-19 and consumption.


Fact #1: Firms Are Using Less
U.S. commercial electricity consumption fell 12% during the second quarter of 2020. U.S. industrial electricity consumption fell 14% over the same period.

This makes sense. The second quarter was by some measures, the worst quarter for the U.S. economy in over 145 years!

Economic activity shrank. Schools closed. Offices closed. Factories closed. Restaurants closed. Malls closed. Even health care offices closed as patients delayed going to the dentist and other routine care. All this means less heating and cooling, less lighting, less refrigeration, less power for computers and other office equipment, less everything.

The decrease in the industrial sector is a little more surprising. My impression had been that the industrial sector had not fallen as far as commercial, but amid broader disruptions in coal and nuclear power that strained parts of the energy economy, the patterns for both sectors are quite similar with the decline peaking in May and then partially rebounding by July. The paper also shows that areas with higher unemployment rates experienced larger declines in both sectors.


Fact #2: Households Are Using More
While firms are using less, households are using more. U.S. residential electricity consumption increased 10% during the second quarter of 2020. Consumption surged during March, April, and May, a reflection of the lockdown lifestyle many adopted, and then leveled off in June and July – with much less of the rebound observed on the commercial/industrial side.

This pattern makes sense, too. In Professor Cicala’s words, “people are spending an inordinate amount of time at home”. Many of us switched over to working from home almost immediately, and haven’t looked back. This means more air conditioning, more running the dishwasher, more CNN (especially last week), more Zoom, and so on.

The paper also examines the correlates of the decline. Areas in the U.S. where more people can work from home experienced larger increases. Unemployment rates, however, are almost completely uncorrelated with the increase.


Fact #3: Firms are Less Peaky
The paper next turns to a novel dataset from Texas, where Texas grid reliability is under active discussion, that makes it possible to measure hourly electricity consumption by sector.

As the figure above illustrates, the biggest declines in commercial/industrial electricity consumption have occurred Monday through Friday between 9AM and 5PM.

The dashed line shows the pattern during 2019. Notice the large spikes in electricity consumption during business hours. The solid line shows the pattern during 2020. Much smaller spikes during business hours.


Fact #4: Everyday is Like Sunday
Finally, we have what I would like to nominate as the “Energy Figure of the Year”.

Again, start with the pattern for 2019, reflected by the dashed line. Prior to Covid, Texas households used a lot more electricity on Saturdays and Sundays.

Then along comes Covid, and turned every day into the weekend. Residential electricity consumption in Texas during business hours Monday-Friday is up 16%(!).

In the pattern for 2020, it isn’t easy to distinguish weekends from weekdays. If you feel like weekdays and weekends are becoming a big blur – you are not alone.


Conclusion
Researchers are increasingly thinking about electricity consumption as a real-time indicator of economic activity, even as flat electricity demand complicates utility planning and investment. This is an intriguing idea, but Professor Cicala’s new paper shows that it is important to look sector-by-sector.

While commercial and industrial consumption indeed seem to measure the strength of an economy, residential consumption has been sharply countercylical – increasing exactly when people are not at work and not at school.

These large changes in behavior are specific to the pandemic. Still, with the increased blurring of home and non-home activities we may look back on 2020 as a key turning point in how we think about these three sectors of the economy.

More broadly, Professor Cicala’s paper highlights the value of social science research. We need facts, data, and yes, science, if we are to understand the economy and craft effective policies on energy insecurity and shut-offs as well.


Related News

View more

Joni Ernst calls Trump's wind turbine cancer claim 'ridiculous'

Wind Turbine Cancer Claim debunked: Iowa Republican senators back wind energy as fact-checks and DOE research find no link between turbine noise and cancer, limited effects on property values, and manageable wildlife impacts.


Key Points

Claims that turbine noise causes cancer, dismissed by studies and officials as unsupported by evidence.

✅ Grassley and Ernst call the claim idiotic and ridiculous

✅ DOE studies find no cancer link; property impacts limited

✅ Wildlife impacts mitigated; climate change poses larger risks


President Donald Trump may not be a fan of wind turbines, as shown by his pledge to scrap offshore wind projects earlier, suggesting that the noise they produce may cause cancer, but Iowa's Republican senators are big fans of wind energy.

Sen. Chuck Grassley called Trump's cancer claim "idiotic." On Thursday, Sen. Joni Ernst called the statement "ridiculous."

"I would say it's ridiculous. It's ridiculous," Ernst said, according to WHO-TV.

She likened the claim that wind turbine noise causes cancer to the idea that church bells do the same.

"I have church bells that ring all the time across from my office here in D.C. and I know that noise doesn't give me cancer, otherwise I'd have 'church bell cancer,'" Ernst said, adding that she is "thrilled" to have wind energy generation in Iowa, which aligns with a quarter-million wind jobs forecast nationwide. "I don't know what the president is drawing from."

Trump has a history of degrading wind energy and wind turbines that dates back long before his Tuesday claim that turbines harm property values and cause cancer, and often overlooks Texas grid constraints that can force turbines offline at times.

Not only are wind farms disgusting looking, but even worse they are bad for people's health.

"Not only are wind farms disgusting looking, but even worse, they are bad for people's health," Trump tweeted back in 2012.

Repeated fact-checks have found no scientific evidence to support the claim that wind turbines and the noise they make can cause cancer. The White House has reportedly provided no evidence to support Trump's cancer claim when asked this week

"It just seems like every time you turn around there's another thing the president is saying -- wind power causes cancer, I associate myself with the remarks of Chairman Grassley -- it's an 'idiotic' statement," Pelosi said in her weekly news conference on Thursday.

The president made his latest claim about wind turbines in a speech on Tuesday at a Republican spring dinner, as the industry continued recovering from the COVID-19 crisis that hit solar and wind energy.

"If you have a windmill anywhere near your house, congratulations, your house just went down 75 percent in value -- and they say the noise causes cancer," Trump said Tuesday, swinging his arm in a circle and making a cranking sound to imitate the noise of windmill blades. "And of course it's like a graveyard for birds. If you love birds, you never want to walk under a windmill. It’s a sad, sad sight."

Wind turbines are not, in fact, proven to have widespread negative impacts on property values, according to the Department of Energy's Office of Scientific and Technical Information in the largest study done so far in the U.S., even as some warn that a solar ITC extension could be devastating for the wind market, and there is no peer-reviewed data to back up the claim that the noise causes cancer.

I am considered a world-class expert in tourism. When you say, 'Where is the expert and where is the evidence?' I say: I am the evidence.

It's true wildlife is affected by wind turbines -- particularly birds and bats, with research showing whooping cranes avoid turbines when selecting stopover sites. One study estimated between 140,000 and 328,000 birds are killed annually by collisions with turbines across the U.S. The U.S. Energy Information Administration estimated, however, that other human-related impacts also contribute to declines in population.

The wind industry works with biologists to find solutions to the impact of turbines on wildlife, and the Department of Energy awards grants each year to researchers addressing the issue, even as the sector faced pandemic investment risks in 2020. But, overall, scientists warn that climate change itself is a bigger threat to bird populations than wind turbines, according to the National Audobon Society.

Speaker Nancy Pelosi: "It just seems like every time you turn around, there's another thing. The president is saying wind power causes cancer. I associate myself with the remarks of Chairman Grassley; It's an 'idiotic' statement"


Related News

View more

UK families living close to nuclear power stations could get free electricity

UK Nuclear Free Electricity Incentive proposes community benefits near reactors, echoing France, supporting net zero goals, energy security, and streamlined planning, while addressing regulation and judicial review challenges for Sizewell C and future nuclear projects.


Key Points

A proposed policy to give free power to residents near reactors, supporting net zero and energy security.

✅ Free power for communities near nuclear plants

✅ Aligns with net zero and energy security goals

✅ Seeks streamlined planning and fewer approvals


UK Business Secretary Jacob Rees-Mogg has endorsed a French-style nuclear system that sees people living near nuclear power stations receive free electricity.

Speaking at an event organised by Policy Exchange think tank, Jacob Rees-Mogg said: “Nuclear power is just fundamental. There’s no way we can get to net zero emissions, or even have an intelligent electricity strategy and grid reform in the UK, without nuclear.”

Highlighting that this was his view and not a government policy announcement, he said: “We should copy the French. As I understand, if you live near a nuclear power station in France, you get free electricity and that’s great because then, I’ll have two in my garden if I get free electricity for my children as well.

“I think you want to recognise that things you do that are in the national interest, such as a state-owned generation company, must benefit those who make the sacrifice for the national interest.”

Earlier Mr Rees-Mogg stressed that he would like to see a simpler development consent process for new nuclear power plants to enable the next waves of reactors in the UK, amid concerns that Europe is losing nuclear power just when it really needs energy.

He said: “That’s a lot of regulation around that, as seen when nuclear plant plans collapsed in Wales and impacted the local economy. Did you know that Sizewell C will require 140 individual approvals from arms of the state, each one of which is potentially subject to judicial review.”


Related News

View more

Hydro One delivery rates go up

Hydro One Rate Hike reflects Ontario Energy Board approval for higher delivery charges, impacting seasonal customers more than residential classes, funding infrastructure upgrades like wood pole and transformer replacements across Ontario's medium-density service areas.


Key Points

The Hydro One rate hike is an OEB-approved delivery charge increase to fund upgrades, with impacts on seasonal users.

✅ OEB-approved delivery rate increases retroactive to 2018

✅ Seasonal customers see larger monthly bill impacts than residential

✅ Funds pole, transformer replacements and tree trimming work


Hydro One seasonal customers will face bigger increases in their bills than the utility's residential customers as a result of an Ontario Energy Board approval of a rate hike, a topic drawing attention from a utilities watchdog in other provinces as well.

Hydro One received permission to increase its delivery charge, as large projects like the Meaford hydro generation proposal are considered across Ontario, retroactive to last year.

It says it needs the money to maintain and upgrade its infrastructure, including efforts to adapt to climate change, much of which was installed in the 1950s.

The utility is notifying customers that new statements reflect higher delivery rates which were not charged in 2018 and the first half of this year, due to delay in receiving the OEB's permission, similar to delays that can follow an energy board recommendation in other jurisdictions.

The amount that customers' bills will increase by depends not only on how much electricity they use, but also on which rate class they belong to, as well as policy decisions affecting remote connections such as the First Nations electricity line in northern Ontario.

For seasonal customers such as summer cottage owners, the impact on a typical user's bill will be 2.9 per cent more per month for 2018, and 1.7 per cent per month for 2019.

There will be further increases of 1.0 per cent, 1.4 per cent and 1.1 per cent per month in 2020, 2021 and 2022 respectively. 

Typical residential customers will experience smaller increases or rate freezes over the same period.

In the residential medium density class, the rate changes are a 2.0 per cent increase for last year, a decrease of 0.5 per cent this year, and an increase of 0.5 per cent in 2021. There will be no increases in 2020 and 2022.


Seasonal Rate Class — Estimated bill impact per month

2018 - 2.9 %

2019 - 1.7%

2020 - 1.0%

2021 - 1.4%

2022 - 1.1%


Residential Medium Density Rate Class — Estimated bill impact per month

2018 - 2.0%

2019 - -0.5% decrease

2020 - 0.0%

2021 - 0.5%

2022 - 0.0%

A Hydro One spokesperson told tbnewswatch.com that over the next three years, the utility's upgrading plan includes reliability investments such as replacing more than 24,000 wood poles across the province as well as numerous transformers.

In the Thunder Bay area, the spokesperson said, some of the revenue generated by the higher delivery rates will cover the cost of replacing more than 180 poles and trimming hazardous trees around 3,200 kilometres of overhead power lines while sharing electrical safety tips with customers.


Related News

View more

Sign Up for Electricity Forum’s Newsletter

Stay informed with our FREE Newsletter — get the latest news, breakthrough technologies, and expert insights, delivered straight to your inbox.

Electricity Today T&D Magazine Subscribe for FREE

Stay informed with the latest T&D policies and technologies.
  • Timely insights from industry experts
  • Practical solutions T&D engineers
  • Free access to every issue

Download the 2025 Electrical Training Catalog

Explore 50+ live, expert-led electrical training courses –

  • Interactive
  • Flexible
  • CEU-cerified