Ontario Premier Admits Rebate
OTTAWA -- - Premier Ernie Eves acknowledged that some electricity users urgently need government help to pay their soaring bills and cannot wait until spring.
His comment was the clearest signal yet that the Ontario government is scrambling to fast-track rebates or some other short-term relief to help increasingly angry consumers.
"Certainly in terms of some individuals -- some individuals on fixed incomes especially -- can't, you know, sit there and wait until next March or April or May to have some redress for money that they've paid, and I understand that," Mr. Eves said.
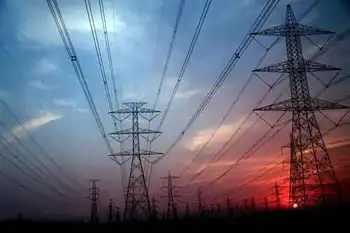
Government rebates, that could pay from $130 to $250 per household if hydro costs rise above a set level, were originally intended to go out after May 1, 2003, the one-year anniversary of competition in the hydro marketplace. But an unusually hot summer, combined with the fact that four of eight nuclear reactors at Pickering are out of commission, has sent rates through the roof. As temperatures fall and many Ontarians rely on electricity for heat, there's no relief in sight.
Mr. Eves said he still has faith that the energy marketplace will, on its own, eventually bring power bills down. But he has ordered Energy Minister John Baird to bring to cabinet short-, medium- and long-term strategies to increase Ontario's power supply and mitigate rate shocks, which he admitted are battering his government's popularity.
On Wednesday, NDP Leader Howard Hampton tabled a private member's bill, the No Freezing in the Dark Act, that would ban utilities from cutting anyone's power between Oct. 1 and May 1 for non-payment. Utilities would face fines as high as $1 million if they refused to reconnect customers in arrears. Mr. Baird told reporters he'll take a "serious" look at the bill. He recalled the 1998 ice storm that knocked out power in eastern Ontario and parts of Quebec while noting how vital electricity is to many people, particularly those who rely on it for heat.
Mr. Baird wouldn't say when he'll present cabinet with hydro options, only that it will be "sooner rather than later."
Conservative MPP Gary Carr, the Speaker of the legislature, said about 500 of his Oakville constituents have signed a petition demanding the government freeze hydro rates until it figures out how to cope with deregulation.
"They seem to be coming in pretty fast," he said of the signatures, estimating there will be 750 by the time another MPP tables the petition on his behalf next week.
While the petition is clearly an embarrassment for the government, Mr. Eves said he can't blame Mr. Carr for passing on his constituents' views.
Related News

Wind turbine firms close Spanish factories as Coronavirus restrictions tighten
MADRID - Spain Wind Turbine Factory Shutdowns disrupt manufacturing as Vestas, Siemens Gamesa, and Nordex halt Spanish plants amid COVID-19 lockdowns, straining supply chains and renewables projects across Europe, with partial operations and maintenance continuing.
Key Points
COVID-19 lockdowns pause Spanish wind factories by Vestas, Siemens Gamesa, and Nordex, disrupting supply chains.
✅ Vestas, Siemens Gamesa, Nordex halt Spanish manufacturing
✅ Service and maintenance continue under safety protocols
✅ Supply chain and project timelines face delays in Europe
Europe’s largest wind turbine makers on Wednesday said they had shut down more factories in Spain, a major hub for…