NFPA 70E Training
Our customized live online or in‑person group training can be delivered to your staff at your location.

- Live Online
- 6 hours Instructor-led
- Group Training Available
Regular Price:
$199
Coupon Price:
$149
MELBOURNE
—
Australia Renewable Energy Transition: solar capacity growth, net-zero goals, rising electricity demand, coal reliance, EV adoption, grid decarbonization, heat waves, air conditioning loads, and policy incentives shaping clean power, efficiency, and emissions reduction.
Context and Background
Australia targets net-zero by 2050 by scaling renewables, curbing demand, and phasing down coal and gas.
Solar capacity up 200% since 2018, yet coal remains dominant.
Transport leads energy use; EV uptake lags global average.
Heat waves boost AC load, stressing grids and emissions goals.
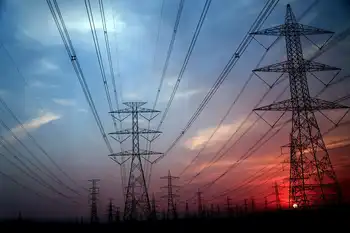
A more than 200% increase in installed solar power generation capacity since 2018 helped Australia rank sixth globally in terms of solar capacity last year and emerge as one of the world's fastest-growing major renewable energy producers, aligning with forecasts that renewables to surpass coal in global power generation by 2025.
However, to realise its goal of becoming a net-zero carbon emitter by 2050, Australia must reverse the trajectory of its energy use, which remains on a rising path, even as Asia set to use half of electricity underscores regional demand growth, in contrast with several peers that have curbed energy use in recent years.
Australia's total electricity consumption has grown nearly 8% over the past decade, amid a global power demand surge that has exceeded pre-pandemic levels, compared with contractions over the same period of more than 7% in France, Germany and Japan, and a 14% drop in the United Kingdom, data from Ember shows.
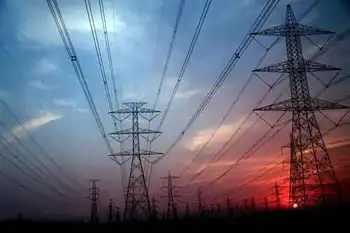
Sustained growth in Australia's electricity demand has in turn meant that power producers must continue to heavily rely on coal for electricity generation on top of recent additions in supply of renewable energy sources, with low-emissions generation growth expected to cover most new demand.
Australia has sharply boosted clean energy capacity in recent years, but remains heavily reliant on coal & natural gas for electricity generation
To accomplish emissions reduction targets on time, Australia's energy use must decline while clean energy supplies climb further, as that would give power producers the scope to shut high-polluting fossil-powered energy generation systems ahead of the 2050 deadline.
DEMAND DRIVERS
Reducing overall electricity and energy use is a major challenge in all countries, where China's electricity appetite highlights shifting consumption patterns, but will be especially tough in Australia which is a relative laggard in terms of the electrification of transport systems and is prone to sustained heat waves that trigger heavy use of air conditioners.
The transport sector uses more energy than any other part of the Australian economy, including industry, and accounted for roughly 40% of total final energy use as of 2020, according to the International Energy Agency (IEA.)
Transport energy demand has also expanded more quickly than other sectors, growing by over 5% from 2010 to 2020 compared to industry's 1.3% growth over the same period.
Transport is Australia's main energy use sector, and oil products are the main source of energy type
To reduce energy use, and cut the country's fuel import bill which topped AUD $65 billion in 2022 alone, according to the Australian Bureau of Statistics, the Australian government is keen to electrify car fleets and is offering large incentives for electric vehicle purchases.
Even so, electric vehicles accounted for only 5.1% of total Australian car sales in 2022, according to the International Energy Agency (IEA).
That compares to 13% in New Zealand, 21% in the European Union, and a global average of 14%.
More incentives for EV purchases are expected, but any rapid adoption of EVs would only serve to increase overall electricity demand, and with surging electricity demand already straining power systems worldwide, place further pressure on power producers to increase electricity supplies.
Heating and cooling for homes and businesses is another major energy demand driver in Australia, and accounts for roughly 40% of total electricity use in the country.
Australia is exposed to harsh weather conditions, especially heat waves which are expected to increase in frequency, intensity and duration over the coming decades due to climate change, according to the New South Wales government.
To cope, Australians are expected to resort to increased use of air conditioners during the hottest times of the year, and with reduced power reserves flagged by the market operator, adding yet more strain to electricity systems.
Related News
Related News
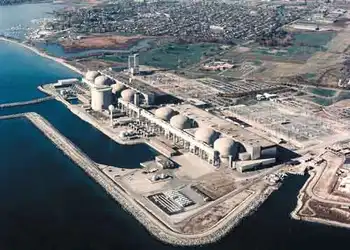
Time running out for Ontario to formally request Pickering nuclear power station extension
Pickering Nuclear Plant Extension faces CNSC approval as Ontario Power Generation pursues license renewal before…
View more

Rolls-Royce signs MoU with Exelon for compact nuclear power stations
Rolls-Royce and Exelon UKSMR Partnership accelerates factory-built small modular reactors, nuclear power, clean energy, 440MW…
View more
"Knowledge Gap" Is Contributing To On-the-job Electrical Injuries
BC Hydro Trades Electrical Safety addresses electric contact incidents among trade workers, emphasizing power line…
View more

How Canada can capitalize on U.S. auto sector's abrupt pivot to electric vehicles
Canadian EV Manufacturing is accelerating with GM, Ford, and Project Arrow, integrating cross-border supply chains,…
View more
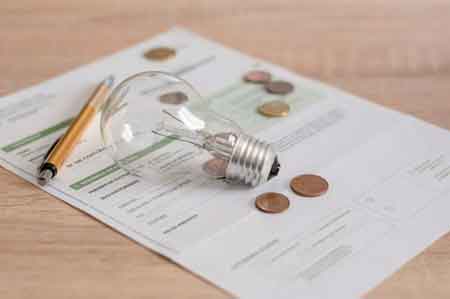
New York Faces Soaring Energy Bills
New York faces soaring energy bills as utilities seek record rate hikes, aging grid infrastructure…
View more
Hydro One employees support Province of Ontario in the fight against COVID-19
Hydro One COVID-19 Quarantine Support connects Ontario's Ministry of Health with trained customer service teams…
View more
Sign Up for Electricity Forum’s Newsletter
Stay informed with our FREE Newsletter — get the latest news, breakthrough technologies, and expert insights, delivered straight to your inbox.
Electricity Today T&D Magazine Subscribe for FREE

Stay informed with the latest T&D policies and technologies.
- Timely insights from industry experts
- Practical solutions T&D engineers
- Free access to every issue

