NS Power Employees Adopt Safety Plan
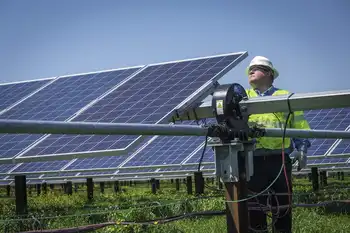
SYDNEY -- - Employees with Nova Scotia Power will soon have a strengthened risk assessment process to guide them when working around power lines. A team of Nova Scotia Power employees, with representation from across the province, has been working for several months on improving the process of recognizing and minimizing workplace hazards, known as risk assessment. The employees are introducing a new job safety plan that considers work site complexity, looks beyond immediate hazards, and provides workers with a step-by-step planning process.
"We have a good risk assessment process in place. We have good standard work procedures. We have the tools. Now, we're taking it to the next level. We want to ingrain values and beliefs among ourselves and our co-workers that will help us see the big picture and foster an even safer working environment," said Dan Muldoon, Director of Regional Operations.
The employee team was motivated directly by the death of lineman Mike Murrin, and a subsequent internal investigation. Mr. Muldoon noted that the incident caused Nova Scotia to scrutinize the risk assessment process. "It confirmed that we were on the right track with risk assessment and that what we needed to do was strengthen the process."
Mr. Muldoon noted that employees at Nova Scotia Power constantly look for ways to improve safety. "We're taking action to improve safety. That's part of our goal to reach safety excellence. Safety is a never ending journey of commitment and improvement," said Mr. Muldoon.
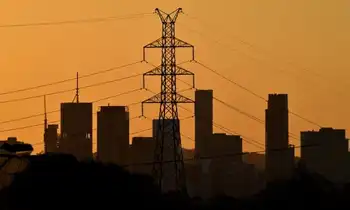
Nova Scotia Power Inc. is the largest subsidiary of Emera, a diversified regional energy company, and the principal supplier of electricity in Nova Scotia with 440,000 residential, commercial and industrial customers. The NSPI system is province-wide and provides over 95% of the generation, transmission, and distribution of electric power throughout the province.
Related News
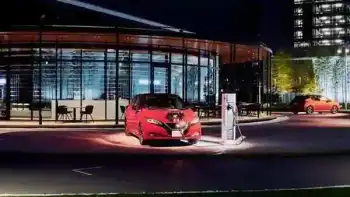
Nissan accepting electricity from EVs as payment for parking
TOKYO - Nissan V2G Parking lets EV drivers pay with electricity via bidirectional charging at the Yokohama Nissan Pavilion, showcasing vehicle-to-grid, smart energy trading, and integrated mobility experiences like Ariya rides and Formula E simulators.
Key Points
A program where EV owners use V2G to pay for parking by discharging power at Nissan's Yokohama Pavilion.
✅ Pay for parking with EV energy via V2G
✅ Powered by Nissan LEAFs and solar at the Pavilion
✅ Showcases Ariya, Formula E, ProPILOT, and I2V tech
Nissan is letting customers pay for parking with electricity by discharging power from their electric…