Jordan approves MOU to implement Jordan-Saudi Arabia electricity linkage


jordan electricity

Substation Relay Protection Training

Our customized live online or in‑person group training can be delivered to your staff at your location.

  • Live Online
  • 12 hours Instructor-led
  • Group Training Available
Regular Price:
$699
Coupon Price:
$599
Reserve Your Seat Today

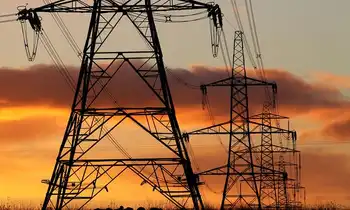
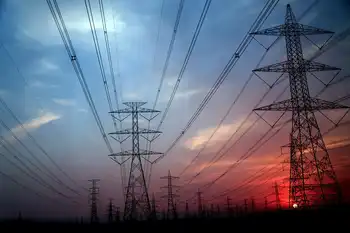
Jordan-Saudi Electricity Linkage Project connects NEPCO and Saudi National Electricity Company to launch feasibility studies, advancing cross-border grid interconnection, Arab electricity linkage goals, and enhancing power reliability, stability, and energy security in both countries.


Key Points

A bilateral grid interconnection by NEPCO and Saudi Electricity Co. to improve reliability and stability.

✅ Enables joint technical and financial feasibility studies

✅ Improves cross-border grid reliability and stability

✅ Part of Arab electricity linkage; supports energy security


The Jordanian Cabinet on has approved the memorandum of understanding to implement the electricity linkage project between Jordan and Saudi Arabia, echoing regional steps such as Lebanon's electricity sector reform to modernize power governance.

The memo will be signed between the National Electric Power Company(NEPCO) and the Saudi National Electricity Company, mirroring cross-border efforts like CEA-Mexico electricity cooperation to strengthen regional interconnections.

The agreement will enable the two sides to initiate technical and financial feasibility studies for the project, which aims to enhance the stability and reliability of electricity networks in both countries, aligning with measures to secure power such as Ireland's electricity supply plan pursued internationally.

The initial feasibility studies, which came as part of the comprehensive Arab electricity linkage issued by the Arab League in 2014, had shown the possibility of implementing the Jordanian-Saudi linkage, as electricity markets evolve in places like Alberta electricity market changes toward new designs.

Regional developments, including a Lebanon electricity goodwill gesture that sowed discord, underscore the complexities of power-sector reform.

Also on Wednesday, the Government approved the third amendment to the grant agreement provided by the EU for a programme of financial inclusion through improving the governance and the spread of micro-financing in Jordan.

Jordan and the EU signed the grant agreement on December 14, 2014 to support the general budget.

The Cabinet also approved the recommendations of the ministerial team tasked with overseeing the annual and financial plans of public credit funds in the Kingdom.

The recommendations included establishing a guidance office to introduce the governmental lending programmes and windows within Iradah centres affiliated with the Planning and International Cooperation Ministry.

The Council of Ministers decided to oblige the government institutions to execute all of their correspondences to the Jordan Customs Department (JCD) electronically.

The decision also includes cancelling the provision of 55 JCD services by conventional paper works and to be provided only online.

The council also approved the outcomes of the study to restructure the governmental body.

The outcomes proposed activating the Higher Health Council, cancelling the independence of the Vocational and Technical Employment Training Fund transferring its functions to the Employment and Development Fund, and activating the National ICT Centre.

The government has cancelled the National Fund to Support Sports and the Scientific Support Fund.


Related News

Related News

The Cool Way Scientists Turned Falling Raindrops Into Electricity

Raindrop Triboelectric Energy Harvesting converts falling water into electricity using Teflon (PTFE) on indium tin oxide and an aluminum electrode, forming a transient water bridge; a low frequency nanogenerator for renewable, static electricity harvesting.


Key Points

A method using PTFE, ITO, and an aluminum electrode to turn raindrop impacts into low frequency electrical power.

✅ PTFE on ITO boosts charge transfer efficiency.

✅ Water bridge links electrodes for rapid discharge.

✅ Low frequency output suits continuous energy harvesting.


Scientists at the City University of Hong Kong have used a Teflon-coated surface and a phenomenon called triboelectricity to generate a charge from raindrops. “Here we develop a device to harvest energy from impinging water droplets by using an architecture that comprises a polytetrafluoroethylene [Teflon] film on an indium tin oxide substrate plus an aluminium electrode,” they explain in their new paper in Nature as a step toward cheap, abundant electricity in the long term.

Triboelectricity itself is an old concept. The word means “friction electricity”—from the Greek tribo, to rub or wear down, which is why a diatribe tires you out—and dates back a long, long time. Static electricity is the most famous kind of triboelectric, and related work has shown electricity from the night sky can be harvested as well in niche setups. In most naturally occurring kinds, scientists have studied triboelectric in order to avoid its effects, like explosions inside of grain silos or hospital workers touching off pure oxygen. (Blowing sand causes an electric field, and NASA even worries about static when astronauts eventually land on Mars.)

One of the most studied forms of intentional and useful triboelectric is in systems such as ocean wave generators where the natural friction of waves meets nanogenerators of triboelectric energy. These even already use Teflon, which has natural conductivity that makes it ideal for this job. But triboelectricity is chaotic, and harnessing it generally involves a bunch of complicated, intersecting variables that can vary with the hourly weather. Promises of static electricity charging devices have often been, well, so much hot, sandy wind.

The scientists at City University of Hong Kong used triboelectric ideas to turn falling raindrops into energy. They say previous versions of the same idea were not very efficient, with materials that didn’t allow for high-fidelity transfer of electrical charge. (Many sources of renewable energy aren’t yet as efficient to turn into power, both because of developing technology and because their renewability means even less efficient use could be better than, for example, fossil fuels, and advances in renewable energy storage could help.)

“[A]chieving a high density of electrical power generation is challenging,” the team explains in its paper. “Traditional hydraulic power generation mainly uses electromagnetic generators that are heavy, bulky, and become inefficient with low water supply.” Diversifying how power is generated by water sources such as oceans and rivers is good for the existing infrastructure as well as new installations.

The research team found that as simulated raindrops fell on their device, the way the water accumulated and spread created a link between their two electrodes, one Teflon-coated and the other aluminum. This watery de facto wire link closes the loop and allows accumulated energy to move through the system. Because it’s a mechanical setup, it’s not limited to salty seawater, and because the medium is already water, its potential isn’t affected by ambient humidity either.

Raindrop energy is very low frequency, which means this tech joins many other existing pushes to harvest continuously available, low frequency natural energy, including underwater 'kites' that exploit steady currents. To make an interface that increases “instantaneous power density by several orders of magnitude over equivalent devices,” as the researchers say they’ve done here, could represent a major step toward feasibility in triboelectric generation.


Related News

View more

Wind and Solar Energy Surpass Coal in U.S. Electricity Generation

Wind and Solar Surpass Coal in U.S. power generation, as EIA data cites falling LCOE, clean energy incentives, grid upgrades, and battery storage driving renewables growth, lower emissions, jobs, and less fossil fuel reliance.


Key Points

An EIA-noted milestone where U.S. renewables outproduce coal, driven by lower LCOE, policy credits, and grid upgrades.

✅ EIA data shows wind and solar exceed coal generation

✅ Falling LCOE boosts project viability across the grid

✅ Policies and storage advances strengthen reliability


In a landmark shift for the energy sector, wind and solar power have recently surpassed coal in electricity generation in the United States. This milestone, reported by Warp News, marks a significant turning point in the country’s energy landscape and underscores the growing dominance of renewable energy sources.

A Landmark Achievement

The achievement of wind and solar energy generating more electricity than coal is a landmark moment in the U.S. energy sector. Historically, coal has been a cornerstone of electricity production, providing a substantial portion of the nation's power needs. However, recent data reveals a transformative shift, with renewables surpassing coal for the first time in 130 years, as renewable energy sources, particularly wind and solar, have begun to outpace coal in terms of electricity generation.

The U.S. Energy Information Administration (EIA) reported that in recent months, wind and solar combined produced more electricity than coal, including a record 28% share in April, reflecting a broader trend towards cleaner energy sources. This development is driven by several factors, including advancements in renewable technology, decreasing costs, and a growing commitment to reducing greenhouse gas emissions.

Technological Advancements and Cost Reductions

One of the key drivers behind this shift is the rapid advancement in wind and solar technologies, as wind power surges in the U.S. electricity mix across regions. Improvements in turbine and panel efficiency have significantly increased the amount of electricity that can be generated from these sources. Additionally, technological innovations have led to lower production costs, making wind and solar energy more competitive with traditional fossil fuels.

The cost of solar panels and wind turbines has decreased dramatically over the past decade, making renewable energy projects more economically viable. According to Warp News, the levelized cost of electricity (LCOE) from solar and wind has fallen to levels that are now comparable to or lower than coal-fired power. This trend has been pivotal in accelerating the transition to renewable energy sources.

Policy Support and Investment

Government policies and incentives have also played a crucial role in supporting the growth of wind and solar energy, with wind now the most-used renewable electricity source in the U.S. helping drive deployment. Federal and state-level initiatives, such as tax credits, subsidies, and renewable energy mandates, have encouraged investment in clean energy technologies. These policies have provided the financial and regulatory support necessary for the expansion of renewable energy infrastructure.

The Biden administration’s focus on addressing climate change and promoting clean energy has further bolstered the transition. The Infrastructure Investment and Jobs Act and the Inflation Reduction Act, among other legislative efforts, have allocated significant funding for renewable energy projects, grid modernization, and research into advanced technologies.

Environmental and Economic Implications

The surpassing of coal by wind and solar energy has significant environmental and economic implications, building on the milestone when renewables became the second-most prevalent U.S. electricity source in 2020 and set the stage for further gains. Environmentally, it represents a major step forward in reducing carbon emissions and mitigating climate change. Coal-fired power plants are among the largest sources of greenhouse gases, and transitioning to cleaner energy sources is essential for meeting climate targets and improving air quality.

Economically, the shift towards wind and solar energy is creating new opportunities and industries. The growth of the renewable energy sector is generating jobs in manufacturing, installation, and maintenance. Additionally, the decreased reliance on imported fossil fuels enhances energy security and stabilizes energy prices.

Challenges and Future Outlook

Despite the progress, there are still challenges to address. The intermittency of wind and solar power requires advancements in energy storage and grid management to ensure a reliable electricity supply. Investments in battery storage technologies and smart grid infrastructure are crucial for overcoming these challenges and integrating higher shares of renewable energy into the grid.

Looking ahead, the trend towards renewable energy is expected to continue, with renewables projected to soon provide about one-fourth of U.S. electricity as deployment accelerates, driven by ongoing technological advancements, supportive policies, and a growing commitment to sustainability. As wind and solar power become increasingly cost-competitive and efficient, their role in the U.S. energy mix will likely expand, further displacing coal and other fossil fuels.

Conclusion

The surpassing of coal by wind and solar energy in U.S. electricity generation is a significant milestone in the transition to a cleaner, more sustainable energy future. This achievement highlights the growing importance of renewable energy sources and the success of technological advancements and supportive policies in driving this transition. As the U.S. continues to invest in and develop renewable energy infrastructure, the move away from coal represents a crucial step towards achieving environmental goals and fostering economic growth in the clean energy sector.


Related News

View more

Shopping for electricity is getting cheaper in Texas

Texas Electricity Prices are shifting as deregulation matures, with competitive market shopping lowering residential rates, narrowing gaps with regulated areas, and EIA data showing long term declines versus national averages across most Texans.


Key Points

Texas Electricity Prices are average residential rates in deregulated and regulated markets across the state.

✅ Deregulated areas saw 17.4% residential price declines since 2006

✅ Regulated zones experienced a 5.5% increase over the same period

✅ Competitive shopping narrowed the gap; Texas averaged below US


Shopping for electricity is becoming cheaper for most Texans, according to a new study from the Texas Coalition for Affordable Power. But for those who live in an area with only one electricity provider, prices have increased in a recent 10-year period, the study says.

About 85 percent of Texans can purchase electricity from a number of providers in a deregulated marketplace, while the remaining 15 percent must buy power from a single provider, often an electric cooperative, in their area.

The report from the Texas Coalition for Affordable Power, which advocates for cities and local governments and negotiates their power contracts, pulls information from the U.S. Energy Information Administration to compare prices for Texans in the two models. Most Texans could begin choosing their electricity provider in 2002.

Buying power tends to be more expensive for Texans who live in a part of the state with a deregulated electricity market. But that gap is continuing to shrink as Texans become more willing to shop for power, even as electricity complaints have periodically risen. In 2015, the gap “was the smallest since the beginning of deregulation,” according to the report.

Between 2006 and 2015, the last year for which data is available, average residential electric prices for Texans in a competitive market decreased by 17.4 percent, while average prices increased by 5.5 percent in the regulated areas, even as the Texas power grid has periodically faced stress.

“These residential price declines are promising, and show the retail electric market is maturing,” Jay Doegey, executive director for the Texas Coalition for Affordable Power, said in a statement. “We’re encouraged by the price declines, but more progress is needed.”

The study attributes the decline to the prevalence of “low-priced individual deals” in the competitive areas, while policymakers consider market reforms to bolster reliability.

Overall, the average price of electricity in Texas (which produces and consumes the most electricity in the U.S.) — including the price in the deregulated marketplace, for the third time in four years — was below the national average in 2015.


Related News

View more

US January power generation jumps 9.3% on year: EIA

US January power generation climbed to 373.2 TWh, EIA data shows, with coal edging natural gas, record wind output, record nuclear generation, rising hydro, and stable utility-scale solar amid higher Henry Hub prices.


Key Points

US January power generation hit 373.2 TWh; coal led gas, wind and nuclear set records, with solar edging higher.

✅ Coal 31.8% share; gas 29.4%; coal output 118.7 TWh, gas 109.6 TWh.

✅ Wind hit record 26.8 TWh; nuclear record 74.6 TWh.

✅ Total generation 373.2 TWh, highest January since 2014.


The US generated 373.2 TWh of power in January, up 7.9% from 345.9 TWh in December and 9.3% higher than the same month in 2017, Energy Information Administration data shows.

The monthly total was the highest amount in January since 377.3 TWh was generated in January 2014.

Coal generation totaled 118.7 TWh in January, up 11.4% from 106.58 TWh in December and up 2.8% from the year-ago month, consistent with projections of a coal-fired generation increase for the first time since 2014. It was also the highest amount generated in January since 132.4 TWh in 2015.

For the second straight month, more power was generated from coal than natural gas, as 109.6 TWh came from gas, up 3.3% from 106.14 TWh in December and up 19.9% on the year.

However, the 118.7 TWh generated from coal was down 9.6% from the five-year average for the month, due to the higher usage of gas and renewables and a rising share of non-fossil generation in the overall mix.

#google#

Coal made up 31.8% of the total US power generation in January, up from 30.8% in December but down from 33.8% in January 2017.

Gas` generation share was at 29.4% in the latest month, with momentum from record gas-fired electricity earlier in the period, down from 30.7% in December but up from 26.8% in the year-ago month.

In January, the NYMEX Henry Hub gas futures price averaged $3.16/MMBtu, up 13.9% from $2.78/MMBtu averaged in December but down 4% from $3.29/MMBtu averaged in the year-ago month.


WIND, NUCLEAR GENERATION AT RECORD HIGHS

Wind generation was at a record-high 26.8 TWh in January, up 29.3% from 22.8 TWh in December and the highest amount on record, according to EIA data going back to January 2001. Wind generated 7.2% of the nation`s power in January, as an EIA summer outlook anticipates larger wind and solar contributions, up from 6.6% in December and 6.1% in the year-ago month.

Utility-scale solar generated 3.3 TWh in January, up 1.3% from 3.1 TWh in December and up 51.6% on the year. In January, utility-scale solar generation made up 0.9% of US power generation, during a period when solar and wind supplied 10% of US electricity in early 2018, flat from December but up from 0.6% in January 2017.

Nuclear generation was also at a record-high 74.6 TWh in January, up 1.3% month on month and the highest monthly total since the EIA started tracking it in January 2001, eclipsing the previous record of 74.3 TWh set in July 2008. Nuclear generation made up 20% of the US power in January, down from 21.3% in December and 21.4% in the year-ago month.

Hydro power totaled 25.4 TWh in January, making up 6.8% of US power generation during the month, up from 6.5% in December but down from 8.2% in January 2017.


Related News

View more

Can California Manage its Solar Boom?

California Duck Curve highlights midday solar oversupply and steep evening peak demand, stressing grid stability. Solutions include battery storage, demand response, diverse renewables like wind, geothermal, nuclear, and regional integration to reduce curtailment.


Key Points

A mismatch between midday solar surplus and evening demand spikes, straining the grid without storage and flexibility.

✅ Midday solar oversupply forces curtailment and wasted clean energy.

✅ Evening ramps require fast, fossil peaker plants to stabilize load.

✅ Batteries, demand response, regional trading flatten the curve.


California's remarkable success in adopting solar power, including a near-100% renewable milestone, has created a unique challenge: managing the infamous "duck curve." This distinctive curve illustrates a growing mismatch between solar electricity generation and the state's energy demands, creating potential problems for grid stability and ultimately threatening to slow California's progress in the fight against climate change.


The Shape of the Problem

The duck curve arises from a combination of high solar energy production during midday hours and surging energy demand in the late afternoon and evening when solar power declines. During peak solar hours, the grid often has an overabundance of electricity, and curtailments are increasing as a result, while as the sun sets, demand surges when people return home and businesses ramp up operations. California's energy grid operators must scramble to make up this difference, often relying on fast-acting but less environmentally friendly power sources.


The Consequences of the Duck Curve

The increasing severity of the duck curve has several potential consequences for California:

  • Grid Strain: The rapid ramp-up of power sources to meet evening demand puts significant strain on the electrical grid. This can lead to higher operational costs and potentially increase the risk of blackouts during peak demand times.
  • Curtailed Energy: To avoid overloading the grid, operators may sometimes have to curtail excess solar energy during midday, as rising curtailment reports indicate, essentially wasting clean electricity that could have been used to displace fossil fuel generation.
  • Obstacle to More Solar: The duck curve can make it harder to add new solar capacity, as seen in Alberta's solar expansion challenges, for fear of further destabilizing the grid and increasing the need for fossil fuel-based peaking plants.


Addressing the Challenge

California is actively seeking solutions to mitigate the duck curve, aligning with national decarbonization pathways that emphasize practicality. Potential strategies include:

  • Energy Storage: Deploying large-scale battery storage can help soak up excess solar electricity during the day and release it later when demand peaks, smoothing out the duck curve.
  • Demand Flexibility: Encouraging consumers to shift their energy use to off-peak hours through incentives and smart grid technologies can help reduce late-afternoon surges in demand.
  • Diverse Power Sources: While solar is crucial, a balanced mix of energy sources, including geothermal, wind, and nuclear, can improve grid stability and reduce reliance on rapid-response fossil fuel plants.
  • Regional Cooperation: Integrating California's grid with neighboring states can aid in balancing energy supply and demand across a wider geographical area.


The Ongoing Solar Debate

The duck curve has become a central point of debate about the future of California's energy landscape. While acknowledging the challenge, solar advocates argue for continued expansion, backed by measures like a bill to require solar on new buildings, emphasizing the urgent need to transition away from fossil fuels. Grid operators and some utility companies call for a more cautious approach, emphasizing grid reliability and potential costs if the problem isn't effectively managed.


Balancing California's Needs and its Green Ambitions

Finding the right path forward is essential; it will determine whether California can continue to lead the way in solar energy adoption while ensuring a reliable and affordable electricity supply. Successfully navigating the duck curve will require innovation, collaboration, and a strong commitment to building a sustainable energy system, as wildfire smoke impacts on solar continue to challenge generation predictability.


Related News

View more

Scottish Wind Delivers Equivalent Of 98% Of Country’s October Electricity Demand

Scotland Wind Energy October saw renewables supply the equivalent of 98 percent of electricity demand, as onshore wind outpaced National Grid needs, cutting emissions and powering households, per WWF Scotland and WeatherEnergy.


Key Points

A monthly update showing Scottish onshore wind met the equivalent of 98% of electricity demand in October.

✅ 98% of monthly electricity demand equivalent met by wind

✅ 16 days exceeded total national demand, per data

✅ WWF Scotland and WeatherEnergy cited; lower emissions


New figures publicized by WWF Scotland have revealed that wind energy generated the equivalent of 98% of the country’s electricity demand in October, or enough electricity to power millions of Scottish homes across the country.

Scotland has regularly been highlighted as a global wind energy leader, and over the last few years has repeatedly reported record-breaking months for wind generation. Now, it’s all very well and good to say that Scottish wind delivered 98% of the country’s electricity demand, but the specifics are a little different — hence why WWF Scotland always refers to it as wind providing “the equivalent of 98%” of Scotland’s electricity demand. That’s why it’s worth looking at the statistics provided by WWF Scotland, sourced from WeatherEnergy, part of the European EnergizAIR project:

  • National Grid demand for the month – 1,850,512 MWh
  • What % of this could have been provided by wind power across Scotland – 98%
  • Best day – 23rd October 2018, generation was 105,900.94 MWh, powering 8.72m homes, 356% of households. Demand that day was 45,274.5MWh – wind generation was 234% of that.
  • Worst day – 18th October 2018 when generation was 18,377.71MWh powering 1,512,568 homes, 62% of households. Demand that day was 73,628.5MWh – wind generation was 25%
  • How many days generation was over 100% of households – 27
  • How many days generation was over 100% of demand – 16

“What a month October proved to be, with wind powering on average 98 per cent of Scotland’s entire electricity demand for the month, at a time when wind became the UK’s main power source and exceeding our total demand for a staggering 16 out of 31 days,” said Dr Sam Gardner, acting director at WWF Scotland.

“These figures clearly show wind is working, it’s helping reduce our emissions and is the lowest cost form of new power generation. It’s also popular, with a recent survey also showing more and more people support turbines in rural areas. That’s why it’s essential that the UK Government unlocks market access for onshore wind at a time when we need to be scaling up electrification of heat and transport.”

Alex Wilcox Brooke, Weather Energy Project Manager at Severn Wye Energy Agency, added: “Octobers figures are a prime example of how reliable & consistent wind production can be, with production on 16 days outstripping national demand.”


Related News

View more

Sign Up for Electricity Forum’s Newsletter

Stay informed with our FREE Newsletter — get the latest news, breakthrough technologies, and expert insights, delivered straight to your inbox.

Electricity Today T&D Magazine Subscribe for FREE

Stay informed with the latest T&D policies and technologies.
  • Timely insights from industry experts
  • Practical solutions T&D engineers
  • Free access to every issue

Live Online & In-person Group Training

Advantages To Instructor-Led Training – Instructor-Led Course, Customized Training, Multiple Locations, Economical, CEU Credits, Course Discounts.

Request For Quotation

Whether you would prefer Live Online or In-Person instruction, our electrical training courses can be tailored to meet your company's specific requirements and delivered to your employees in one location or at various locations.