NS Power Employees Adopt Safety Plan
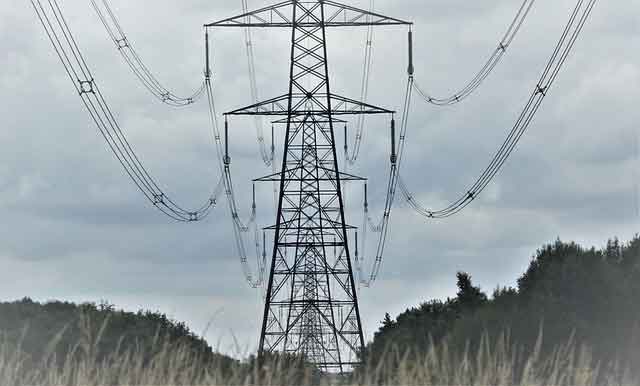
SYDNEY -- - Employees with Nova Scotia Power will soon have a strengthened risk assessment process to guide them when working around power lines. A team of Nova Scotia Power employees, with representation from across the province, has been working for several months on improving the process of recognizing and minimizing workplace hazards, known as risk assessment. The employees are introducing a new job safety plan that considers work site complexity, looks beyond immediate hazards, and provides workers with a step-by-step planning process.
"We have a good risk assessment process in place. We have good standard work procedures. We have the tools. Now, we're taking it to the next level. We want to ingrain values and beliefs among ourselves and our co-workers that will help us see the big picture and foster an even safer working environment," said Dan Muldoon, Director of Regional Operations.
The employee team was motivated directly by the death of lineman Mike Murrin, and a subsequent internal investigation. Mr. Muldoon noted that the incident caused Nova Scotia to scrutinize the risk assessment process. "It confirmed that we were on the right track with risk assessment and that what we needed to do was strengthen the process."
Mr. Muldoon noted that employees at Nova Scotia Power constantly look for ways to improve safety. "We're taking action to improve safety. That's part of our goal to reach safety excellence. Safety is a never ending journey of commitment and improvement," said Mr. Muldoon.
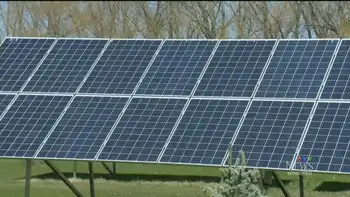
Nova Scotia Power Inc. is the largest subsidiary of Emera, a diversified regional energy company, and the principal supplier of electricity in Nova Scotia with 440,000 residential, commercial and industrial customers. The NSPI system is province-wide and provides over 95% of the generation, transmission, and distribution of electric power throughout the province.
Related News
Windstorm Causes Significant Power Outages
VANCOUVER - Vancouver October 2024 Windstorm brought extreme weather to British Columbia, causing power outages, storm damage, and downed lines as BC Hydro crews led emergency response and restoration, highlighting climate change resilience and community preparedness.
Key Points
A severe storm with 100 km/h gusts that caused outages and damage in Vancouver, prompting wide power restoration.
✅ 100 km/h gusts toppled trees and downed power lines
✅ Over 200,000 BC Hydro customers lost electricity
✅ Crews and communities coordinated emergency response
In October 2024, a powerful windstorm swept through the Vancouver area, resulting in widespread power outages and…