Solar power growth, jobs decline during pandemic


solar panels

CSA Z462 Arc Flash Training - Electrical Safety Essentials

Our customized live online or in‑person group training can be delivered to your staff at your location.

  • Live Online
  • 6 hours Instructor-led
  • Group Training Available
Regular Price:
$249
Coupon Price:
$199
Reserve Your Seat Today

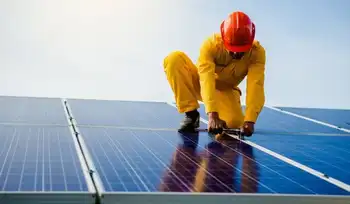
COVID-19 Solar Job Losses are erasing five years of workforce growth, SEIA reports, with U.S. installations and capacity down, layoffs accelerating, 3 GW expected in Q2, and policy support key for economic recovery.


Key Points

COVID-19 Solar Job Losses describe the pandemic-driven decline in U.S. solar employment, installations, and capacity.

✅ SEIA reports a 38% national drop in solar jobs

✅ Q2 installs projected at 3 GW, below forecasts

✅ Layoffs outpace U.S. economy without swift policy aid


Job losses associated with the COVID-19 crisis have wiped out the past five years of workforce growth in the solar energy field, according to a new industry analysis.

The expected June 2020 solar workforce of 188,000 people across the United States is 114,000 below the pre-pandemic forecast of 302,000 workers, a shortfall tied to the solar construction slowdown according to the Solar Energy Industries Association, which said in a statement Monday that the solar industry is now losing jobs at a faster rate than the U.S. economy.

In Massachusetts, the loss of 4,284 solar jobs represents a 52 percent decline from previous projections, according to the association’s analysis.

The national 38 percent drop in solar jobs coincides with a 37 percent decrease in expected solar installations in the second quarter of 2020, and similar pressures have put wind investments at risk across the sector, the association stated. The U.S. is now on track to install 3 gigawatts of new capacity this quarter, though subsequent forecasts anticipated solar and storage growth as investments returned, and the association said the decrease from the expected capacity is equivalent to the electricity needed to power 288,000 homes.

“Thousands of solar workers are being laid off each week, but with swift action from Congress, we know that solar can be a crucial part of our economic recovery,” with proposals such as the Biden solar plan offering a potential policy path, SEIA President and CEO Abigail Ross Hopper said in a statement, as recent analyses point to US solar and wind growth under supportive policies.

Subsequent data showed record U.S. panel shipments as the market rebounded.


Related News

Related News

UK Emergency energy plan not going ahead

National Grid Demand Flexibility Service helps stabilise the UK grid during tight supply, offering discounts for smart meter users who shift peak-time electricity use, reducing power cut risks amid low wind and import constraints.


Key Points

A National Grid scheme paying smart homes to cut peak-time use, easing supply pressure and avoiding power cuts.

✅ Pays volunteers with smart meters to reduce peak demand.

✅ Credits discounts for shifting use to off-peak windows.

✅ Manages tight margins and helps avert UK power cuts.


National Grid has decided not to activate a scheme on Tuesday to help the UK avoid power cuts after being poised to do so.

It would have seen some households offered discounts on their electricity bills if they cut peak-time use.

National Grid had been ready to trigger the scheme following a warning that Britain's energy supplies were looking tighter than usual this week.

However, it decided that the measure was not required.

Alerts are sent out automatically when expected supplies drop below a certain level. But they do not mean that blackouts are likely, or that the situation is critical.

National Grid said it was "confident" it would be able to manage margins and "demand is not at risk".

Discounts
Earlier on Monday, the grid operator said it was considering whether to pay households across Britain to reduce their energy use to help out on Tuesday evening.

Under the Demand Flexibility Service (DFS), announced earlier this month, customers that have signed up could get discounts on their bills if they use less electricity in a given window of time.

That could mean delaying the use of a tumble-dryer or washing machine, or cooking dinner in the microwave rather than the oven.

Major suppliers such as Octopus and British Gas are taking part, but only customers that have an electricity smart meter and that have volunteered are eligible. About 14 million UK homes have an electricity smart meter.

The DFS has already been tested twice but has not yet run live.

Octopus, the supplier with the most customers signed up, said that some households had earned more than £4 during the hour-long tests, while the average saving was "well over £1".

It came after forecasts projected a large drop in the amount of power that Britain will be able to import from French nuclear power stations on Monday and Tuesday evenings.

The lack of strong winds to power turbines has also affected how much power can be generated within the UK, and efforts to fast-track grid connections aim to ease constraints.

Such warnings are not unusual - around 12 have been issued and cancelled without issue in the last six years, and other regions such as Canada are seeing grids strained by harsh weather as well.

However, they have become more common this year due to the energy crisis, and the most recent notice was sent out last week.

The situation means that the UK will have to import electricity from other sources on Monday and Tuesday evening.

Supplies are also expected be tight in France, forecasters say.

France has been facing months of problems with its nuclear power plants, which generate around three-quarters of the country's electricity.

More than half of the nuclear reactors run by state energy company EDF have closed due to maintenance problems and technical issues.

It has added to a massive energy crisis in Europe which is facing a winter without gas supplies from Russia.


Related News

View more

Most Energy Will Come From Fossil Fuels, Even In 2040

2040 Energy Outlook projects a shifting energy mix as renewables scale, EV adoption accelerates, and IEA forecasts plateauing oil demand alongside rising natural gas, highlighting policy, efficiency, and decarbonization trends that shape global consumption.


Key Points

A data-driven view of future energy mix, covering renewables, fossil fuels, EVs, oil demand, and policy impacts.

✅ Renewables reach 16-30% by 2040, higher with strong policy support.

✅ Fossil fuels remain dominant, with oil flat and natural gas rising.

✅ EV share surges, cutting oil use; efficiency curbs demand growth.


Which is more plausible: flying taxis, wind turbine arrays stretching miles into the ocean, and a solar roof on every house--or a scorched-earth, flooded post-Apocalyptic world? 

We have no way of peeking into the future, but we can certainly imagine it. There is plenty of information about where the world is headed and regardless of how reliable this information is—or isn’t—we never stop wondering. Will the energy world of 20 years from now be better or worse than the world we live in now? 

The answer may very well lie in the observable trends.


A Growing Population

The global population is growing, and it will continue to grow in the next two decades. This will drive a steady growth in energy demand, at about 1 percent per year, according to the International Energy Agency.

This modest rate of growth is good news for all who are concerned about the future of the planet. Parts of the world are trying to reduce their energy consumption, and this should have a positive effect on the carbon footprint of humanity. The energy thirst of most parts of the world will continue growing, however, hence the overall growth.

The world’s population is currently growing at a rate of a little over 1 percent annually. This rate of growth has been slowing since its peak in the 1960s and forecasts suggest that it will continue to slow. Growth in energy demand, on the other hand, may at some point stop moving in tune with population growth trends as affluence in some parts of the world grows. The richer people get, the more energy they need. So, to the big question: where will this energy come from?


The Rise of Renewables

For all the headline space they have been claiming, it may come as a disappointing surprise to many that renewable energy, excluding hydropower, to date accounts for just 14 percent of the global primary energy mix. 

Certainly, adoption of solar and wind energy has been growing in leaps and bounds, with their global share doubling in five years in many markets, but unless governments around the world commit a lot more money and effort to renewable energy, by 2040, solar and wind’s share in the energy mix will still only rise to about 16 to 17 percent. That’s according to the only comprehensive report on the future of energy that collates data from all the leading energy authorities in the world, by non-profit Resources for the Future.

The growth in renewables adoption, however, would be a lot more impressive if governments do make serious commitments. Under that scenario, the share of renewables will double to over 30 percent by 2040, echoing milestones like over 30% of global electricity reached recently: that’s the median rate of all authoritative forecasts. Amongst them, the adoption rates of renewables vary between 15 percent and 61 percent by 2040.

Even the most bullish of the forecasts on renewables is still far below the 100-percent renewable future many would like to fantasize about, although BNEF’s 50% by 2050 outlook points to what could be possible in the power sector. 

But in 2040, most of the world’s energy will still come from fossil fuels.


EV Energy

Here, forecasters are more optimistic. Again, there is a wide variation between forecasts, but in each and every one of them the share of electric vehicles on the world’s roads in 2040 is a lot higher than the meagre 1 percent of the global car fleet EVs constitute today.
Related: Gas Prices Languish As Storage Falls To Near-Record Lows

Government policy will be the key, as U.S. progress toward 30% wind and solar shows how policy steers the power mix that EVs ultimately depend on. Bans of internal combustion engines will go a long way toward boosting EV adoption, which is why some forecasters expect electric cars to come to account for more than 50 percent of cars on the road in 2040. Others, however, are more guarded in their forecasts, seeing their share of the global fleet at between 16 percent and a little over 40 percent.

Many pin their hopes for a less emission-intensive future on electric cars. Indeed, as the number of EVs rises, they displace ICE vehicles and, respectively, the emission-causing oil that fuels for ICE cars are made from.  It should be a no brainer that the more EVs we drive, the less emissions we produce. Unfortunately, this is not necessarily the case: China is the world’s biggest EV market, and its solar PV expansion has been rapid, it has the most EVs—including passenger cars and buses—but it is also one of the biggest emitters.

Still, by 2040, if the more optimistic forecasts come true, the world will be consuming less oil than it is consuming now: anywhere from 1.2 million bpd to 20 million bpd less, the latter case envisaging an all-electric global fleet in 2040. 


This Ain’t Your Daddy’s Oil

No, it ain’t. It’s your grandchildren’s oil, for good or for bad. The vision of an oil-free world where renewable power is both abundant and cheap enough to replace all the ways in which crude oil and natural gas are used will in 2040 still be just that--a vision, with practical U.S. grid constraints underscoring the challenges. Even the most optimistic energy scenarios for two decades from now see them as the dominant source of energy, with forecasts ranging between 60 percent and 79 percent. While these extremes are both below the over-80 percent share fossil fuels have in the world’s energy mix, they are well above 50 percent, and in the U.S. renewables are projected to reach about one-fourth of electricity soon, even as fossil fuels remain foundational.

Still, there is good news. Fuel efficiency alone will reduce oil demand significantly by 2040. In fact, according to the IEA, demand will plateau at a little over 100 million bpd by the mid-2030s. Combined with the influx of EVs many expect, the world of 20 years from now may indeed be consuming a lot less oil than the world of today. It will, however, likely consume a lot more natural gas. There is simply no way around fossil fuels, not yet. Unless a miracle of politics happens (complete with a ripple effect that will cost millions of people their jobs) in 2040 we will be as dependent on oil and gas as we are but we will hopefully breathe cleaner air.

By Irina Slav for Oilprice.com


Related News

View more

Electricity prices rise more than double EU average in first half of 2021

Estonia energy prices 2021 show sharp electricity hikes versus the EU average, mixed natural gas trends, kWh tariffs on Nord Pool spiking, and VAT, taxes, and support measures shaping household bills.


Key Points

EU-high electricity growth, early gas dip, then Nord Pool spikes; taxes, VAT, and subsidies shaped energy bills.

✅ Electricity up 7% on year; EU average 2.8% in H1 2021.

✅ Gas fell 1% in H1; later spiked with global market.

✅ VAT, taxes, excise and aid impacted household costs.


Estonia saw one of the highest rates in growth of electricity prices in the first half of 2021, compared with the same period in key trends in 2020 across Europe. These figures were posted before the more recent, record level of electricity and natural gas prices; the latter actually dropped slightly in Estonia in the first half of the year.

While electricity prices rose 7 percent on year in the first half of 2021 in Estonia, the average for the EU as a whole, where energy prices drove inflation across the bloc, stood at 2.8 percent over the same period, BNS reports.

Hungary (€10 per 100 Kwh) and Bulgaria (€10.20 per 100 Kwh) saw the lowest electricity prices EU-wide, while at €31.9 per KWH, Germany's power prices posted the most expensive rate, while Denmark, Belgium and Ireland also had high prices, in excess of €25 per Kwh.

Slovenia saw the highest electricity price rise, at 15 percent, and even the United States' electricity prices saw their steepest rise in decades during the same era, while Estonia was in third place, joint with Romania at 7 percent as noted, and behind Poland (8 percent).

Lithuania, on the other hand, experienced the third highest electricity price fall over the first half of 2021, compared with the same period in 2020, at 6 percent, behind only Cyprus (7 percent) and the Netherlands (10 percent, largely due to a tax cut).

Urmas Reinsalu: VAT on electricity, gas and heating needs to be lowered
The EU average price of electricity was €21.9 percent per Kwh, with taxes and excise accounting for 39 percent of this, even as prices in Spain surged across the day-ahead market.

Estonia has also seen severe electricity price rises in the second half of the year so far, with records set and then promptly broken several times earlier in October, while an Irish electricity provider raised prices amid similar pressures, and a support package for low income households rolled out for the winter season (October to March next year). The price on the Nord Pool market as of €95.01 per Kwh; a day earlier it had stood at €66.21 per Kwh, while on October 19 the price was €140.68 per Kwh.

Gas prices
Natural gas prices to household, meanwhile, dropped in Estonia over the same period, at a sharper rate (1 percent) than the EU average (0.5 percent), according to Eurostat.

Gas prices across the EU were lowest in Lithuania (€2.8 per 100 Kwh) and highest in the Netherlands (€9.6 per KWH), while the highest growth was seen in Denmark (19 percent), in the first half of 2021.

Natural gas prices dropped in 20 member states, however, with the largest drop again coming in Lithuania (23 percent).

The average price of natural gas EU-side in the first half of 2021 was €6.4, and taxes and excise duties accounted on average for 36 percent of the total.

The second half of the year has seen steep gas price rises in Estonia, largely the result of increases on the world market, though European gas benchmarks later fell to pre-Ukraine war levels.


Related News

View more

Utilities see benefits in energy storage, even without mandates

Utility Battery Storage Rankings measure grid-connected capacity, not ownership, highlighting MW, MWh, and watts per customer across PJM, MISO, and California IOUs, featuring Duke Energy, IPL, ancillary services, and frequency regulation benefits.


Key Points

Rankings that track energy storage connected to utility grids, comparing MW, MWh, and W/customer rather than ownership.

✅ Ranks by MW, MWh, and watts per customer, not asset ownership

✅ Highlights PJM, MISO cases and California IOUs' deployments

✅ Examples: Duke Energy, IPL, IID; ancillary services, frequency response


The rankings do not tally how much energy storage a utility built or owns, but how much was connected to their system. So while IPL built and owns the storage facility in its territory, Duke does not own the 16 MW of storage that connected to its system in 2016. Similarly, while California’s utilities are permitted to own some energy storage assets, they do not necessarily own all the storage facilities connected to their systems.

Measured by energy (MWh), IPL ranked fourth with 20 MWh, and Duke Energy Ohio ranked eighth with 6.1 MWh.

Ranked by energy storage watts per customer, IPL and Duke actually beat the California utilities, ranking fifth and sixth with 42 W/customer and 23 W/customer, respectively.

Duke ready for next step

Given Duke’s plans, including projects in Florida that are moving ahead, the utility is likely to stay high in the rankings and be more of a driving force in development. “Battery technology has matured, and we are ready to take the next step,” Duke spokesman Randy Wheeless told Utility Dive. “We can go to regulators and say this makes economic sense.”

Duke began exploring energy storage in 2012, and until now most of its energy storage efforts were focused on commercial projects in competitive markets where it was possible to earn revenues. Those included its 36 MW Notrees battery storage project developed in partnership with the Department of Energy in 2012 that provides frequency regulation for the Electric Reliability Council of Texas market and two 2 MW storage projects at its retired W.C. Beckjord plant in New Richmond, Ohio, that sells ancillary services into the PJM Interconnection market.

On the regulated side, most of Duke’s storage projects have had “an R&D slant to them,” Wheeless said, but “we are moving beyond the R&D concept in our regulated territory and are looking at storage more as a regulated asset.”

“We have done the demos, and they have proved out,” Wheeless said. Storage may not be ready for prime time everywhere, he said, but in certain locations, especially where it can it can be used to do more than one thing, it can make sense.

Wheeless said Duke would be making “a number of energy storage announcements in the next few months in our regulated states.” He could not provide details on those projects.

More flexible resources
Location can be a determining factor when building a storage facility. For IPL, serving the wholesale market was a driving factor in the rationale to build its 20 MW, 20 MWh storage facility in Indianapolis.

IPL built the project to address a need for more flexible resources in light of “recent changes in our resource mix,” including decreasing coal-fired generation and increasing renewables and natural gas-fired generation, as other regions plan to rely on battery storage to meet rising demand, Joan Soller, IPL’s director of resource planning, told Utility Dive in an email. The storage facility is used to provide primary frequency response necessary for grid stability.

The Harding Street storage facility in May. It was the first energy storage project in the Midcontinent ISO. But the regulatory path in MISO is not as clear as it is in PJM, whereas initiatives such as Ontario storage framework are clarifying participation. In November, IPL with the Federal Energy Regulatory Commission, asking the regulator to find that MISO’s rules for energy storage are deficient and should be revised.

Soller said IPL has “no imminent plans to install energy storage in the future but will continue to monitor battery costs and capabilities as potential resources in future Integrated Resource Plans.”

California legislative and regulatory push

In California, energy storage did not have to wait for regulations to catch up with technology. With legislative and regulatory mandates, including CEC long-duration storage funding announced recently, as a push, California’s IOUs took high places in SEPA’s rankings.

Southern California Edison and San Diego Gas & Electric were first and fourth (63.2 MW and 17.2 MW), respectively, in terms of capacity. SoCal Ed and SDG&E were first and second (104 MWh and 28.4 MWh), respectively, and Pacific Gas and Electric was fifth (17 MWh) in terms of energy.

But a public power utility, the Imperial Irrigation District (IID), ended up high in the rankings – second in capacity (30 MW) and third  in energy (20 MWh) – even though as a public power entity it is not subject to the state’s energy storage mandates.

But while IID was not under state mandate, it had a compelling regulatory reason to build the storage project. It was part of a settlement reached with FERC over a September 2011 outage, IID spokeswoman Marion Champion said.

IID agreed to a $12 million fine as part of the settlement, of which $9 million was applied to physical improvements of IID’s system.

IID ended up building a 30 MW, 20 MWh lithium-ion battery storage system at its El Centro generating station. The system went into service in October 2016 and in May, IID used the system’s 44 MW combined-cycle natural gas turbine at the generating station.

Passing savings to customers
The cost of the storage system was about $31 million, and based on its experience with the El Centro project, Champion said IID plans to add to the existing batteries. “We are continuing to see real savings and are passing those savings on to our customers,” she said.

Champion said the battery system gives IID the ability to provide ancillary services without having to run its larger generation units, such as El Centro Unit 4, at its minimum output. With gas prices at $3.59 per million British thermal units, it costs about $26,880 a day to run Unit 4, she said.

IID’s territory is in southeastern California, an area with a lot of renewable resources. IID is also not part of the California ISO and acts as its own balancing authority. The battery system gives the utility greater operational flexibility, in addition to the ability to use more of the surrounding renewable resources, Champion said.

In May, IID’s board gave the utility’s staff approval to enter into contract negotiations for a 7 MW, 4 MWh expansion of its El Centro storage facility. The negotiations are ongoing, but approval could come in the next couple months, Champion said.

The heart of the issue, though, is “the ability of the battery system to lower costs for our ratepayers,” Champion said. “Our planning section will continue to utilize the battery, and we are looking forward to its expansion,” she said.” I expect it will play an even more important role as we continue to increase our percentage of renewables.”


Related News

View more

Only one in 10 utility firms prioritise renewable electricity – global study

Utility Renewable Investment Gap highlights Oxford study in Nature Energy: most electric utilities favor fossil fuels over clean energy transition, expanding coal and gas, risking stranded assets and missing climate targets despite global decarbonization commitments.


Key Points

Most utilities grow fossil capacity over renewables, slowing decarbonization and jeopardizing climate goals.

✅ Only 10% expand renewables faster than coal and gas growth

✅ 60% still add fossil plants; 15% actively cut coal and gas

✅ Risks: stranded assets, missed climate targets, policy backlash


Only one in 10 of the world’s electric utility companies are prioritising clean energy investment over growing their capacity of fossil fuel power plants, according to research from the University of Oxford.

The study of more than 3,000 utilities found most remain heavily invested in fossil fuels despite international efforts to reduce greenhouse gas emissions and barriers to 100% renewables in the US that persist, and some are actively expanding their portfolio of polluting power plants.

The majority of the utility companies, many of which are state owned, have made little change to their generation portfolio in recent years.

Only 10% of the companies in the study, published in the research journal Nature Energy, are expanding their renewable energy capacity, mirroring global wind and solar growth patterns, at a faster rate than their gas- or coal-fired capacity.

Advertisement
Of the companies prioritising renewable energy growth, 60% have not stopped concurrently expanding their fossil fuel portfolio and only 15% of these companies are actively reducing their gas and coal capacity.

Galina Alova, the author of the report, said the research highlighted “a worrying gap between what is needed” to tackle the climate crisis, with calls for a fossil fuel lockdown gaining attention, and “what actions are being taken by the utility sector”.

The report found 10% of utilities were favouring growth in gas-fired power plants. This cluster is dominated by US utilities, even as renewables surpass coal in US generation in the broader market, eager to take advantage of the country’s shale gas reserves, followed by Russia and Germany.

Only 2% of utilities are actively growing their coal-fired power capacity ahead of renewables or gas. This cluster is dominated by Chinese utilities – which alone contributed more than 60% of coal-focused companies – followed by India and Vietnam.

The report found the majority of companies prioritising renewable energy were clustered in Europe. Many of the industry’s biggest players are investing in low-carbon energy and green technologies, even as clean energy's dirty secret prompts debate, to replace their ageing fossil fuel power plants.


Sign up to the daily Business Today email or follow Guardian Business on Twitter at @BusinessDesk
In the UK, amid UK renewables backlog that has stalled billions, coal plants are shutting at pace ahead of the government’s 2025 ban on coal-fired power in part because the UK’s domestic carbon tax on power plants make them uneconomic to run.

“Although there have been a few high-profile examples of individual electric utilities investing in renewables, this study shows that overall, the sector is making the transition to clean energy slowly or not at all,” Alova said.

“Utilities’ continued investment in fossil fuels leaves them at risk of stranded assets – where power plants will need to be retired early – and undermines global efforts to tackle climate change.”


Related News

View more

Cost, safety drive line-burying decisions at Tucson Electric Power

TEP Undergrounding Policy prioritizes selective underground power lines to manage wildfire risk, engineering costs, and ratepayer impacts, balancing transmission and distribution reliability with right-of-way, safety, and vegetation management per Arizona regulators.


Key Points

A selective TEP approach to bury lines where safety, engineering, and cost justify undergrounding.

✅ Selective undergrounding for feeders near substations

✅ Balances wildfire mitigation, reliability, and ratepayer costs

✅ Follows ACC rules, BLM and USFS vegetation management


Though wildfires in California caused by power lines have prompted calls for more underground lines, Tucson Electric Power Co. plans to keep to its policy of burying lines selectively for safety.

Like many other utilities, TEP typically doesn’t install its long-range, high-voltage transmission lines, such as the TransWest Express project, and distribution equipment underground because of higher costs that would be passed on to ratepayers, TEP spokesman Joe Barrios said.

But the company will sometimes bury lower-voltage lines and equipment where it is cost-effective or needed for safety as utilities adapt to climate change across North America, or if customers or developers are willing to pay the higher installation costs

Underground installations generally include additional engineering expenses, right-of-way acquisition for projects like the New England Clean Power Link in other regions, and added labor and materials, Barrios said.

“This practice avoids passing along unnecessary costs to customers through their rates, so that all customers are not asked to subsidize a discretionary expenditure that primarily benefits residents or property owners in one small area of our service territory,” he said, adding that the Arizona Corporation Commission has supported the company’s policy.

Even so, TEP will place equipment underground in some circumstances if engineering or safety concerns, including electrical safety tips that utilities promote during storm season, justify the additional cost of underground installation, Barrios said.

In fact, lower-voltage “feeder” lines emerging from distribution substations are typically installed underground until the lines reach a point where they can be safely brought above ground, he added.

While in California PG&E has shut off power during windy weather to avoid wildfires in forested areas traversed by its power lines after events like the Drum Fire last June, TEP doesn’t face the same kind of wildfire risk, Barrios said.

Most of TEP’s 5,000 miles of transmission and distribution lines aren’t located in heavily forested areas that would raise fire concerns, though large urban systems have seen outages after station fires in Los Angeles, he said.

However, TEP has an active program of monitoring transmission lines and trimming vegetation to maintain a fire-safety buffer zone and address risks from vandalism such as copper theft where applicable, in compliance with federal regulations and in cooperation with the U.S. Bureau of Land Management and the U.S. Forest Service.


Related News

View more

Sign Up for Electricity Forum’s Newsletter

Stay informed with our FREE Newsletter — get the latest news, breakthrough technologies, and expert insights, delivered straight to your inbox.

Electricity Today T&D Magazine Subscribe for FREE

Stay informed with the latest T&D policies and technologies.
  • Timely insights from industry experts
  • Practical solutions T&D engineers
  • Free access to every issue

Live Online & In-person Group Training

Advantages To Instructor-Led Training – Instructor-Led Course, Customized Training, Multiple Locations, Economical, CEU Credits, Course Discounts.

Request For Quotation

Whether you would prefer Live Online or In-Person instruction, our electrical training courses can be tailored to meet your company's specific requirements and delivered to your employees in one location or at various locations.