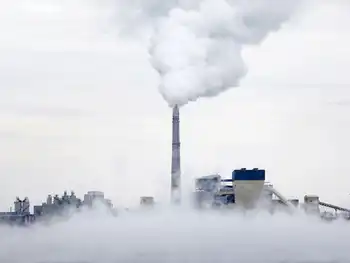
Activists oppose wood-burning power plant

By Knight Ridder Tribune


Protective Relay Training - Basic

Our customized live online or in‑person group training can be delivered to your staff at your location.

  • Live Online
  • 12 hours Instructor-led
  • Group Training Available
Regular Price:
$699
Coupon Price:
$599
Reserve Your Seat Today
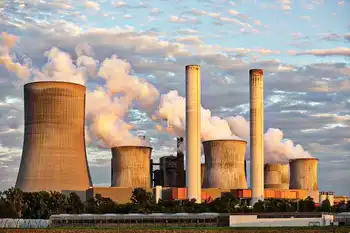
Environmental groups said that the state Department of Environmental Protection should not issue permits for a proposed wood-burning power plant in eastern Connecticut, saying the plant would be a health hazard because it would use construction and demolition waste.

"Take a look. This is lead paint. How is someone going to sort this out?" asked Roger Smith, campaign director for the Connecticut chapter of Clean Water Action, as he held a piece of demolition waste during a press conference in Hartford.

The target of the complaints was Plainfield Renewable Energy, a plant planned for Plainfield that would burn wood to make electricity. The plant is awaiting air and water permits from the DEP.

The state Department of Public Utility Control is considering providing the plant with ratepayer-funded incentives under a Connecticut Clean Energy Fund program to promote renewable and clean energy.

"It's absurd that a power plant could emit 7,200 pounds a year of lead and 1,400 pounds per year of arsenic and be considered a clean energy source," said Christopher Phelps of Environment Connecticut.

The developer of the plant dismissed the complaints, saying they arose from misinformation being spread by a competing wood-to-electricity project, also proposed for eastern Connecticut. The Plainfield plant will meet all DEP requirements for emissions, with only low levels of the substances that concern environmentalists being released, said Daniel Donovan, vice president of Plainfield Renewable Energy.

"This is very much renewable," Donovan said. "On the air emissions side, there is not an issue. It is being trumped up."

A spokesman for the DEP said employees are reviewing the plant's permit applications, but couldn't provide a timetable for when the department would make a decision. Both Donovan and the environmental groups believe the DEP is close to making a decision on the plant, which applied for its permits 14 months ago.

Related News

New York Faces Soaring Energy Bills

New York faces soaring energy bills as utilities seek record rate hikes, aging grid infrastructure demands upgrades, and federal renewable policies shift. Consumers struggle with affordability, late payments, and rising costs of delivery and energy supply across the state.


Why is New York Facing Soaring Energy Bills?

New York faces soaring energy bills because utilities are raising rates to cover the costs of grid upgrades, inflation, and policy-driven changes in energy supply.

✅ Utilities seek double-digit rate hikes across the state

✅ Aging infrastructure and storm repairs increase delivery costs

✅ Federal policies and gas dependence push energy prices higher

New Yorkers are bracing for another wave of energy bill increases as utilities seek record-high rate hikes and policy changes ripple through the state’s power system. Electric bills in New York are the highest they’ve been in over a decade, and more than a million households are now at least two months behind on payments, a sign of pandemic energy insecurity that continues to strain budgets, owing utilities nearly $2 billion.

Record numbers of households have had their electricity or gas shut off this year — more than 61,000 in May alone — despite pandemic shut-off suspensions that had offered temporary relief, the highest the Public Utility Law Project (PULP) has ever recorded. “This August was the group’s busiest month ever,” said Laurie Wheelock, PULP’s executive director, citing a surge in calls to its hotline. “The top concern on people’s minds: rate hikes.”

Utilities across the state are pushing for significant price increases, citing aging infrastructure, the need for climate adaptation, and higher operating costs, as California regulators face calls for action amid rising bills. “We used to see single-digit rate hikes and now we see double-digit rate hikes,” said Jessica Azulay, executive director of the Alliance for a Green Economy. “That’s a new normal that is unacceptable.”

Several utilities have requested delivery rate increases of 25 percent or more, with some proposals as high as 39 percent. Upstate utilities NYSEG and RG&E are seeking to raise electric and gas bills by about $33 a month, although regulators are unlikely to approve the full amount.

The companies argue the hikes are needed “to pay for rebuilding an aging grid and expanding its capacity to meet residents’ and businesses’ service demands,” including storm repairs. They also claim the plan would create more than 1,000 jobs.

James Denn, a spokesperson for the Public Service Commission (PSC), said much of the cost pressure stems from “inflation, higher interest rates, supply chain disruptions, the global push to upgrade electrical infrastructure, and, most recently, the rising risk and uncertainty from tariffs,” trends reflected in U.S. electricity price data over the past two years.

While some have blamed New York’s clean-energy transition, a PSC report found that state climate policies account for only 5 to 9.5 percent of the average household’s electric bill, or approximately $10 to $12 per month. The bulk of the increases still come from traditional spending on infrastructure, storm resilience, and system expansion.

On the supply side, costs are rising too. President Donald Trump’s recent policies have threatened renewable-energy investment nationwide, even as states’ renewable ambitions carry significant costs, potentially adding to New York’s woes. His July “megabill” phases out a 30 percent federal tax credit for solar and wind unless projects begin construction by mid-2026. Industry experts warn that the changes could make renewables “more expensive to build” and “increase reliance on gas.”

“It just means more expensive power,” said Marguerite Wells of the Alliance for Clean Energy New York.

The state estimates Trump’s policy shifts could cost New York $60 billion in lost renewable investment. With fewer clean-energy projects moving forward, gas — which already supplies roughly half of the state’s electricity — will remain the dominant source, tying energy prices to volatile global markets and the kinds of price drivers seen in California in recent years.

Governor Kathy Hochul has called affordability “our greatest short-term challenge,” while consumer advocates are demanding reforms to reduce utility profits and overhaul “rate design,” and to strengthen protections such as the emergency disconnection moratorium that applies during declared emergencies.

“There is definitely a groundswell of concern,” Wheelock said. “We go to meetings and we’re getting questions about rate design, like, ‘What is the revenue decoupling mechanism?’ Never had that question before.”


Related Articles


View more

Cost, safety drive line-burying decisions at Tucson Electric Power

TEP Undergrounding Policy prioritizes selective underground power lines to manage wildfire risk, engineering costs, and ratepayer impacts, balancing transmission and distribution reliability with right-of-way, safety, and vegetation management per Arizona regulators.


Key Points

A selective TEP approach to bury lines where safety, engineering, and cost justify undergrounding.

✅ Selective undergrounding for feeders near substations

✅ Balances wildfire mitigation, reliability, and ratepayer costs

✅ Follows ACC rules, BLM and USFS vegetation management


Though wildfires in California caused by power lines have prompted calls for more underground lines, Tucson Electric Power Co. plans to keep to its policy of burying lines selectively for safety.

Like many other utilities, TEP typically doesn’t install its long-range, high-voltage transmission lines, such as the TransWest Express project, and distribution equipment underground because of higher costs that would be passed on to ratepayers, TEP spokesman Joe Barrios said.

But the company will sometimes bury lower-voltage lines and equipment where it is cost-effective or needed for safety as utilities adapt to climate change across North America, or if customers or developers are willing to pay the higher installation costs

Underground installations generally include additional engineering expenses, right-of-way acquisition for projects like the New England Clean Power Link in other regions, and added labor and materials, Barrios said.

“This practice avoids passing along unnecessary costs to customers through their rates, so that all customers are not asked to subsidize a discretionary expenditure that primarily benefits residents or property owners in one small area of our service territory,” he said, adding that the Arizona Corporation Commission has supported the company’s policy.

Even so, TEP will place equipment underground in some circumstances if engineering or safety concerns, including electrical safety tips that utilities promote during storm season, justify the additional cost of underground installation, Barrios said.

In fact, lower-voltage “feeder” lines emerging from distribution substations are typically installed underground until the lines reach a point where they can be safely brought above ground, he added.

While in California PG&E has shut off power during windy weather to avoid wildfires in forested areas traversed by its power lines after events like the Drum Fire last June, TEP doesn’t face the same kind of wildfire risk, Barrios said.

Most of TEP’s 5,000 miles of transmission and distribution lines aren’t located in heavily forested areas that would raise fire concerns, though large urban systems have seen outages after station fires in Los Angeles, he said.

However, TEP has an active program of monitoring transmission lines and trimming vegetation to maintain a fire-safety buffer zone and address risks from vandalism such as copper theft where applicable, in compliance with federal regulations and in cooperation with the U.S. Bureau of Land Management and the U.S. Forest Service.


Related News

View more

UK low-carbon electricity generation stalls in 2019

UK low-carbon electricity 2019 saw stalled growth as renewables rose slightly, wind expanded, nuclear output fell, coal hit record lows, and net-zero targets demand faster deployment to cut CO2 intensity below 100gCO2/kWh.


Key Points

Low-carbon sources supplied 54% of UK power in 2019, up just 1TWh; wind grew, nuclear fell, and coal dropped to 2%.

✅ Wind up 8TWh; nuclear down 9TWh amid outages

✅ Fossil fuels 43% of generation; coal at 2%

✅ Net-zero needs 15TWh per year added to 2030


The amount of electricity generated by low-carbon sources in the UK stalled in 2019, Carbon Brief analysis shows.

Low-carbon electricity output from wind, solar, nuclear, hydro and biomass rose by just 1 terawatt hour (TWh, less than 1%) in 2019. It represents the smallest annual increase in a decade, where annual growth averaged 9TWh. This growth will need to double in the 2020s to meet UK climate targets while replacing old nuclear plants as they retire.

Some 54% of UK electricity generation in 2019 came from low-carbon sources, including 37% from renewables and 20% from wind alone, underscoring wind's leading role in the power mix during key periods. A record-low 43% was from fossil fuels, with 41% from gas and just 2% from coal, also a record low. In 2010, fossil fuels generated 75% of the total.

Carbon Brief’s analysis of UK electricity generation in 2019 is based on figures from BM Reports and the Department for Business, Energy and Industrial Strategy (BEIS). See the methodology at the end for more on how the analysis was conducted.

The numbers differ from those published earlier in January by National Grid, which were for electricity supplied in Great Britain only (England, Wales and Scotland, but excluding Northern Ireland), including via imports from other countries.

Low-carbon low
In 2019, the UK became the first major economy to target net-zero greenhouse gas emissions by 2050, increasing the ambition of its legally binding Climate Change Act.

To date, the country has cut its emissions by around two-fifths since 1990, with almost all of its recent progress coming from the electricity sector.

Emissions from electricity generation have fallen rapidly in the decade since 2010 as coal power has been almost phased out and even gas output has declined. Fossil fuels have been displaced by falling demand and by renewables, such as wind, solar and biomass.

But Carbon Brief’s annual analysis of UK electricity generation shows progress stalled in 2019, with the output from low-carbon sources barely increasing compared to a year earlier.

The chart below shows low-carbon generation in each year since 2010 (grey bars) and the estimated level in 2019 (red). The pale grey bars show the estimated future output of existing low-carbon sources after old nuclear plants retire and the pale red bars show the amount of new generation needed to keep electricity sector emissions to less than 100 grammes of CO2 per kilowatt hour (gCO2/kWh), the UK’s nominal target for the sector.

 Annual electricity generation in the UK by fuel, terawatt hours, 2010-2019. Top panel: fuel by fuel. Bottom panel: cumulative total generation from all sources. Source: BEIS energy trends, BM Reports and Carbon Brief analysis. Chart by Carbon Brief using Highcharts.
As the chart shows, the UK will require significantly more low-carbon electricity over the next decade as part of meeting its legally binding climate goals.

The nominal 100gCO2/kWh target for 2030 was set in the context of the UK’s less ambitious goal of cutting emissions to 80% below 1990 levels by 2050. Now that the country is aiming to cut emissions to net-zero by 2050, that 100gCO2/kWh indicator is likely to be the bare minimum.

Even so, it would require a rapid step up in the pace of low-carbon expansion, compared to the increases seen over the past decade. On average, low-carbon generation has risen by 9TWh each year in the decade since 2010 – including a rise of just 1TWh in 2019.

Given scheduled nuclear retirements and rising demand expected by the Committee on Climate Change (CCC) – with some electrification of transport and heating – low-carbon generation would need to increase by 15TWh each year until 2030, just to meet the benchmark of 100gCO2/kWh.

For context, the 3.2 gigawatt (GW) Hinkley C new nuclear plant being built in Somerset will generate around 25TWh once completed around 2026. The world’s largest offshore windfarm, the 1.2GW Hornsea One scheme off the Yorkshire coast, will generate around 5TWh each year.

The new Conservative government is targeting 40GW of offshore wind by 2030, up from today’s figure of around 8GW. If policies are put in place to meet this goal, then it could keep power sector emissions below 100gCO2/kWh, depending on the actual performance of the windfarms built.

However, new onshore wind and solar, further new nuclear or other low-carbon generation, such as gas with carbon capture and storage (CCS), is likely to be needed if demand is higher than expected, or if the 100gCO2/kWh benchmark is too weak in the context of net-zero by 2050.

The CCC says it is “likely” to “reflect the need for more rapid deployment” of low-carbon towards net-zero emissions in its advice on the sixth UK carbon budget for 2033-2037, due in September.

Trading places
Looking more closely at UK electricity generation in 2019, Carbon Brief’s analysis shows why there was so little growth for low-carbon sources compared to the previous year.

There was another increase for wind power in 2019 (up 8TWh, 14%), with record wind generation as several large new windfarms were completed including the 1.2GW Hornsea One project in October and the 0.6GW Beatrice offshore windfarm in Q2 of 2019. But this was offset by a decline for nuclear (down 9TWh, 14%), due to ongoing outages for reactors at Hunterston in Scotland and Dungeness in Kent.

(Analysis of data held by trade organisation RenewableUK suggests some 0.6GW of onshore wind capacity also started operating in 2019, including the 0.2GW Dorenell scheme in Moray, Scotland.)

As a result of these movements, the UK’s windfarms overtook nuclear for the first time ever in 2019, becoming the country’s second-largest source of electricity generation, and earlier, wind and solar together surpassed nuclear in the UK as momentum built. This is shown in the figure below, with wind (green line, top panel) trading places with nuclear (purple) and gas (dark blue) down around 25% since 2010 but remaining the single-largest source.

 Annual electricity generation in the UK by fuel, terawatt hours, 2010-2019. Top panel: fuel by fuel. Bottom panel: cumulative total generation from all sources. Source: BEIS energy trends, BM Reports and Carbon Brief analysis. Chart by Carbon Brief using Highcharts.
The UK’s currently suspended nuclear plants are due to return to service in January and March, according to operator EDF, the French state-backed utility firm. However, as noted above, most of the UK’s nuclear fleet is set to retire during the 2020s, with only Sizewell B in Suffolk due to still be operating by 2030. Hunterston is scheduled to retire by 2023 and Dungeness by 2028.

Set against these losses, the UK has a pipeline of offshore windfarms, secured via “contracts for difference” with the government, at a series of auctions. The most recent auction, in September 2019, saw prices below £40 per megawatt hour – similar to current wholesale electricity prices.

However, the capacity contracted so far is not sufficient to meet the government’s target of 40GW by 2030, meaning further auctions – or some other policy mechanism – will be required.

Coal zero
As well as the switch between wind and nuclear, 2019 also saw coal fall below solar for the first time across a full year, echoing the 2016 moment when wind outgenerated coal across the UK, after it suffered another 60% reduction in electricity output. Just six coal plants remain in the UK, with Aberthaw B in Wales and Fiddlers Ferry in Cheshire closing in March.

Coal accounted for just 2% of UK generation in 2019, a record-low coal share since centralised electricity supplies started to operate in 1882. The fuel met 40% of UK needs as recently as 2012, but has plummeted thanks to falling demand, rising renewables, cheaper gas and higher CO2 prices.

The reduction in average coal generation hides the fact that the fuel is now often not required at all to meet the UK’s electricity needs. The chart below shows the number of days each year when coal output was zero in 2019 (red line) and the two previous years (blue).

 Cumulative number of days when UK electricity generation from renewable sources has been higher than that from fossil fuels. Source: BEIS energy trends, BM Reports and Carbon Brief analysis. Chart by Carbon Brief using Highcharts.
The 83 days in 2019 with zero coal generation amount to nearly a quarter of the year and include the record-breaking 18-day stretch without the fuel.

Great Britain has been running for a record TWO WEEKS without using coal to generate electricity – the first time this has happened since 1882.

The country’s grid has been coal-free for 45% of hours in 2019 so far.https://www.carbonbrief.org/countdown-to-2025-tracking-the-uk-coal-phase-out …

Coal generation was set for significant reductions around the world in 2019 – including a 20% reduction for the EU as a whole – according to analysis published by Carbon Brief in November.

Notably, overall UK electricity generation fell by another 9TWh in 2019 (3%), bringing the total decline to 58TWh since 2010. This is equivalent to more than twice the output from the Hinkley C scheme being built in Somerset. As Carbon Brief explained last year, falling demand has had a similar impact on electricity-sector CO2 emissions as the increase in output from renewables.

This is illustrated by the fact that the 9TWh reduction in overall generation translated into a 9TWh (6%) cut in fossil-fuel generation during 2019, with coal falling by 10TWh and gas rising marginally.

Increasingly renewable
As fossil-fuel output and overall generation have declined, the UK’s renewable sources of electricity have continued to increase. Their output has risen nearly five-fold in the past decade and their share of the UK total has increased from 7% in 2010 to 37% in 2019.

As a result, the UK’s increasingly renewable grid is seeing more minutes, hours and days during which the likes of wind, solar and biomass collectively outpace all fossil fuels put together, and on some days wind is the main source as well.

The chart below shows the number of days during each year when renewables generated more electricity than fossil fuels in 2019 (red line) and each of the previous four years (blue lines). In total, nearly two-fifths of days in 2019 crossed this threshold.

 Cumulative number of days when the UK has not generated any electricity from coal. Source: BEIS energy trends, BM Reports and Carbon Brief analysis. Chart by Carbon Brief using Highcharts.
There were also four months in 2019 when renewables generated more of the UK’s electricity than fossil fuels: March, August, September and December. The first ever such month came in September 2018 and more are certain to follow.

National Grid, which manages Great Britain’s high-voltage electricity transmission network, is aiming to be able to run the system without fossil fuels by 2025, at least for short periods. At present, it sometimes has to ask windfarm operators to switch off and gas plants to start running in order to keep the electricity grid stable.

Note that biomass accounted for 11% of UK electricity generation in 2019, nearly a third of the total from all renewables. Some two-thirds of the biomass output is from “plant biomass”, primarily wood pellets burnt at Lynemouth in Northumberland and the Drax plant in Yorkshire. The remainder was from an array of smaller sites based on landfill gas, sewage gas or anaerobic digestion.

The CCC says the UK should “move away” from large-scale biomass power plants, once existing subsidy contracts for Drax and Lynemouth expire in 2027.

Using biomass to generate electricity is not zero-carbon and in some circumstances could lead to higher emissions than from fossil fuels. Moreover, there are more valuable uses for the world’s limited supply of biomass feedstock, the CCC says, including carbon sequestration and hard-to-abate sectors with few alternatives.

Methodology
The figures in the article are from Carbon Brief analysis of data from BEIS Energy Trends chapter 5 and chapter 6, as well as from BM Reports. The figures from BM Reports are for electricity supplied to the grid in Great Britain only and are adjusted to include Northern Ireland.

In Carbon Brief’s analysis, the BM Reports numbers are also adjusted to account for electricity used by power plants on site and for generation by plants not connected to the high-voltage national grid. This includes many onshore windfarms, as well as industrial gas combined heat and power plants and those burning landfill gas, waste or sewage gas.

By design, the Carbon Brief analysis is intended to align as closely as possible to the official government figures on electricity generated in the UK, reported in BEIS Energy Trends table 5.1.

Briefly, the raw data for each fuel is in most cases adjusted with a multiplier, derived from the ratio between the reported BEIS numbers and unadjusted figures for previous quarters.

Carbon Brief’s method of analysis has been verified against published BEIS figures using “hindcasting”. This shows the estimates for total electricity generation from fossil fuels or renewables to have been within ±3% of the BEIS number in each quarter since Q4 2017. (Data before then is not sufficient to carry out the Carbon Brief analysis.)

For example, in the second quarter of 2019, a Carbon Brief hindcast estimates gas generation at 33.1TWh, whereas the published BEIS figure was 34.0TWh. Similarly, it produces an estimate of 27.4TWh for renewables, against a BEIS figure of 27.1TWh.

National Grid recently shared its own analysis for electricity in Great Britain during 2019 via its energy dashboard, which differs from Carbon Brief’s figures.


Related News

View more

94,000 lose electricity in LA area after fire at station

Los Angeles Power Station Fire prompts LADWP to shut a Northridge/Reseda substation, causing a San Fernando Valley outage amid a heatwave; high-voltage equipment and mineral oil burned as 94,000 customers lost power, elevator rescues reported.


Key Points

An LADWP substation fire in Northridge/Reseda caused a major outage; 94,000 customers affected as crews restore power.

✅ Fire started around 6:52 p.m.; fully extinguished by 9 p.m.

✅ High-voltage gear and mineral oil burned; no injuries reported.

✅ Outages hit Porter Ranch, Reseda, West Hills, Granada Hills.


About 94,000 customers were without electricity Saturday night after the Los Angeles Department of Water and Power shut down a power station in the northeast San Fernando Valley that caught fire, the agency said.

The fire at the station in the Northridge/Reseda area of Los Angeles started about 6:52 p.m. and involved equipment that carries high-voltage electricity and distributes it at lower voltages to customers in the surrounding area, the department said, even as other utilities sometimes deploy wildfire safety shut-offs to reduce risk during dangerous conditions.

The department shut off power to the station as a precautionary move, and it is restoring power now that the fire has been put out, similar to restoration after intentional shut-offs in other parts of California. Initially, 140,000 customers were without power. That number had been cut to 94,000 by 11 p.m.

The power outage comes as much of California baked in heat that broke records, and rolling blackout warnings were issued as the grid strained. A record that stood 131 years in Los Angeles was snapped when the temperature spiked at 98 degrees downtown.

People reported losing power in Porter Ranch, Winnetka, West Hills, Canoga Park, Woodland Hills, Granada Hills, North Hills, Reseda and Chatsworth, KABC TV reported, highlighting electricity inequality across communities.

Shortly after the blaze broke out, firefighters found a huge container of mineral oil that is used to cool electrical equipment on fire, Los Angeles Fire Department spokesman Brian Humphrey told the Los Angeles Times. The incident underscores infrastructure risks that in some regions have required a complete grid rebuild after severe storms.

Firefighters had the blaze under control by 8:30 p.m. and were able to put it out by 9 p.m., Humphrey said. "These were fierce flames, with smoke towering more than 300 feet into the sky," he told the newspaper.

No one was injured.

Firefighters rescued people who were stranded in elevators, Humphrey said.


Related News

View more

Roads Need More Electricity: They Will Make It Themselves

Electrically Smart Roads integrate solar road surfaces, inductive charging, IoT sensors, AI analytics, and V2X to power lighting, deicing, and monitoring, reducing grid dependence while enabling dynamic EV charging and real-time traffic management.


Key Points

Electrically smart roads generate power, sense conditions, and charge EVs using solar, IoT, AI, and dynamic infrastructure.

✅ Solar surfaces, verges, and gantries generate on-site electricity

✅ Inductive lanes enable dynamic EV charging at highway speeds

✅ Embedded IoT sensors and AI deliver real-time traffic insights


As more and more capabilities are added to roads instead of simply covering a country with extra roads, they are starting to make their own electricity, notably as solar road surface but then with added silent wind turbines, photovoltaic verges and barriers and more.

That toll gate, street light and traffic monitoring system all need electricity. Later, roads that deice and charge vehicles at speed will need huge amounts of electricity. For now, electricity for road systems is provided by very expensive infrastructure to the grid, and grid flexibility for EVs remains a concern, except for a few solar/ wind street lights in China and Korea for example. However, as more and more capabilities are added to roads instead of simply covering a country with extra roads, they are starting to make their own electricity, notably as solar road surface but then with added silent wind turbines, photovoltaic verges and barriers and more. There is also highly speculative work in the USA and UK on garnering power from road surface movement using piezoelectrics and electrodynamics and even its heat. 

#google#

China plans to create an intelligent transport system by 2030. The country hopes to build smart roads that will not only be able to charge electric cars as they drive but also monitor temperature, traffic flow and weight load using artificial intelligence. Indeed, like France, the Netherlands and the USA, where U.S. EV charging capacity is under scrutiny, it already has trials of extended lengths of solar road which cost no more than regular roads. In an alternative approach, vehicles go under tunnels of solar panels that also support lighting, light-emitting signage and monitoring equipment using the electricity made where it is needed. See the IDTechEx Research report, Electrically Smart Roads 2018-2028 for more.

Raghu Das, CEO of IDTechEx says, "The spiral vertical axis wind turbines VAWT in Asia rarely rotate because they are too low but much higher versions are planned on large UK roadside vehicle charging centres that should work well. H shaped VAWT is also gaining traction - much slower and quieter than the propeller shape which vibrates and keeps you awake at night in an urban area.

The price gap between the ubiquitous polycrystalline silicon solar cell and the much more efficient single crystal silicon is narrowing. That means that road furniture such as bus shelters and smart gantries will likely go for more solar rather than adding wind power in many cases, a shift mirrored by connected solar tech in homes, because wind power needs a lot of maintenance and its price is not dropping as rapidly."

The IDTechEx Research report, Off Grid Electric Vehicle Charging: Zero Emission 2018-2028 analyses that aspect, while vehicle-to-grid strategies may complement grid resources. The prototype of a smart road is already in place on an expressway outside of Jinan, providing better traffic updates as well as more accurate mapping. Verizon's IoT division has launched a project around intelligent asphalt, which it thinks has the potential to significantly reduce fossil fuel emissions and save time by reducing up to 44% of traffic backups. It has partnered with Sacramento, California, to test this theory.

"By embedding sensors into the pavement as well as installing cameras on traffic lights, we will be able to study and analyze the flow of traffic. Then, we will take all of that data and use it to optimize the timing of lights so that traffic flows easier and travel times are shorter," explains Sean Harrington, vice president of Verizon Smart Communities.

Colorado's Department of Transportation has recently announced its intention to be the first state to pilot smart roads by striking a five-year deal with a smart road company to test the technology. Like planned auto-deicing roads elsewhere, the aim of this project is, first and foremost, to save lives. The technology will detect when a car suddenly leaves a road and send emergency assistance to the area. The IDTechEx Research report Electrically Smart Roads 2018-2028 describes how others work on real time structural monitoring of roads and embedded interactive lighting and road surface signage.

"Smart pavement can make that determination and send that information directly into a vehicle," Peter Kozinski, director of CDOT's RoadX division, tells the Denver Post. "Data is the new asphalt of transportation."   Sensors, processors and other technology are embedded in the Colorado road to extend capability beyond accidents and reach into better road maintenance. Fast adoption relies on the ability to rapidly install sensor-laden pavement or lay concrete slabs. Attention therefore turns to fast adaptation of existing roads. Indeed, even for the heavy coil arrays used for dynamic vehicle charging, even as state power grids face new challenges, in Israel there are machines that can retrofit into the road surface at a remarkable two kilometres of cut and insert in a day.

"It's hard to imagine that these things are inexpensive, with all the electronics in them," Charles Schwartz, a professor of civil and environmental engineering at the University of Maryland, tells the Denver Post concerning the vehicle sensing project, "but CDOT is a fairly sophisticated agency, and this is an interesting pilot project. We can learn a lot, even if the test is only partially successful."


Related News

View more

Biggest offshore windfarm to start UK supply this week

Hornsea One Offshore Wind Farm delivers first power to the UK grid, scaling renewable energy with 1.2GW capacity, giant offshore turbines, and Yorkshire coast infrastructure to replace delayed nuclear and cut fossil fuel emissions.


Key Points

Hornsea One Offshore Wind Farm is a 1.2GW UK project delivering offshore renewable power to about 1 million homes.

✅ 174 turbines over 407 km2; Siemens Gamesa supply chain in the UK

✅ 1.2GW capacity can power ~1m homes; phases scale with 10MW+ turbines

✅ Supports UK grid, replaces delayed nuclear, cuts fossil generation


An offshore windfarm on the Yorkshire coast that will dwarf the world’s largest when completed is to supply its first power to the UK electricity grid this week, mirroring advances in tidal electricity projects delivering to the grid as well.

The Danish developer Ørsted, which has installed the first of 174 turbines at Hornsea One, said it was ready to step up its plans and fill the gap left by failed nuclear power schemes.

The size of the project takes the burgeoning offshore wind power sector to a new scale, on a par with conventional fossil fuel-fired power stations.

Hornsea One will cover 407 square kilometres, five times the size of the nearby city of Hull. At 1.2GW of capacity it will power 1m homes, making it about twice as powerful as today’s biggest offshore windfarm once it is completed in the second half of this year.

“The ability to generate clean electricity offshore at this scale is a globally significant milestone at a time when urgent action needs to be taken to tackle climate change,” said Matthew Wright, UK managing director of Ørsted, the world’s biggest offshore windfarm builder.

The power station is only the first of four planned in the area, with a green light and subsidies already awarded to a second stage due for completion in the early 2020s, and interest from Japanese utilities underscoring growing investor appetite.

The first two phases will use 7MW turbines, which are taller than London’s Gherkin building.

But the latter stages of the Hornsea development could use even more powerful, 10MW-plus turbines. Bigger turbines will capture more of the energy from the wind and should lower costs by reducing the number of foundations and amount of cabling firms need to put into the water, with developers noting that offshore wind can compete with gas in the U.S. as costs fall.

Henrik Poulsen, Ørsted’s chief executive, said he was in close dialogue with major manufacturers to use the new generation of turbines, some of which are expected to approach the height of the Shard in London, the tallest building in the EU.

The UK has a great wind resource and shallow enough seabed to exploit it, and could even “power most of Europe if it [the UK] went to the extreme with offshore”, he said.

Offshore windfarms could help ministers fill the low carbon power gap created by Hitachi and Toshiba scrapping nuclear plants, the executive suggested. “If nuclear should play less of a role than expected, I believe offshore wind can step up,” he said.

New nuclear projects in Europe had been “dramatically delayed and over budget”, he added, in comparison to “the strong track record for delivering offshore [wind]”.

The UK and Germany installed 85% of new offshore wind power capacity in the EU last year, according to industry data, with wind leading power across several markets. The average power rating of the turbines is getting bigger too, up 15% in 2018.

The turbines for Hornsea One are built and shipped from Siemens Gamesa’s factory in Hull, part of a web of UK-based suppliers that has sprung up around the growing sector, such as Prysmian UK's land cables supporting grid connections.

Around half of the project’s transition pieces, the yellow part of the structure that connects the foundation to the tower, are made in Teeside. Many of the towers themselves are made by a firm in Campbeltown in the Scottish highlands. Altogether, about half of the components for the project are made in the UK.

Ørsted is not yet ready to bid for a share of a £60m pot of further offshore windfarm subsidies, to be auctioned by the government this summer, but expects the price to reach even more competitive levels than those seen in 2017.

Like other international energy companies, Ørsted has put in place contingency planning in event of a no-deal Brexit – but the hope is that will not come to pass. “We want a Brexit deal that will facilitate an orderly transition out of the union,” said Poulsen.


Related News

View more

Sign Up for Electricity Forum’s Newsletter

Stay informed with our FREE Newsletter — get the latest news, breakthrough technologies, and expert insights, delivered straight to your inbox.

Electricity Today T&D Magazine Subscribe for FREE

Stay informed with the latest T&D policies and technologies.
  • Timely insights from industry experts
  • Practical solutions T&D engineers
  • Free access to every issue

Live Online & In-person Group Training

Advantages To Instructor-Led Training – Instructor-Led Course, Customized Training, Multiple Locations, Economical, CEU Credits, Course Discounts.

Request For Quotation

Whether you would prefer Live Online or In-Person instruction, our electrical training courses can be tailored to meet your company's specific requirements and delivered to your employees in one location or at various locations.