Regulations crafted for wind-power turbines

By McClatchy Tribune News


Substation Relay Protection Training

Our customized live online or in‑person group training can be delivered to your staff at your location.

  • Live Online
  • 12 hours Instructor-led
  • Group Training Available
Regular Price:
$699
Coupon Price:
$599
Reserve Your Seat Today
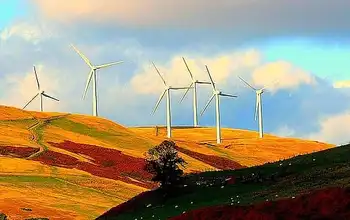
Local governments in western Virginia are beginning to craft land-use regulations to give them tighter control over where wind turbines could be built, even as energy companies study the area's potential for large wind farms.

Mountainous Bland and Bath counties are looking to develop ordinances governing wind turbines. Giles County, meanwhile, recently created a permit process that allows farmers and landowners to build and operate single turbines; but the permit process doe not open the door wider for commercial wind farms.

The permit process is similar to ones adopted by Pulaski and Rockingham counties. The activity in Bland and Bath comes less than three months after the State Corporation Commission approved a 19-turbine wind farm in Highland County, a controversial, $60 million project that could begin construction next year.

"They want to get the larger ordinances in place so they can prepare for the arrival of developers," said James Madison University professor Jonathan Miles, founder of the Virginia Wind Energy Collaborative. Five or six energy companies are quietly examining the ridgelines of western Virginia for suitable wind-farm sites, said Miles, a proponent of wind-generated power.

Miles is working to create a "scoring system" to help counties determine which sites are most suited for wind farms and which are least suited. The system would factor in such things as wind constancy, the ease with which a site could be connected to the electric grid, roads, proximity to federal lands, environmental conflicts and impacts on cultural and historical resources.

"We want to know, where do we want them, and where do we definitely not want them," said Sherry Ryder, Bath's county planner and zoning administrator, adding that the county hopes to use Miles' system as a planning tool. Ryder said the county hopes to have public hearings as early as this summer on the new rules.

Jonathan Sweet, county administrator in Bland, said he is already at work to add wind-farm language to the county land-use regulations, and he wants energy companies to know the language is not intended to discourage them.

"We're going to look at ways to embrace it, if the local leadership feels wind farms are a positive addition to the county," said Sweet, adding that he has been contacted by a representative of an energy company.

"We'd like to make sure we get as much bang for the buck and minimize damage. We have some pretty good winds here in the county."

Wind farms of a size similar to the one approved in Highland could potentially pump hundreds of thousands of dollars in tax revenue into the county each year. The prospect of more money did not persuade Patrick County officials to embrace wind farms. Last year, amid hue and cry from landowners after a Pennsylvania company's proposal to build 20 giant turbines several hundred feet high in Patrick, county supervisors adopted an ordinance banning structures of more than 100 feet high.

The company dropped its proposal.

In Giles, which has fielded several inquiries from energy companies, according to zoning administrator Craig Whittaker, the county's current ordinances require energy companies to obtain a special exception to build a wind farm. That would require public hearings, a planning commission recommendation and final approval by the Board of Supervisors.

County officials, he said, believe the rules give them control over the landscape without outrightly prohibiting wind farms.

"They're not going to put up a banner and say, come and put up a wind farm," Whittaker said, "but they're not slamming the door on it either."

Related News

Lack of energy: Ottawa’s electricity consumption drops 10 per cent during pandemic

Ottawa Electricity Consumption Drop reflects COVID-19 impacts, with Hydro Ottawa and IESO reporting 10-12% lower demand, delayed morning peaks, and shifted weekend peak to 4 p.m., alongside provincial time-of-use rate relief.


Key Points

A 10-12% decline in Ottawa's electricity demand during COVID-19, with later morning peaks and weekend peak at 4 p.m.

✅ Weekday demand down 11%; weekends down 10% vs April 2019.

✅ Morning peak delayed about 4 hours; 6 a.m. usage down 17%.

✅ Weekend peak moved from 7 p.m. to 4 p.m.; rate relief ongoing.


Ottawa residents may be spending more time at home, with residential electricity use up even as the city’s overall energy use has dropped during the COVID-19 pandemic.

Hydro Ottawa says there was a 10-to-11 per cent drop in electricity consumption in April, with the biggest decline in electricity usage happening early in the morning, a pattern echoed by BC Hydro findings in its province.

Statistics provided to CTV News Ottawa show average hourly energy consumption in the City of Ottawa dropped 11 per cent during weekdays, mirroring Manitoba Hydro trends reported during the pandemic, and a 10 per cent decline in electricity consumption on weekends.

The drop in energy consumption came as many businesses in Ottawa closed their doors due to the COVID-19 measures and physical distancing guidelines.

“Based on our internal analysis, when comparing April 2020 to April 2019, Hydro Ottawa observed a lower, flatter rise in energy use in the morning, with peak demand delayed by approximately four hours.” Hydro Ottawa said in a statement to CTV News Ottawa.

“Morning routines appear to have the largest difference in energy consumption, most likely as a result of a collective slower pace to start the day as people are staying home.”

Hydro Ottawa says overall, there was an 11 per cent average hourly reduction in energy use on weekdays in April 2020, compared to April 2019. The biggest difference was the 6 a.m. hour, with a 17 per cent decrease.

On weekends, the average electricity usage dropped 10 per cent in April, compared to April 2019. The biggest difference was between 7 a.m. and 8 a.m., with a 13 per cent drop in hydro usage.

Hydro Ottawa says weekday peak continues to be at 4 p.m., while on weekends the peak has shifted from 7 p.m. before the pandemic to 4 p.m. now, though Hydro One has not cut peak rates for self-isolating customers.

The Independent Electricity System Operator says across Ontario, there has been a 10 to 12 per cent drop in energy consumption during the pandemic, a trend reflected in province-wide demand data that is the equivalent to half the demand of Toronto.

The Ontario Government has provided emergency electricity rate relief during the COVID-19 pandemic. Residential and small business consumers on time-of-use pricing, and later ultra-low overnight options, will continue to pay one price no matter what time of day the electricity is consumed until the end of May.


Related News

View more

U.S. Electricity Sales Projections Continue to Fall

US Electricity Demand Outlook examines EIA forecasts, GDP decoupling, energy efficiency, electrification, electric vehicles, grid load growth, and weather variability to frame long term demand trends and utility planning scenarios.


Key Points

An analysis of EIA projections showing demand decoupling from GDP, with EV adoption and efficiency shaping future grid load.

✅ EIA lowers load growth; demand decouples from GDP.

✅ Efficiency and sector shifts depress kWh sales.

✅ EV adoption could revive load and capacity needs.


Electricity producers and distributors are in an unusual business. The product they provide is available to all customers instantaneously, literally at the flip of a switch. But the large amount of equipment, both hardware and software to do this takes years to design, site and install.

From a long range planning perspective, just as important as a good engineering design is an accurate sales projections. For the US electric utility industry the most authoritative electricity demand projec-tions come from the Department of Energy’s Energy Information Administration (EIA). EIA's compre-hensive reports combine econometric analysis with judgment calls on social and economic trends like the adoption rate of new technologies that could affect future electricity demand, things like LED light-ing and battery powered cars, and the rise of renewables overtaking coal in generation.

Before the Great Recession almost a decade ago, the EIA projected annual growth in US electricity production at roughly 1.5 percent per year. After the Great Recession began, the EIA lowered its projections of US electricity consumption growth to below 1 percent. Actual growth has been closer to zero. While the EIA did not antici-pate the last recession or its aftermath, we cannot fault them on that.

After the event, though, the EIA also trimmed its estimates of economic growth. For the 2015-2030 period it now predicts 2.1 percent economic and 0.3 percent electricity growth, down from previously projections of 2.7 percent and 1.3 percent respectively. (See Figures 1 and 2.)


Table 1. EIA electric generation projections by year of forecast (kWh billions)


Table 2. EIA forecast of GDP by year of forecast (billion 2009 $)

Back in 2007, the EIA figured that every one percent increase in economic activity required a 0.48 percent in-crease in electric generation to support it. By 2017, the EIA calculated that a 1 percent growth in economic activity now only required a 0.14 percent increase in electric output. What accounts for such a downgrade or disconnect between electricity usage and economic growth? And what factors might turn the numbers 
around?

First, the US economy lost energy intensive heavy industry like smelting, steel mills and refineries; patterns in China's electricity sector highlight how industrial shifts can reshape power demand. A more service oriented economy (think health care) relies more heavily on the movement of data or information and uses far less power than a manufacturing-oriented economy.

A small volcano in Argentina is about to fuel the next tech boom – and a little known company is going to be right at the center. Early investors stand to gain incredible profits and you can too. Read the report.

Second, internet shopping has hurt so-called "brick and mortar" retailers. Despite the departure of heavy industry, in years past a burgeoning US commercial sector increased its demand and usage of electricity to offset the industrial decline. But not anymore. Energy efficiency measures as well as per-haps greater concern about global warming and greenhouse gas emissions and have cut into electricity sales. “Do more with less” has the right ring to it.

But there may be other components to the ongoing decline in electricity usage. Academic studies show that electricity usage seems to increase with income along an S curve, and flattens out after a certain income level. That is, if you earn $1 billion per year you do not (or cannot) use ten times a much electricity as someone earning only $100 million.

But people at typical, middle income levels increase or decrease electricity usage when incomes rise or fall. The squeeze on middle income families was discussed often in the late presidential campaign. In recent decades an increasing percentage of income has gone to a small percentage of the population at the top of the income scale. This trend probably accounts for some weakness in residential sales. This suggests that government policy addressing income inequality would also boost electricity sales.

Population growth affects demand for electricity as well as the economy as a whole. The EIA has made few changes in its projections, showing 0.7 percent per year population growth in 2015- 2030 in both the 2007 and 2017 forecasts. Recent studies, however, have shown a drop in the birth rate to record lows. More troubling, from a national health perspective is that the average age of death may have stopped rising. Those two factors point to lower population growth, especially if the government also restricts immi-gration. Thus, the US may be approaching a period of rather modest population growth.

All of the above factors point to minimal sales growth for electricity producers in the US--perhaps even lower than the seemingly conservative EIA estimates. But the cloud on the horizon has a silver lining in the shape of an electric car. Both the United Kingdom and France have set dates to end of production of automobiles with internal combustion engines. Several European car makers have declared that 20 percent of their output will be electric vehicles by the early 2020s. If we adopt automobiles powered by electricity and not gasoline or diesel, electricity sales would increase by one third. For the power indus-try, electric vehicles represent the next big thing.

We don’t pretend to know how electric car sales will progress. But assume vehicle turnover rates re-main at the current 7 percent per year and electric cars account for 5 percent of sales in the first five years (as op-posed to 1 percent now), 20 percent in the next five years and 50 percent in the third five year period. Wildly optimistic assumptions? Maybe. By 2030, electric cars would constitute 28 percent of the vehicle fleet. They would add about 10 percent to kilowatt hour sales by that date, assuming that battery efficiencies do not improved by then. Those added sales would require increased electric generation output, with low-emissions sources expected to cover almost all the growth globally. They would also raise long term growth rates for 2015-2030 from the present 0.3 percent to 1.0 percent. The slow upturn in demand should give the electric companies time to gear up so to speak.

In the meantime, weather will continue to play a big role in electricity consumption. Record heat-induced demand peaks are being set here in the US even as surging global demand puts power systems under strain worldwide.

Can we discern a pattern in weather conditions 15 years out? Maybe we can, but that is one topic we don’t expect a government agency to tackle in public right now. Meantime, weather will affect sales more than anything else and we cannot predict the weather. Or can we?


Related News

View more

UK Anticipates a 16% Decrease in Energy Bills in April

UK Energy Price Cap Cut 2024 signals relief as wholesale gas prices fall; Ofgem price cap drops per Cornwall Insight, aided by LNG supply, mild winter, despite Red Sea tensions and Ukraine conflict impacts.


Key Points

A forecast cut to Great Britain's Ofgem price cap as wholesale gas falls, easing typical annual household bills in 2024.

✅ Cap falls from £1,928 to £1,620 in April 2024

✅ Forecast £1,497 in July, then about £1,541 from October

✅ Drivers: lower wholesale gas, LNG supply, mild winter


Households in Great Britain are set to experience a significant reduction in energy costs this spring, with bills projected to drop by over £300 annually. This decrease is primarily due to a decline in wholesale gas prices, offering some respite to those grappling with the cost of living crisis.

Cornwall Insight, a well-regarded industry analyst, predicts a 16% reduction in average bills from the previous quarter, potentially reaching the lowest levels since the onset of the Ukraine conflict.

The industry’s price cap, indicative of the average annual bill for a typical household, is expected to decrease from the current £1,928, set earlier this month, to £1,620 in April – a reduction of £308 and £40 less than previously forecasted in December, as ministers consider ending the gas-electricity price link to improve market resilience.

Concerns about escalating tensions in the Red Sea, where Houthi rebels have disrupted global shipping, initially led analysts to fear an increase in wholesale oil prices and subsequent impact on household energy costs.

Contrary to these concerns, oil prices have remained relatively stable, and European gas reserves have been higher than anticipated during a mild winter, with European gas prices returning to pre-Ukraine war levels since November.

Cornwall Insight anticipates that energy prices will continue to be comparatively low through 2024. They predict a further decline to £1,497 for a typical annual bill from July, followed by a slight increase to £1,541 starting in October.

This forecast is a welcome development for Britons who have been dealing with increased expenses across various sectors, from food to utilities, amidst persistently high inflation rates, with energy-driven EU inflation hitting lower-income households hardest across member states.

Energy bills saw a steep rise in 2021, which escalated further due to the Ukraine conflict in 2022, driving up wholesale gas prices. This surge prompted government intervention to subsidize bills, with the UK price cap estimated to cost around £89bn to the public purse, capping costs to a typical household at £2,500.

Cornwall Insight noted that the supply of liquified natural gas to Europe had not been as adversely affected by the Red Sea disruptions as initially feared. Moreover, the UK has been well-supplied with gas from the US, which has become a more significant supplier since the Ukraine war, even as US electricity prices have risen to multi-decade highs. Contributing factors also include lower gas prices in Asia, mild weather, and robust gas availability.

Craig Lowrey, a principal consultant at Cornwall Insight, remarked that concerns about Red Sea events driving up energy prices have not materialized, allowing households to expect a reduction in prices.

On Monday, the next-month wholesale gas price dropped by 4% to 65p a therm.

However, Lowrey cautioned that a complete return to pre-crisis energy bill levels remains unlikely due to ongoing market impacts from shifting away from Russian energy sources and persistent geopolitical tensions, as well as policy changes such as Britain’s Energy Security Bill shaping market reforms.

Richard Neudegg, director of regulation at Uswitch, welcomed the potential further reduction of the price cap in April. However, he pointed out that this offers little solace to households currently struggling with high winter energy costs during the winter. Neudegg urged Ofgem, the energy regulator, to prompt suppliers to reintroduce more competitive and affordable fixed-price deals.


Related News

View more

Rising Electricity Prices: Inflation, Climate Change, and Clean Energy Challenges

Rising Electricity Prices are driven by inflation, climate change, and the clean energy transition, affecting energy bills, grid resilience, and supply. Renewables, storage, and infrastructure upgrades shape costs, volatility, and long-term sustainability.


Key Points

Rising electricity prices stem from inflation, climate risk, and costs of integrating clean energy and storage into modern grids.

✅ Inflation raises fuel, materials, and labor costs for utilities

✅ Extreme weather damages infrastructure and strains peak demand

✅ Clean energy rollout needs storage, backup, and grid upgrades


In recent months, consumers have been grappling with a concerning trend: rising electricity prices across the country. This increase is not merely a fluctuation but a complex issue shaped by a confluence of factors including inflation, climate change, and the transition to clean energy. Understanding these dynamics is crucial for navigating the current energy landscape and preparing for its future.

Inflation and Its Impact on Energy Costs

Inflation, the economic phenomenon of rising prices across various sectors, has significantly impacted the cost of living, including electricity and natural gas prices for households. As the price of goods and services increases, so too does the cost of producing and delivering electricity. Energy production relies heavily on raw materials, such as metals and fuels, whose prices have surged in recent years. For instance, the costs associated with mining, transporting, and refining these materials have risen, thereby increasing the operational expenses for power plants.

Moreover, inflation affects labor costs, as wages often need to keep pace with the rising cost of living. As utility companies face higher expenses for both materials and labor, these costs are inevitably passed on to consumers in the form of higher electricity bills.

Climate Change and Energy Supply Disruptions

Climate change also plays a significant role in driving up electricity prices. Extreme weather events, such as hurricanes, heatwaves, and floods, have become more frequent and severe due to climate change. These events disrupt energy production and distribution by damaging infrastructure, impeding transportation, and affecting the availability of resources.

For example, hurricanes can knock out power plants and damage transmission lines, leading to shortages and higher costs. During periods of extreme summer heat across many regions, heatwaves can strain the power grid as increased demand for air conditioning pushes the system to its limits. Such disruptions not only lead to higher immediate costs but also necessitate costly repairs and infrastructure upgrades.

Additionally, the increasing frequency of natural disasters forces utilities to invest in more resilient infrastructure, as many utilities spend more on delivery to harden grids and reduce outages, which adds to overall costs. These investments, while necessary for long-term reliability, contribute to short-term price increases for consumers.

The Transition to Clean Energy

The shift towards clean energy is another pivotal factor influencing electricity prices. While renewable energy sources like wind, solar, and hydro power are crucial for reducing greenhouse gas emissions and combating climate change, their integration into the existing grid presents challenges.

Renewable energy infrastructure requires substantial initial investment. The construction of wind farms, solar panels, and the associated grid improvements involve significant capital expenditure. These upfront costs are often reflected in electricity prices. Moreover, renewable energy sources can be intermittent, meaning they do not always produce electricity at times of high demand. This intermittency necessitates the development of energy storage solutions and backup systems, which further adds to the costs.

Utilities are also transitioning from fossil fuel-based energy production to cleaner alternatives, a process that involves both technological and operational shifts and intersects with the broader energy crisis impacts on electricity, gas, and EVs nationwide. These changes can temporarily increase costs as utilities phase out old systems and implement new ones. While the long-term benefits of cleaner energy include environmental sustainability and potentially lower operating costs, the transition period can be financially burdensome for consumers.

The Path Forward

Addressing rising electricity prices requires a multifaceted approach. Policymakers must balance the need for immediate relief, as California regulators face calls for action amid soaring bills, with the long-term goals of sustainability and resilience. Investments in energy efficiency can help reduce overall demand and ease pressure on the grid. Expanding and modernizing energy infrastructure to accommodate renewable sources can also mitigate price volatility.

Additionally, efforts to mitigate climate change through improved resilience and adaptive measures can reduce the frequency and impact of extreme weather events, thereby stabilizing energy costs.

Consumer education is vital in this process. Understanding the factors driving electricity prices can empower individuals to make informed decisions about energy consumption and conservation. Furthermore, exploring energy-efficient appliances and practices can help manage costs in the face of rising prices.

In summary, the rising cost of electricity is a multifaceted issue influenced by inflation, climate change, and the transition to clean energy, and recent developments show Germany's rising energy costs in the coming year. While these factors pose significant challenges, they also offer opportunities for innovation and improvement in how we produce, distribute, and consume energy. By addressing these issues with a balanced approach, it is possible to navigate the complexities of rising electricity prices while working towards a more sustainable and resilient energy future.


Related News

View more

Scottish Wind Delivers Equivalent Of 98% Of Country’s October Electricity Demand

Scotland Wind Energy October saw renewables supply the equivalent of 98 percent of electricity demand, as onshore wind outpaced National Grid needs, cutting emissions and powering households, per WWF Scotland and WeatherEnergy.


Key Points

A monthly update showing Scottish onshore wind met the equivalent of 98% of electricity demand in October.

✅ 98% of monthly electricity demand equivalent met by wind

✅ 16 days exceeded total national demand, per data

✅ WWF Scotland and WeatherEnergy cited; lower emissions


New figures publicized by WWF Scotland have revealed that wind energy generated the equivalent of 98% of the country’s electricity demand in October, or enough electricity to power millions of Scottish homes across the country.

Scotland has regularly been highlighted as a global wind energy leader, and over the last few years has repeatedly reported record-breaking months for wind generation. Now, it’s all very well and good to say that Scottish wind delivered 98% of the country’s electricity demand, but the specifics are a little different — hence why WWF Scotland always refers to it as wind providing “the equivalent of 98%” of Scotland’s electricity demand. That’s why it’s worth looking at the statistics provided by WWF Scotland, sourced from WeatherEnergy, part of the European EnergizAIR project:

  • National Grid demand for the month – 1,850,512 MWh
  • What % of this could have been provided by wind power across Scotland – 98%
  • Best day – 23rd October 2018, generation was 105,900.94 MWh, powering 8.72m homes, 356% of households. Demand that day was 45,274.5MWh – wind generation was 234% of that.
  • Worst day – 18th October 2018 when generation was 18,377.71MWh powering 1,512,568 homes, 62% of households. Demand that day was 73,628.5MWh – wind generation was 25%
  • How many days generation was over 100% of households – 27
  • How many days generation was over 100% of demand – 16

“What a month October proved to be, with wind powering on average 98 per cent of Scotland’s entire electricity demand for the month, at a time when wind became the UK’s main power source and exceeding our total demand for a staggering 16 out of 31 days,” said Dr Sam Gardner, acting director at WWF Scotland.

“These figures clearly show wind is working, it’s helping reduce our emissions and is the lowest cost form of new power generation. It’s also popular, with a recent survey also showing more and more people support turbines in rural areas. That’s why it’s essential that the UK Government unlocks market access for onshore wind at a time when we need to be scaling up electrification of heat and transport.”

Alex Wilcox Brooke, Weather Energy Project Manager at Severn Wye Energy Agency, added: “Octobers figures are a prime example of how reliable & consistent wind production can be, with production on 16 days outstripping national demand.”


Related News

View more

UK peak power prices rise to second highest level since 2018

UK Peak Power Prices surged as low wind speeds forced National Grid to rely on gas-fired plants and coal generation, amid soaring wholesale gas prices and weak wind generation during the energy crisis.


Key Points

UK Peak Power Prices are electricity costs at peak hours, driven by wind output, gas reliance, and market dynamics.

✅ Spikes when wind generation drops and demand rises.

✅ Driven by gas-fired plants, coal backup, and wholesale gas prices.

✅ Moderate as wind output recovers and interconnectors supply.


Low wind speeds pushed peak hour power prices to the second highest level for at least three years on Monday, a move consistent with UK electricity prices hitting a 10-year high earlier this year, as Britain’s grid was forced to increase its reliance on gas-fired power plants and draw on coal generation.

Calm weather this year has exacerbated the energy price crisis in the UK, as gas-fired power stations have had to pick up the slack from wind farms. Energy demand has surged as countries open up from pandemic restrictions, which together with lower supplies from Russia to western Europe, has sent wholesale gas prices soaring.

Power prices in the UK for the peak evening period between 5pm and 6pm on Monday surpassed £2,000 per megawatt hour, only the second time they have exceeded that level in recent years.

This was still below the levels reached at the height of the gas price crisis in mid-September, when they hit £2,500/MWh, according to the energy consultancy Cornwall Insight, whose records date back to 2018.

Low wind speeds were the main driver behind Monday’s price spike, although expectations of a pick-up in wind generation on Tuesday, after recent record wind generation days, should push them back down to similar levels seen in recent weeks, analysts said.

Despite the expansion of renewables, such as wind and solar, over the past decade, with instances of wind leading the power mix in recent months, gas remains the single biggest source of electricity generation in Britain, typically accounting for nearly 40 per cent of output.

At lunchtime on Monday, gas-fired power plants were producing nearly 55 per cent of electricity, while coal accounted for 3 per cent, reflecting more power from wind than coal in 2016 milestones. Britain’s wind farms were contributing 1.67 gigawatts or just over 4 per cent, according to data from the Drax Electrics Insights website. Over the past 12 months, wind farms have produced 21 per cent of the UK’s electricity on average.

National Grid, which manages the UK’s electricity grid, has been forced on a number of occasions in recent months to ask coal plants to fire up to help offset the loss of wind generation, after issuing a National Grid short supply warning to the market. The government announced in June that it planned to bring forward the closure of the remaining coal stations to the end of September 2024.

Ministers also committed this year to making Britain’s electricity grid “net zero carbon” by 2035, and milestones such as when wind was the main source underline the transition, although some analysts have pointed out that would not signal the end of gas generation.

Since the start of the energy crisis in August, 20 energy suppliers have gone bust as they have struggled to secure the electricity and gas needed to supply customers at record wholesale prices, with further failures expected in coming weeks.

Phil Hewitt, director of the consultancy EnAppSys, said Monday’s high prices would further exacerbate pressures on those energy suppliers that do not have adequate hedging strategies. “This winter is a good time to be a generator,” he added.

Energy companies including Orsted of Denmark and SSE of the UK have reported some of the lowest wind speeds for at least two decades this year, even though record output during Storm Malik highlighted the system's volatility.

According to weather modelling group Vortex, the strength of the wind blowing across northern Europe has fallen by as much as 15 per cent on average in places this year, which some scientists suggest could be due to climate change.


Related News

View more

Sign Up for Electricity Forum’s Newsletter

Stay informed with our FREE Newsletter — get the latest news, breakthrough technologies, and expert insights, delivered straight to your inbox.

Electricity Today T&D Magazine Subscribe for FREE

Stay informed with the latest T&D policies and technologies.
  • Timely insights from industry experts
  • Practical solutions T&D engineers
  • Free access to every issue

Live Online & In-person Group Training

Advantages To Instructor-Led Training – Instructor-Led Course, Customized Training, Multiple Locations, Economical, CEU Credits, Course Discounts.

Request For Quotation

Whether you would prefer Live Online or In-Person instruction, our electrical training courses can be tailored to meet your company's specific requirements and delivered to your employees in one location or at various locations.