Iran, Iraq Discuss Further Cooperation in Energy Sector


Iran, Iraq Discuss Further Cooperation in Energy Sector

High Voltage Maintenance Training Online

Our customized live online or in‑person group training can be delivered to your staff at your location.

  • Live Online
  • 12 hours Instructor-led
  • Group Training Available
Regular Price:
$599
Coupon Price:
$499
Reserve Your Seat Today

Iran-Iraq Electricity Cooperation advances with power grid synchronization, cross-border energy trade, 400-kV transmission lines, and education partnerships, boosting grid reliability, infrastructure investment, and electricity exports between Tehran and Baghdad for improved supply and stability.


Key Points

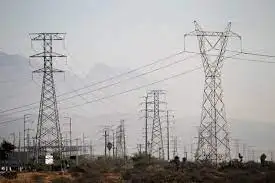
A bilateral initiative to synchronize grids, expand networks, and sustain electricity exports, improving reliability.
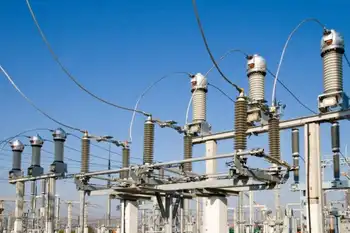
✅ 400-kV Amarah-Karkheh line enables synchronized operations.

✅ Extends electricity export contracts to meet Iraq demand.

✅ Enhances grid reliability, training, and infrastructure investment.


Aradakanian has focused his one-day visit to Iraq on discussions pertaining to promoting bilateral collaboration between the two neighboring nations in the field of electricity, grid development deals and synchronizing power grid between Tehran and Baghdad, cooperating in education, and expansion of power networks.

He is also scheduled to meet with Iraqi top officials in a bid to boost cooperation in the relevant fields.

Back in December 2019, Ardakanian announced that Iran will continue exports of electricity to Iraq by renewing earlier contract as it is supplying about 40% of Iraq's power today.

"Iran has signed a 3-year-long cooperation agreement with Iraq to help the country's power industry in different aspects. The documents states at its end that we will export electricity to Iraq as far as they need," Ardakanian told FNA on December 9, 2019.

The contract to "export Iran's electricity" to Iraq will be extended, he added.

Ardakanian also said that Iran and Iraq's power grids have become synchronized in a move that supports Iran's regional power hub plans since a month ago.

In 2004 Iran started selling electricity to Iraq. Iran electricity exports to the western neighbor are at its highest level of 1,361 megawatts per day now, as the country weighs summer power sufficiency ahead of peak demand.

The new Amarah-Karkheh 400-KV transmission line stretching over 73 kilometers, is now synchronized to provide electricity to both countries, reflecting regional power export trends as well. It also paves the way for increasing export to power-hungry Iraq in the near future.

With synchronization of the two grids, the quality of electricity in Iraq will improve as the country explores nuclear power options to tackle shortages.

According to official data, 82% of Iraq's electricity is generated by thermal power plants that use gas as feedstock, while Iran is converting thermal plants to combined cycle to save energy. This is expected to reach 84% by 2027.


Related News

Related News

Investor: Hydro One has too many unknowns to be a good investment

Hydro One investment risk reflects Ontario government influence, board shakeup, Avista acquisition uncertainty, regulatory hearings, dividend growth prospects, and utility M&A moves in Peterborough, with stock volatility since the 2015 IPO.


Key Points

Hydro One investment risk stems from political control, governance turnover, regulatory outcomes, and uncertain M&A.

✅ Ontario retains near-50% stake, affecting autonomy and policy risk

✅ Board overhaul and CEO exit create governance uncertainty

✅ Avista deal, OEB hearings, local utility M&A drive outcomes


Hydro One may be only half-owned by the province on Ontario but that’s enough to cause uncertainty about the company’s future, thus making for an investment risk, says Douglas Kee of Leon Frazer & Associates.

Since its IPO in November of 2015, Hydro One has seen its share of ups and downs, including a Q2 profit decline earlier this year, mostly downs at this point. Currently trading at $19.87, the stock has lost 11 per cent of its value in 2018 and 12 per cent over the last 12 months, despite a one-time gain boosting Q2 profit that followed a court ruling.

This year has been a turbulent one, to say the least, as newly elected Ontario premier Doug Ford made good this summer on his campaign promise re Hydro One by forcing the resignation of the company’s 14-person board of directors along with the retirement of its chief executive, an event that saw Hydro One shares fall amid the turmoil. An interim CEO has been found and a new 10-person board and chairman put in place, but Kee says it’s unclear what impact the shakeup will ultimately have, other than delaying a promising-looking deal to purchase US utility Avista Corp, with the companies moving to ask the U.S. regulator to reconsider the order.


Douglas Kee’s take on Hydro One stock

“We looked at Hydro One a couple of times two years ago and just decided that with the Ontario government’s still owning a big chunk of the company … there are other public companies where you get the same kind of yield, the same kind of dividend growth, so we just avoided it,” says Kee, managing director and chief investment officer with Leon Frazer & Associates, to BNN Bloomberg.

“The old board versus the new board, I’m not sure that there’s much of an improvement. It was politics more than anything,” he says. “The unfortunate part is that the acquisition they were making in the United States is kind of on hold for now. The regulatory procedures have gone ahead but they are worried, and I guess the new board has to make a decision whether to go ahead with it or not.”

“Their transmissions side is coming up for regulatory hearings next year, which could be difficult in Ontario,” says Kee. “The offset to that is that there are a lot of municipal distributions systems in Ontario that may be sold — they bought one in Peterborough recently, which was a good deal for them. There may be more of that coming too.”

Last month, Hydro One reached an agreement with the City of Peterborough to buy its Peterborough Distribution utility which serves about 37,000 customers for $105 million. Another deal to purchase Orillia Power Distribution Corp for $41 million has been cancelled after an appeal to the Ontario Energy Board was denied in late August. Hydro One’s sought-after Avista Corp acquisition is reported to be worth $7 billion.


Related News

View more

Hydropower Plants to Support Solar and Wind Energy

Solar-Wind-Water West Africa integrates hydropower with solar and wind to boost grid flexibility, clean electricity, and decarbonization, leveraging the West African Power Pool and climate data modeling reported in Nature Sustainability.


Key Points

A strategy using hydropower to balance solar and wind, enabling reliable, low-carbon electricity across West Africa.

✅ Hydropower dispatch covers solar and wind shortfalls.

✅ Regional interconnection via West African Power Pool.

✅ Cuts CO2 versus gas while limiting new dam projects.


Hydropower plants can support solar and wind power, rather unpredictable by nature, in a climate-friendly manner. A new study in the scientific journal Nature Sustainability has now mapped the potential for such "solar-wind-water" strategies for West Africa: an important region where the power sector is still under development, amid IEA investment needs for universal access, and where generation capacity and power grids will be greatly expanded in the coming years. "Countries in West Africa therefore now have the opportunity to plan this expansion according to strategies that rely on modern, climate-friendly energy generation," says Sebastian Sterl, energy and climate scientist at Vrije Universiteit Brussel and KU Leuven and lead author of the study. "A completely different situation from Europe, where power supply has been dependent on polluting power plants for many decades - which many countries now want to rid themselves of."

Solar and wind power generation is increasing worldwide and becoming cheaper and cheaper. This helps to keep climate targets in sight, but also poses challenges. For instance, critics often argue that these energy sources are too unpredictable and variable to be part of a reliable electricity mix on a large scale, though combining multiple resources can enhance project performance.

"Indeed, our electricity systems will have to become much more flexible if we are to feed large amounts of solar and wind power into the grid. Flexibility is currently mostly provided by gas power plants. Unfortunately, these cause a lot of CO2 emissions," says Sebastian Sterl, energy and climate expert at Vrije Universiteit Brussel (VUB) and KU Leuven. "But in many countries, hydropower plants can be a fossil fuel-free alternative to support solar and wind energy. After all, hydropower plants can be dispatched at times when insufficient solar and wind power is available."

The research team, composed of experts from VUB, KU Leuven, the International Renewable Energy Agency (IRENA), and Climate Analytics, designed a new computer model for their study, running on detailed water, weather and climate data. They used this model to investigate how renewable power sources in West Africa could be exploited as effectively as possible for a reliable power supply, even without large-scale storage, in line with World Bank support for wind in developing countries. All this without losing sight of the environmental impact of large hydropower plants.

"This is far from trivial to calculate," says Prof. Wim Thiery, climate scientist at the VUB, who was also involved in the study. "Hydroelectric power stations in West Africa depend on the monsoon; in the dry season they run on their reserves. Both sun and wind, as well as power requirements, have their own typical hourly, daily and seasonal patterns. Solar, wind and hydropower all vary from year to year and may be impacted by climate change, including projections that wind resources shift southward in coming years. In addition, their potential is spatially very unevenly distributed."

West African Power Pool

The study demonstrates that it will be particularly important to create a "West African Power Pool", a regional interconnection of national power grids to serve as a path to universal electricity access across the region. Countries with a tropical climate, such as Ghana and the Ivory Coast, typically have a lot of potential for hydropower and quite high solar radiation, but hardly any wind. The drier and more desert-like countries, such as Senegal and Niger, hardly have any opportunities for hydropower, but receive more sunlight and more wind. The potential for reliable, clean power generation based on solar and wind power, supported by flexibly dispatched hydropower, increases by more than 30% when countries can share their potential regionally, the researchers discovered.

All measures taken together would allow roughly 60% of the current electricity demand in West Africa to be met with complementary renewable sources, despite concerns about slow greening of Africa's electricity, of which roughly half would be solar and wind power and the other half hydropower - without the need for large-scale battery or other storage plants. According to the study, within a few years, the cost of solar and wind power generation in West Africa is also expected to drop to such an extent that the proposed solar-wind-water strategies will provide cheaper electricity than gas-fired power plants, which currently still account for more than half of all electricity supply in West Africa.

Better ecological footprint

Hydropower plants can have a considerable negative impact on local ecology. In many developing countries, piles of controversial plans for new hydropower plants have been proposed. The study can help to make future investments in hydropower more sustainable. "By using existing and planned hydropower plants as optimally as possible to massively support solar and wind energy, one can at the same time make certain new dams superfluous," says Sterl. "This way two birds can be caught with one stone. Simultaneously, one avoids CO2 emissions from gas-fired power stations and the environmental impact of hydropower overexploitation."

Global relevance

The methods developed for the study are easily transferable to other regions, and the research has worldwide relevance, as shown by a US 80% study on high variable renewable shares. Sterl: "Nearly all regions with a lot of hydropower, or hydropower potential, could use it to compensate shortfalls in solar and wind power." Various European countries, with Norway at the front, have shown increased interest in recent years to deploy their hydropower to support solar and wind power in EU countries. Exporting Norwegian hydropower during times when other countries undergo solar and wind power shortfalls, the European energy transition can be advanced.


Related News

View more

UK low-carbon electricity generation stalls in 2019

UK low-carbon electricity 2019 saw stalled growth as renewables rose slightly, wind expanded, nuclear output fell, coal hit record lows, and net-zero targets demand faster deployment to cut CO2 intensity below 100gCO2/kWh.


Key Points

Low-carbon sources supplied 54% of UK power in 2019, up just 1TWh; wind grew, nuclear fell, and coal dropped to 2%.

✅ Wind up 8TWh; nuclear down 9TWh amid outages

✅ Fossil fuels 43% of generation; coal at 2%

✅ Net-zero needs 15TWh per year added to 2030


The amount of electricity generated by low-carbon sources in the UK stalled in 2019, Carbon Brief analysis shows.

Low-carbon electricity output from wind, solar, nuclear, hydro and biomass rose by just 1 terawatt hour (TWh, less than 1%) in 2019. It represents the smallest annual increase in a decade, where annual growth averaged 9TWh. This growth will need to double in the 2020s to meet UK climate targets while replacing old nuclear plants as they retire.

Some 54% of UK electricity generation in 2019 came from low-carbon sources, including 37% from renewables and 20% from wind alone, underscoring wind's leading role in the power mix during key periods. A record-low 43% was from fossil fuels, with 41% from gas and just 2% from coal, also a record low. In 2010, fossil fuels generated 75% of the total.

Carbon Brief’s analysis of UK electricity generation in 2019 is based on figures from BM Reports and the Department for Business, Energy and Industrial Strategy (BEIS). See the methodology at the end for more on how the analysis was conducted.

The numbers differ from those published earlier in January by National Grid, which were for electricity supplied in Great Britain only (England, Wales and Scotland, but excluding Northern Ireland), including via imports from other countries.

Low-carbon low
In 2019, the UK became the first major economy to target net-zero greenhouse gas emissions by 2050, increasing the ambition of its legally binding Climate Change Act.

To date, the country has cut its emissions by around two-fifths since 1990, with almost all of its recent progress coming from the electricity sector.

Emissions from electricity generation have fallen rapidly in the decade since 2010 as coal power has been almost phased out and even gas output has declined. Fossil fuels have been displaced by falling demand and by renewables, such as wind, solar and biomass.

But Carbon Brief’s annual analysis of UK electricity generation shows progress stalled in 2019, with the output from low-carbon sources barely increasing compared to a year earlier.

The chart below shows low-carbon generation in each year since 2010 (grey bars) and the estimated level in 2019 (red). The pale grey bars show the estimated future output of existing low-carbon sources after old nuclear plants retire and the pale red bars show the amount of new generation needed to keep electricity sector emissions to less than 100 grammes of CO2 per kilowatt hour (gCO2/kWh), the UK’s nominal target for the sector.

 Annual electricity generation in the UK by fuel, terawatt hours, 2010-2019. Top panel: fuel by fuel. Bottom panel: cumulative total generation from all sources. Source: BEIS energy trends, BM Reports and Carbon Brief analysis. Chart by Carbon Brief using Highcharts.
As the chart shows, the UK will require significantly more low-carbon electricity over the next decade as part of meeting its legally binding climate goals.

The nominal 100gCO2/kWh target for 2030 was set in the context of the UK’s less ambitious goal of cutting emissions to 80% below 1990 levels by 2050. Now that the country is aiming to cut emissions to net-zero by 2050, that 100gCO2/kWh indicator is likely to be the bare minimum.

Even so, it would require a rapid step up in the pace of low-carbon expansion, compared to the increases seen over the past decade. On average, low-carbon generation has risen by 9TWh each year in the decade since 2010 – including a rise of just 1TWh in 2019.

Given scheduled nuclear retirements and rising demand expected by the Committee on Climate Change (CCC) – with some electrification of transport and heating – low-carbon generation would need to increase by 15TWh each year until 2030, just to meet the benchmark of 100gCO2/kWh.

For context, the 3.2 gigawatt (GW) Hinkley C new nuclear plant being built in Somerset will generate around 25TWh once completed around 2026. The world’s largest offshore windfarm, the 1.2GW Hornsea One scheme off the Yorkshire coast, will generate around 5TWh each year.

The new Conservative government is targeting 40GW of offshore wind by 2030, up from today’s figure of around 8GW. If policies are put in place to meet this goal, then it could keep power sector emissions below 100gCO2/kWh, depending on the actual performance of the windfarms built.

However, new onshore wind and solar, further new nuclear or other low-carbon generation, such as gas with carbon capture and storage (CCS), is likely to be needed if demand is higher than expected, or if the 100gCO2/kWh benchmark is too weak in the context of net-zero by 2050.

The CCC says it is “likely” to “reflect the need for more rapid deployment” of low-carbon towards net-zero emissions in its advice on the sixth UK carbon budget for 2033-2037, due in September.

Trading places
Looking more closely at UK electricity generation in 2019, Carbon Brief’s analysis shows why there was so little growth for low-carbon sources compared to the previous year.

There was another increase for wind power in 2019 (up 8TWh, 14%), with record wind generation as several large new windfarms were completed including the 1.2GW Hornsea One project in October and the 0.6GW Beatrice offshore windfarm in Q2 of 2019. But this was offset by a decline for nuclear (down 9TWh, 14%), due to ongoing outages for reactors at Hunterston in Scotland and Dungeness in Kent.

(Analysis of data held by trade organisation RenewableUK suggests some 0.6GW of onshore wind capacity also started operating in 2019, including the 0.2GW Dorenell scheme in Moray, Scotland.)

As a result of these movements, the UK’s windfarms overtook nuclear for the first time ever in 2019, becoming the country’s second-largest source of electricity generation, and earlier, wind and solar together surpassed nuclear in the UK as momentum built. This is shown in the figure below, with wind (green line, top panel) trading places with nuclear (purple) and gas (dark blue) down around 25% since 2010 but remaining the single-largest source.

 Annual electricity generation in the UK by fuel, terawatt hours, 2010-2019. Top panel: fuel by fuel. Bottom panel: cumulative total generation from all sources. Source: BEIS energy trends, BM Reports and Carbon Brief analysis. Chart by Carbon Brief using Highcharts.
The UK’s currently suspended nuclear plants are due to return to service in January and March, according to operator EDF, the French state-backed utility firm. However, as noted above, most of the UK’s nuclear fleet is set to retire during the 2020s, with only Sizewell B in Suffolk due to still be operating by 2030. Hunterston is scheduled to retire by 2023 and Dungeness by 2028.

Set against these losses, the UK has a pipeline of offshore windfarms, secured via “contracts for difference” with the government, at a series of auctions. The most recent auction, in September 2019, saw prices below £40 per megawatt hour – similar to current wholesale electricity prices.

However, the capacity contracted so far is not sufficient to meet the government’s target of 40GW by 2030, meaning further auctions – or some other policy mechanism – will be required.

Coal zero
As well as the switch between wind and nuclear, 2019 also saw coal fall below solar for the first time across a full year, echoing the 2016 moment when wind outgenerated coal across the UK, after it suffered another 60% reduction in electricity output. Just six coal plants remain in the UK, with Aberthaw B in Wales and Fiddlers Ferry in Cheshire closing in March.

Coal accounted for just 2% of UK generation in 2019, a record-low coal share since centralised electricity supplies started to operate in 1882. The fuel met 40% of UK needs as recently as 2012, but has plummeted thanks to falling demand, rising renewables, cheaper gas and higher CO2 prices.

The reduction in average coal generation hides the fact that the fuel is now often not required at all to meet the UK’s electricity needs. The chart below shows the number of days each year when coal output was zero in 2019 (red line) and the two previous years (blue).

 Cumulative number of days when UK electricity generation from renewable sources has been higher than that from fossil fuels. Source: BEIS energy trends, BM Reports and Carbon Brief analysis. Chart by Carbon Brief using Highcharts.
The 83 days in 2019 with zero coal generation amount to nearly a quarter of the year and include the record-breaking 18-day stretch without the fuel.

Great Britain has been running for a record TWO WEEKS without using coal to generate electricity – the first time this has happened since 1882.

The country’s grid has been coal-free for 45% of hours in 2019 so far.https://www.carbonbrief.org/countdown-to-2025-tracking-the-uk-coal-phase-out …

Coal generation was set for significant reductions around the world in 2019 – including a 20% reduction for the EU as a whole – according to analysis published by Carbon Brief in November.

Notably, overall UK electricity generation fell by another 9TWh in 2019 (3%), bringing the total decline to 58TWh since 2010. This is equivalent to more than twice the output from the Hinkley C scheme being built in Somerset. As Carbon Brief explained last year, falling demand has had a similar impact on electricity-sector CO2 emissions as the increase in output from renewables.

This is illustrated by the fact that the 9TWh reduction in overall generation translated into a 9TWh (6%) cut in fossil-fuel generation during 2019, with coal falling by 10TWh and gas rising marginally.

Increasingly renewable
As fossil-fuel output and overall generation have declined, the UK’s renewable sources of electricity have continued to increase. Their output has risen nearly five-fold in the past decade and their share of the UK total has increased from 7% in 2010 to 37% in 2019.

As a result, the UK’s increasingly renewable grid is seeing more minutes, hours and days during which the likes of wind, solar and biomass collectively outpace all fossil fuels put together, and on some days wind is the main source as well.

The chart below shows the number of days during each year when renewables generated more electricity than fossil fuels in 2019 (red line) and each of the previous four years (blue lines). In total, nearly two-fifths of days in 2019 crossed this threshold.

 Cumulative number of days when the UK has not generated any electricity from coal. Source: BEIS energy trends, BM Reports and Carbon Brief analysis. Chart by Carbon Brief using Highcharts.
There were also four months in 2019 when renewables generated more of the UK’s electricity than fossil fuels: March, August, September and December. The first ever such month came in September 2018 and more are certain to follow.

National Grid, which manages Great Britain’s high-voltage electricity transmission network, is aiming to be able to run the system without fossil fuels by 2025, at least for short periods. At present, it sometimes has to ask windfarm operators to switch off and gas plants to start running in order to keep the electricity grid stable.

Note that biomass accounted for 11% of UK electricity generation in 2019, nearly a third of the total from all renewables. Some two-thirds of the biomass output is from “plant biomass”, primarily wood pellets burnt at Lynemouth in Northumberland and the Drax plant in Yorkshire. The remainder was from an array of smaller sites based on landfill gas, sewage gas or anaerobic digestion.

The CCC says the UK should “move away” from large-scale biomass power plants, once existing subsidy contracts for Drax and Lynemouth expire in 2027.

Using biomass to generate electricity is not zero-carbon and in some circumstances could lead to higher emissions than from fossil fuels. Moreover, there are more valuable uses for the world’s limited supply of biomass feedstock, the CCC says, including carbon sequestration and hard-to-abate sectors with few alternatives.

Methodology
The figures in the article are from Carbon Brief analysis of data from BEIS Energy Trends chapter 5 and chapter 6, as well as from BM Reports. The figures from BM Reports are for electricity supplied to the grid in Great Britain only and are adjusted to include Northern Ireland.

In Carbon Brief’s analysis, the BM Reports numbers are also adjusted to account for electricity used by power plants on site and for generation by plants not connected to the high-voltage national grid. This includes many onshore windfarms, as well as industrial gas combined heat and power plants and those burning landfill gas, waste or sewage gas.

By design, the Carbon Brief analysis is intended to align as closely as possible to the official government figures on electricity generated in the UK, reported in BEIS Energy Trends table 5.1.

Briefly, the raw data for each fuel is in most cases adjusted with a multiplier, derived from the ratio between the reported BEIS numbers and unadjusted figures for previous quarters.

Carbon Brief’s method of analysis has been verified against published BEIS figures using “hindcasting”. This shows the estimates for total electricity generation from fossil fuels or renewables to have been within ±3% of the BEIS number in each quarter since Q4 2017. (Data before then is not sufficient to carry out the Carbon Brief analysis.)

For example, in the second quarter of 2019, a Carbon Brief hindcast estimates gas generation at 33.1TWh, whereas the published BEIS figure was 34.0TWh. Similarly, it produces an estimate of 27.4TWh for renewables, against a BEIS figure of 27.1TWh.

National Grid recently shared its own analysis for electricity in Great Britain during 2019 via its energy dashboard, which differs from Carbon Brief’s figures.


Related News

View more

Quebec Halts Crypto Mining Electricity Requests

Hydro-Quebec Crypto Mining Pause signals a temporary halt as blockchain power requests surge; energy regulator review will weigh electricity demand, winter peak constraints, tariffs, investments, and local jobs to optimize grid stability and revenues.


Key Points

A provincial halt on new miner power requests as Hydro-Quebec sets rules to safeguard demand, winter peaks, and rates.

✅ Temporary halt on new electricity sales to crypto miners

✅ Regulator to rank projects by jobs, investment, and revenue

✅ Winter peak demand and tariffs central to new framework


Major Canadian electricity provider Hydro-Québec will temporarily stop processing requests from cryptocurrency miners in order for the company to fulfil its obligations to supply energy to the entire province, while its global ambitions adjust to changing demand, according to a press release published June 7.

Hydro-Québec is experiencing “unprecedented” demand from blockchain companies, which reportedly exceeds the electric utility’s short and medium-term capacity. In this regard, the Quebec provincial government has ordered Hydro-Québec to halt electric power sales to cryptocurrency miners, and, following the New Hampshire rejection of Northern Pass announced a new framework for this category of electricity consumers.

In the coming days, Hydro-Québec will reportedly file an application to local energy regulator Régie de l'énergie, proposing a selection process for blockchain industry projects so as “not to miss the opportunities offered by this industry.” Regulators will reportedly target companies which can offer the province the most profitable economic advantages, including investments and local job creation.

#google#

Régie de l'énergie is instructed to consider “the need for a reserved block of energy for this category of consumers, the possibility of maximizing Hydro-Québec's revenues, and issues related to the winter peak period” as well as interprovincial arrangements like the Ontario-Québec electricity deal under discussion. Éric Filion, President of Hydro-Québec Distribution, said:

"The blockchain industry is a promising avenue for Hydro-Québec. Guidelines are nevertheless required to ensure that the development of this industry maximizes spinoffs for Québec without resulting in rate increases for our customers. We are actively participating in the Régie de l'énergie's process so that these guidelines can be produced as quickly as possible."

With this move, the government of Québec deviates from its decision to reportedly open the electricity market to miners at the end of last month, even as an Ontario-Quebec energy swap helps manage electricity demands. In March, the government said it was not interested in providing cheap electricity to Bitcoin miners, stating that cryptocurrency mining at a discount without any sort of “added value” for the local economy was unfavorable.


Related News

View more

Global CO2 emissions 'flatlined' in 2019, says IEA

2019 Global CO2 Emissions stayed flat, IEA reports, as renewable energy growth, wind and solar deployment, nuclear output, and coal-to-gas switching in advanced economies offset increases elsewhere, supporting climate goals and clean energy transitions.


Key Points

33 gigatonnes, unchanged YoY, as advanced economies cut power emissions via renewables, gas, and nuclear.

✅ IEA reports emissions flat at 33 Gt despite 2.9% GDP growth

✅ Advanced economies cut power-sector CO2 via wind, solar, gas

✅ Nuclear restarts and mild weather aided reductions


Despite widespread expectations of another increase, global energy-related CO2 emissions stopped growing in 2019, according to International Energy Agency (IEA) data released today. After two years of growth, global emissions were unchanged at 33 gigatonnes in 2019, a notable marker in the global energy transition narrative even as the world economy expanded by 2.9%.

This was primarily due to declining emissions from electricity generation in advanced economies, thanks to the expanding role of renewable sources (mainly wind and solar across many markets), fuel switching from coal to natural gas, and higher nuclear power generation, the Paris-based organisation says in the report.

"We now need to work hard to make sure that 2019 is remembered as a definitive peak in global emissions, not just another pause in growth," said Fatih Birol, the IEA's executive director. "We have the energy technologies to do this, and we have to make use of them all."

Higher nuclear power generation in advanced economies, particularly in Japan and South Korea, avoided over 50 Mt of CO2 emissions. Other factors included milder weather in several countries, and slower economic growth in some emerging markets. In China, emissions rose but were tempered by slower economic growth and higher output from low-carbon sources of electricity. Renewables continued to expand in China, and 2019 was also the first full year of operation for seven large-scale nuclear reactors in the country.

A significant decrease in emissions in advanced economies in 2019 offset continued growth elsewhere. The USA recorded the largest emissions decline on a country basis, with a fall of 140 million tonnes, or 2.9%. US emissions are now down by almost 1 gigatonne from their peak in 2000. Emissions in the European Union fell by 160 million tonnes, or 5%, in 2019 driven by reductions in the power sector as electricity producers move away from coal in the generation mix. Japan’s emissions fell by 45 million tonnes, or around 4%, the fastest pace of decline since 2009, as output from recently restarted nuclear reactors increased.

Emissions in the rest of the world grew by close to 400 million tonnes in 2019, with almost 80% of the increase coming from countries in Asia where coal-fired power generation continued to rise, and in Australia emissions rose 2% due to electricity and transport. Coal-fired power generation in advanced economies declined by nearly 15%, reflecting a sharp fall in coal-fired electricity across multiple markets, as a result of growth in renewables, coal-to-gas switching, a rise in nuclear power and weaker electricity demand.

The IEA will publish a World Energy Outlook Special Report in June that will map out how to cut global energy-related carbon emissions by one-third by 2030 and put the world on track for longer-term climate goals, a pathway that, in Canada, will require more electricity to hit net-zero. It will also hold an IEA Clean Energy Transitions Summit in Paris on 9 July, bringing together key government ministers, CEOs, investors and other major stakeholders.

Birol will discuss the results published today tomorrow at an IEA Speaker Series event at its headquarters with energy and climate ministers from Poland, which hosted COP24 in Katowice; Spain, which hosted COP25 in Madrid; and the UK, which will host COP26 in Glasgow this year, as greenhouse gas concentrations continue to break records worldwide.


Related News

View more

New York State to investigate sites for offshore wind projects

NYSERDA Offshore Wind Data initiative funds geophysical and geotechnical surveys, seabed and soil studies on New York's shelf to accelerate siting, optimize foundation design, reduce costs, and advance clean energy deployment.


Key Points

State funding to support surveys and soil studies guiding offshore wind siting, design, and cost reduction.

✅ Up to $5.5M for geophysical and geotechnical data collection

✅ Focus on seabed soils, shelf geology, and foundation design inputs

✅ Accelerates siting, reduces risk, and lowers offshore wind costs


The New York State Energy Research and Development Authority (NYSERDA) is investing up to $5.5 million for the collection of geophysical and geotechnical data to determine future offshore wind development sites.

The funding is to look at seabed soil and geological data for the preliminary design and installation requirements for future offshore wind projects. Its part of N.Y. Gov. Andrew Cuomos plan to develop 9,000 megawatts of offshore wind energy by 2035.

Todays announcement is another step in Governor Cuomos steadfast march to achieving 9,000 megawatts of offshore wind by 2035, putting New York in a clear national leadership position when it comes to advancing this new industry through large-scale energy projects across the state. The surveys NYSERDA will be funding under this solicitation will expand the offshore wind industrys access to geophysical and geotechnical data that will provide the foundation for future offshore wind development in these areas, and accelerate project development while driving down costs, NYSERDA President and CEO Alicia Barton said.

NYSERDA will select one or more contractors to do the investigations, while recent DOE wind energy awards support complementary research, and develop a model for describing geophysical and geotechnical conditions. NYSERDA will also select a contractor to support project management and host the data that is collected. The submission deadline is Jan. 21, 2020.

Todays announcement builds on the data collected in a Geotechnical and Geophysical Desktop Study also released today, which includes information on the middle continental shelf off the shore of New York and New Jersey, where BOEM lease requests are shaping activity, creating a regional overview of the seafloor and sub-seafloor environment as it relates to offshore wind development.

Strong knowledge of environmental conditions and factors, including seabed soil conditions, are essential for the installation of offshore projects, such as Long Island proposals, but only a limited amount of soil sampling and testing has been undertaken to date.

The collection of geophysical and geotechnical data from areas off of New Yorks Atlantic coast is yet another demonstration of New Yorks leadership promoting the responsible development of offshore wind. The data generated by this initiative will ultimately lead to better projects, lower cost, and enhanced safety. New York is leading the way to a clean energy future, as the state finalizes renewable project contracts that expand capacity, and relying on data collection and sound science to get us there, New York Offshore Wind Alliance Director Joe Martens said.


Related News

View more

Sign Up for Electricity Forum’s Newsletter

Stay informed with our FREE Newsletter — get the latest news, breakthrough technologies, and expert insights, delivered straight to your inbox.

Electricity Today T&D Magazine Subscribe for FREE

Stay informed with the latest T&D policies and technologies.
  • Timely insights from industry experts
  • Practical solutions T&D engineers
  • Free access to every issue

Live Online & In-person Group Training

Advantages To Instructor-Led Training – Instructor-Led Course, Customized Training, Multiple Locations, Economical, CEU Credits, Course Discounts.

Request For Quotation

Whether you would prefer Live Online or In-Person instruction, our electrical training courses can be tailored to meet your company's specific requirements and delivered to your employees in one location or at various locations.