NFPA 70b Training - Electrical Maintenance
Our customized live online or in‑person group training can be delivered to your staff at your location.

- Live Online
- 12 hours Instructor-led
- Group Training Available
Regular Price:
$699
Coupon Price:
$599
OTTAWA
—
Canada 2035 Clean Electricity Target faces a 48.4GW shortfall as renewable capacity lags; accelerating wind, solar PV, grid upgrades, and coherent federal-provincial policy is vital to reach zero-emissions power and strengthen transmission and distribution.
Understanding the Story
Canada's plan to supply nearly 100% of electricity from zero-emitting sources by 2035, requiring renewable buildout.
Shortfall of 48.4GW versus 2035 zero-emissions electricity goal
Average additions only 2.6GW per year lag required pace
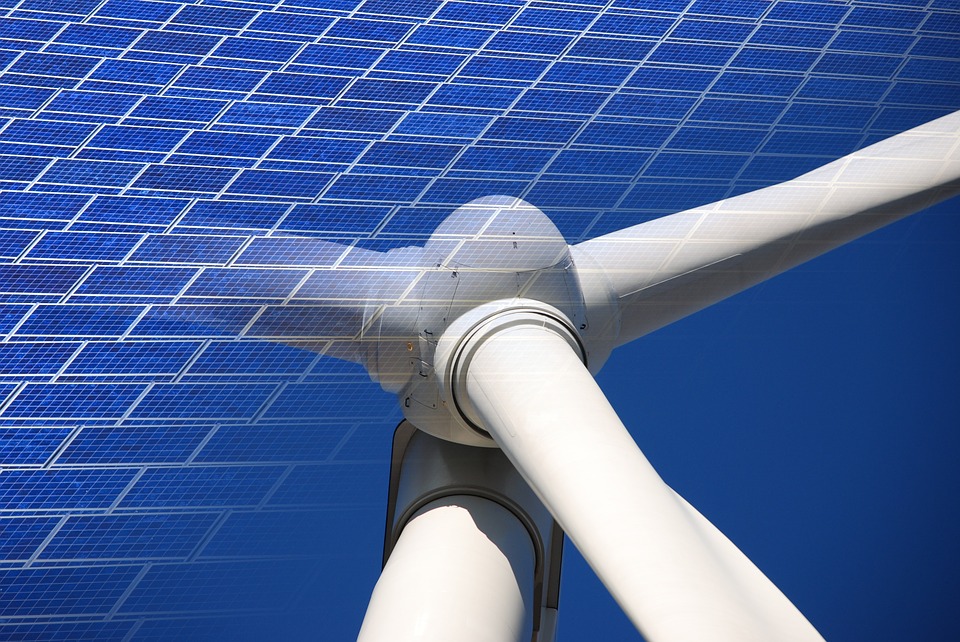
Accelerate wind and solar PV deployment across provinces
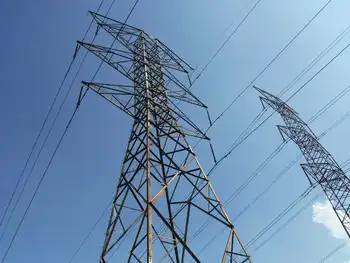
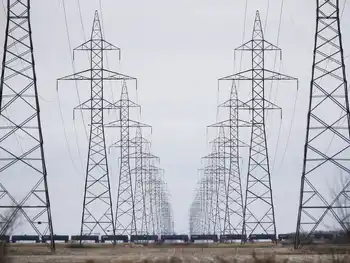
Upgrade transmission and distribution to integrate renewables
Align federal-provincial policy and retire thermal capacity
GlobalData’s latest report, ‘Canada Power Market Size and Trends by Installed Capacity, Generation, Transmission, Distribution and Technology, Regulations, Key Players and Forecast, 2022-2035’, discusses the power market structure of Canada and, amid looming power challenges, provides historical and forecast numbers for capacity, generation and consumption up to 2035. Detailed analysis of the country’s power market regulatory structure, competitive landscape and a list of major power plants are provided. The report also gives a snapshot of the power sector in the country on broad parameters of macroeconomics, supply security, generation infrastructure, transmission and distribution infrastructure, electricity import and export scenario, degree of competition, regulatory scenario, and future potential. An analysis of the deals in the country’s power sector is also included in the report.
Canada is expected to fall short of its 2035 clean electricity target after reviewing the country’s current renewable capacity activity. The country has targeted to produce nearly 100% of its electricity from zero-emitting sources by 2035, while electricity associations' net-zero goals extend to 2050; however, the country is adding only 2.6GW of annual renewable capacity additions on average every year, which would mean a cumulative shortfall of 48.4GW.
Canada has good governmental support, but it is not doing enough to ensure its targets are met. If the country is to meet its target to produce nearly 100% of electricity from zero-emitting sources by 2035, the country should both increase the capacity and efficiency of renewable power plants, as well as provide comprehensive end-to-end policies at both the federal and provincial levels, as debates over whether Ontario is embracing clean power continue across provinces. It should also involve communities and businesses in raising awareness of the benefits of adopting renewable energy.
The country has a large amount of proven natural gas and oil reserves that are proving too tempting an opportunity, and the Canadian Government is planning to increase the capacity of its gas-based plants under net-zero regulations permit some gas in the power mix, to secure real-time demand and supply. However, the country’s dependency on gas-based plants creates a major challenge to achieve its 2035 clean electricity target.
If the Canadian Government is to meet its 2035 targets, it should draw on examples from its European counterparts and add renewable capacity at a rapid pace, while balancing demand and emissions in key provinces. One advantage for Canada here is that it does not have land constraints, which is common in other major renewable power-generating countries. This could give the country an estimated 6.1GW of renewable capacity every year on average during the 2021-2035 period: enough capacity to meet its target. Most of these installations are expected to be for wind and solar PV.
Changing provincial governments are not helpful when it comes to implementing long-term projects, especially as Ontario faces looming electricity shortfalls that heighten planning risks, and continued stopping and starting of projects like this will only be damaging to renewable goals. Another way the country can achieve its target is by converting thermal power plants into clean energy plants and providing a roadmap or timeline for provinces to retire thermal power plants completely, even as scrapping coal can be costly for some systems.
Canada’s GDP (at constant prices) increased from $1,617.3bn in 2010 to $1,924.5bn in 2021, at a CAGR of 1.6%. The GDP (at constant prices) of the country declined sharply from $1,943.8bn in 2019 to $1,840.5bn in 2020 because of Covid-19 pandemic. After the recommencement of regular industrial and trade activities, the GDP grew by 4.6% in 2021 from 2020. The GDP is expected to cross pre-pandemic levels by the end of 2022.
Related News
Related News
Hydro One: No cut in peak hydro rates yet for self-isolating customers
Hydro One COVID-19 Rate Relief responds to time-of-use pricing, peak rates, and Ontario Energy Board…
View more
Georgia Power customers to see $21 reduction on June bills
Georgia Power June bill credit delivers PSC-approved savings, lower fuel rates, and COVID-19 relief for…
View more

Operating record for Bruce Power as Covid-19 support Council announced
Bruce Power Life-Extension Programme advances Ontario nuclear capacity through CANDU Major Component Replacement, reliable operation…
View more
Europe's grid backlog stalls clean-energy rollout, costing billions
European Grid Backlog is delaying connection queues across the EU, stranding renewable energy and battery…
View more
Hydro One delivery rates go up
Hydro One Rate Hike reflects Ontario Energy Board approval for higher delivery charges, impacting seasonal…
View more
Enbridge Insists Storage Hub Lives On After Capital Power Pullout
Enbridge Alberta CCS Project targets carbon capture and storage in Alberta, capturing emissions from industrial…
View more
Sign Up for Electricity Forum’s Newsletter
Stay informed with our FREE Newsletter — get the latest news, breakthrough technologies, and expert insights, delivered straight to your inbox.
Electricity Today T&D Magazine Subscribe for FREE

Stay informed with the latest T&D policies and technologies.
- Timely insights from industry experts
- Practical solutions T&D engineers
- Free access to every issue
