NFPA 70E Training
Our customized live online or in‑person group training can be delivered to your staff at your location.

- Live Online
- 6 hours Instructor-led
- Group Training Available
Regular Price:
$199
Coupon Price:
$149
OTTAWA
—
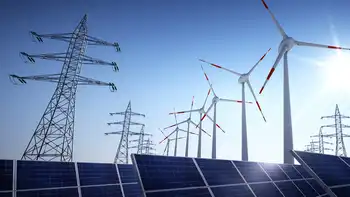
Smart Renewables and Electrification Pathways Program enables clean energy and grid modernization across Canada, funding wind, solar, hydro, geothermal, tidal, and storage to cut GHG emissions and accelerate electrification toward a net-zero economy.
At a Glance
A $964M Canadian program funding clean power and grid upgrades to cut emissions and build net-zero electrified economy.
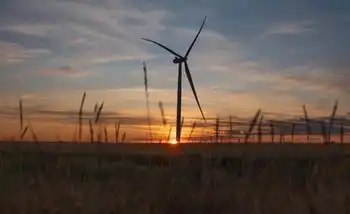
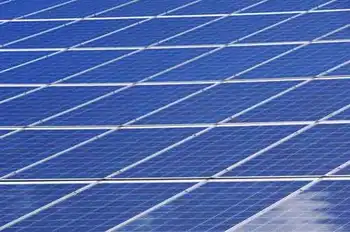
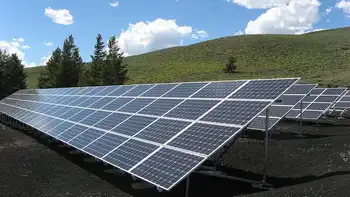
Funds wind, solar, hydro, geothermal, tidal, and energy storage
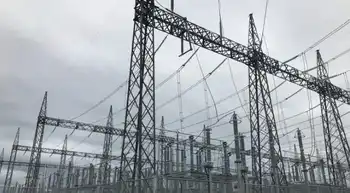
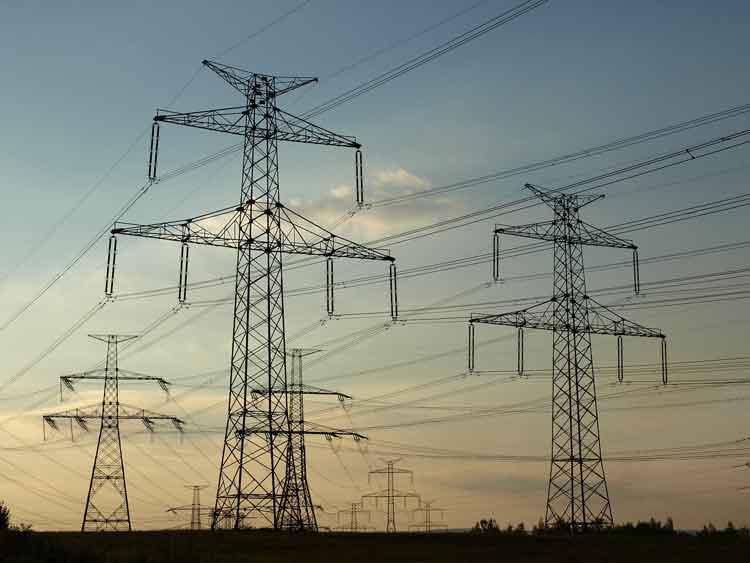
Modernizes grid operations for an electric, connected economy
Supports zero-emissions electricity by 2035 and net-zero by 2050
Backed by $964M via SREPs to scale clean, reliable power nationwide
Harnessing Canada's immense clean energy resources requires transformational investments to modernize our electricity grid. The Government of Canada is investing in renewable energy and upgrading the electricity grid, moving toward an electric, connected and clean economy, to make clean, affordable electricity options more accessible in communities across Canada.
The Honourable Seamus O'Regan Jr., Minister of Natural Resources, today launched a $964-million program, alongside a recent federal green electricity contract in Alberta that underscores momentum, to support smart renewable energy and grid modernization projects that will lower emissions by investing in clean energy technologies, like wind, solar, storage, hydro, geothermal and tidal energy across Atlantic Canada.
The Smart Renewables and Electrification Pathways Program (SREPs) supports building Canada's low-emissions energy future and a renewable, electrified economy through projects that focus on non-emitting, cleaner energy technologies, such as storage, and modernizing electricity system operations.
Investing in these technologies reduces greenhouse gas emissions by creating a cleaner, more connected electrical system, supporting progress toward zero-emissions electricity by 2035 goals, while helping Canada reach net-zero emissions by 2050.
Minister O'Regan launched the program during the Canadian Electricity Association's (CEA) virtual regulatory forum on Electricity Regulation & the Four Disruptors – Decarbonization, Decentralization, Digitalization and Democratization, highlighting evolving regulatory approaches as B.C. streamlines clean energy approvals to support deployment nationwide. The launch also coincides with Canadian Environment Week, which celebrates Canada's environmental accomplishments and encourages Canadians to contribute to conserving and protecting the environment.
Through SREPs and other programming, the government is working with provinces and territories, with the Prairie Provinces leading renewable growth in the years ahead, utilities, Indigenous partners and others, including diverse businesses and communities, to deliver these clean and reliable energy initiatives. With Canadian innovation, technology and skilled energy workers, we can provide more communities, households and businesses with an increased supply of clean electricity and a cleaner electrical grid.
To help interested stakeholders find information on SREPs, a new webpage has been launched, which includes a comprehensive guide for eligible projects.
This supports Canada's strengthened climate plan, A Healthy Environment and a Healthy Economy. Canada is advancing projects that support the clean grid of the future and seize opportunities in the global electricity market to boost competitiveness. Collectively with investments from the Fall Economic Statement 2020 and Budget 2021, Canada will achieve our climate change commitments and ensure a healthier environment and more prosperous economy for future generations.
Related News
Related News
Wyoming wind boost for US utility
Black Hills Energy Corriedale Wind Farm Expansion earns regulatory approval in Wyoming, boosting capacity to…
View more
Reliability of power winter supply puts Newfoundland 'at mercy of weather': report
Labrador Island Link Reliability faces scrutiny as Nalcor Energy and General Electric address software issues;…
View more

Ireland: We are the global leaders in taking renewables onto the grid
Ireland 65% Renewable Grid Capability showcases world leading integration of intermittent wind and solar, smart…
View more
Energy-insecure households in the U.S. pay 27% more for electricity than others
Community Solar for Low-Income Homes expands energy equity by delivering renewable energy access, predictable bill…
View more
Saskatchewan to credit solar panel owners, but not as much as old program did
Saskatchewan Solar Net Metering Program lets rooftop solar users offset at retail rate while earning…
View more
Ukrainians Find New Energy Solutions to Overcome Winter Blackouts
Ukraine Winter Energy Crisis highlights blackouts, damaged grid, and resilient solutions: solar panels, generators, wood…
View more
Sign Up for Electricity Forum’s Newsletter
Stay informed with our FREE Newsletter — get the latest news, breakthrough technologies, and expert insights, delivered straight to your inbox.
Electricity Today T&D Magazine Subscribe for FREE

Stay informed with the latest T&D policies and technologies.
- Timely insights from industry experts
- Practical solutions T&D engineers
- Free access to every issue

