Power firms win UK subsidies for new Channel cables project


power lines

Substation Relay Protection Training

Our customized live online or in‑person group training can be delivered to your staff at your location.

  • Live Online
  • 12 hours Instructor-led
  • Group Training Available
Regular Price:
$699
Coupon Price:
$599
Reserve Your Seat Today

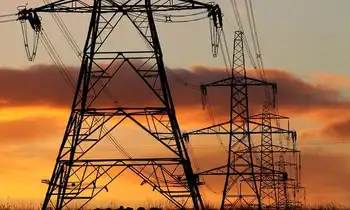
UK Electricity Interconnectors secure capacity market subsidies, supporting winter reliability with seabed cables to France and Belgium via the Channel Tunnel, lowering consumer costs, squeezing coal, and challenging new gas plants through cross-border energy trading.


Key Points

High-voltage cables linking Britain to Europe, securing backup capacity, cutting costs and boosting winter reliability.

✅ Won capacity market contracts at record-low prices

✅ Cables to France and Belgium via Channel Tunnel, seabed routes

✅ Squeezes coal, challenges new gas; renewables may join market


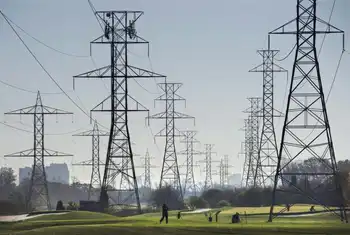
New electricity cables across the Channel to France and Belgium will be a key part of keeping Britain’s lights on during winter amid record electricity prices across Europe in the early 2020s, after their owners won backup power subsidies in a government auction this week.

For the first time, interconnector operators successfully bid for a slice of hundreds of millions’ worth of contracts in the capacity market. That will help cut costs for consumers, given how electricity is priced in Europe today, and squeeze out old coal power plants.

Three new interconnectors are currently being built to Europe, almost doubling existing capacity, with one along the Channel Tunnel and two on the seabed: one between Kent and Zeebrugge and one from Hampshire to Normandy. 

The interconnectors were success stories in this week’s capacity auction, which saw power firms bid to provide backup electricity in the winter of 2021/22. Prices for the four-year contracts hit a record low of £8.40 per kilowatt per year, which analysts described as a shock and well below expectations.

One industry source said the figure was “miles away” from what is needed to encourage companies to build big new gas power stations, which some argue are necessary to fill the gap when the UK’s ageing nuclear reactors close as Europe loses nuclear power across the region over the next decade.

While bad news for those firms, the low price is good for consumers. The subsidies will add about £525m to energy bills, or £5.68 for the average household, compared with £11 for the year before, according to analysts Cornwall Insight.

Existing gas power stations scooped up most of the contracts, but new gas ones lost out, as did several coal plants. Battery storage plants, a standout success in the last auction, fared comparatively poorly after changes to the rules.

Experts at Bernstein bank said the the misses by coal meant that around half the UK’s remaining coal power capacity could close from October 2019, when existing capacity market contracts run out. Chaitanya Kumar, policy adviser at thinktank Green Alliance, said: “Coal’s exit from the UK’s energy system just moved a step closer as coal contracts fell by half compared with last year.”

Tom Edwards, an analyst at Cornwall Insight, said that more interconnectors were likely to bid into future rounds of the capacity market, such as the cable being laid between Norway and the UK. Relying on foreign power supplies was fine, he said, provided Brexit did not make energy trading more difficult and the interconnectors delivered at times of need, where events like Irish grid price spikes illustrate the stress points.

However, one industry source, who wants to see new gas plants built in the UK, said the results showed that the system was not working, amid UK peak power prices that have climbed in recent trading. “That self-sufficiency doesn’t seem to be a priority at a time when we’re breaking away from Europe is a bit weird,” they said.

But the prospects for new gas plants in future rounds of the capacity market look bleak. They will very likely face a new source of competition next year, if energy regulator Ofgem approves a proposal to allow renewables to compete too.


Related News

Related News

Nonstop Records For U.S. Natural-Gas-Based Electricity

U.S. Natural Gas Power Demand is surging for electricity generation amid summer heat, with ERCOT, Texas grid reserves tight, EIA reporting coal and nuclear retirements, renewables intermittency, and pipeline expansions supporting combined-cycle capacity and prices.


Key Points

It is rising use of natural gas for power, driven by summer heat, plant retirements, and new combined-cycle capacity.

✅ ERCOT reserve margin 9%, below 14% target in Texas

✅ Gas share of U.S. power near 40-43% this summer

✅ Coal and nuclear retirements shift capacity to combined cycle


As the hot months linger, it will be natural gas that is leaned on most to supply the electricity that we need to run our air conditioning loads on the grid and keep us cool.

And this is surely a great and important thing: "Heat causes most weather-related deaths, National Weather Service says."

Generally, U.S. gas demand for power in summer is 35-40% higher than what it was five years ago, with so much more coming (see Figure).

The good news is regions across the country are expected to have plenty of reserves to keep up with power demand.

The only exception is ERCOT, covering 90% of the electric load in Texas, where a 9% reserve margin is expected, below the desired 14%.

Last summer, however, ERCOT’s reserve margin also was below the desired level, yet the grid operator maintained system reliability with no load curtailments.

Simply put, other states are very lucky that Texas has been able to maintain gas at 50% of its generation, despite being more than justified to drastically increase that.

At about 1,600 Bcf per year, the flatness of gas for power demand in Texas since 2000 has been truly remarkable, especially since Lone Star State production is up 50% since then.

Increasingly, other U.S. states (and even countries) are wanting to import huge amounts of gas from Texas, a state that yields over 25% of all U.S. output.

Yet if Texas justifiably ever wants to utilize more of its own gas, others would be significantly impacted.

At ~480 TWh per year, if Texas was a country, it would be 9th globally for power use, even ahead of Brazil, a fast growing economy with 212 million people, and France, a developed economy with 68 million people.

In the near-term, this explains why a sweltering prolonged heat wave in July in Texas, with a hot Houston summer setting new electricity records, is the critical factor that could push up still very low gas prices.

But for California, our second highest gas using state, above-average snowpack should provide a stronger hydropower for this summer season relative to 2018.

Combined, Texas and California consume about 25% of U.S. gas, with Texas' use double that of California.


Across the U.S., gas could supply a record 40-43% of U.S. electricity this summer even as the EIA expects solar and wind to be larger sources of generation across the mix

Our gas used for power has increased 35-40% over the past five years, and January power generation also jumped on the year, highlighting broad momentum.

Our gas used for power has increased 35-40% over the past five years. DATA SOURCE: EIA; JTC

Indeed, U.S. natural gas for electricity has continued to soar, even as overall electricity consumption has trended lower in some years, at nearly 10,700 Bcf last year, a 16% rise from 2017 and easily the highest ever.

Gas is expected to supply 37% of U.S. power this year, even as coal-fired generation saw a brief uptick in 2021 in EIA data, versus 27% just five years ago (see Figure).

Capacity wise, gas is sure to continue to surge its share 45% share of the U.S. power system.

"More than 60% of electric generating capacity installed in 2018 was fueled by natural gas."

We know that natural gas will continue to be the go-to power source: coal and nuclear plants are retiring, and while growing, wind and solar are too intermittent, geography limited, and transmission short to compensate like natural gas can.

"U.S. coal power capacity has fallen by a third since 2010," and last year "16 gigawatts (16,000 MW) of U.S. coal-fired power plants retired."

This year, some 2,000 MW of coal was retired in February alone, with 7,420 MW expected to be closed in 2019.

Ditto for nuclear.

Nuclear retirements this year include Pilgrim, Massachusetts’s only nuclear plant, and Three Mile Island in Pennsylvania.

This will take a combined ~1,600 MW of nuclear capacity offline.

Another 2,500 MW and 4,300 MW of nuclear are expected to be leaving the U.S. power system in 2020 and 2021, respectively.

As more nuclear plants close, EIA projects that net electricity generation from U.S. nuclear power reactors will fall by 17% by 2025.

From 2019-2025 alone, EIA expects U.S. coal capacity to plummet nearly 25% to 176,000 MW, with nuclear falling 15% to 83,000 MW.

In contrast, new combined cycle gas plants will grow capacity almost 30% to around 310,000 MW.

Lower and lower projected commodity prices for gas encourage this immense gas build-out, not to mention non-stop increases in efficiency for gas-based units.

Remember that these are official U.S. Department of Energy estimates, not coming from the industry itself.

In other words, our Department of Energy concludes that gas is the future.

Our hotter and hotter summers are therefore more and more becoming: "summers for natural gas"

Ultimately, this shows why the anti-pipeline movement is so dangerous.

"Affordable Energy Coalition Highlights Ripple Effect of Natural Gas Moratorium."

In April, President Trump signed two executive orders to promote energy infrastructure by directing federal agencies to remove bottlenecks for gas transport into the Northeast in particular, where New England oil-fired generation has spiked, and to streamline federal reviews of border-crossing pipelines and other infrastructure.

Builders, however, are not relying on outside help: all they know is that more U.S. gas demand is a constant, so more infrastructure is mandatory.

They are moving forward diligently: for example, there are now some 27 pipelines worth $33 billion already in the works in Appalachia.


Related News

View more

Which of the cleaner states imports dirty electricity?

Hourly Electricity Emissions Tracking maps grid balancing areas, embodied emissions, and imports/exports, revealing carbon intensity shifts across PJM, ERCOT, and California ISO, and clarifying renewable energy versus coal impacts on health and climate.


Key Points

An hourly method tracing generation, flows, and embodied emissions to quantify carbon intensity across US balancing areas.

✅ Hourly traces of imports/exports and generation mix

✅ Consumption-based carbon intensity by balancing area

✅ Policy insights for renewables, coal, health costs


In the United States, electricity generation accounts for nearly 30% of our carbon emissions. Some states have responded to that by setting aggressive renewable energy standards; others are hoping to see coal propped up even as its economics get worse. Complicating matters further is the fact that many regional grids are integrated, and as America goes electric the stakes grow, meaning power generated in one location may be exported and used in a different state entirely.

Tracking these electricity exports is critical for understanding how to lower our national carbon emissions. In addition, power from a dirty source like coal has health and environment impacts where it's produced, and the costs of these aren't always paid by the parties using the electricity. Unfortunately, getting reliable figures on how electricity is produced and where it's used is challenging, even for consumers trying to find where their electricity comes from in the first place, leaving some of the best estimates with a time resolution of only a month.

Now, three Stanford researchers—Jacques A. de Chalendar, John Taggart, and Sally M. Benson—have greatly improved on that standard, and they have managed to track power generation and use on an hourly basis. The researchers found that, of the 66 grid balancing areas within the United States, only three have carbon emissions equivalent to our national average, and they have found that imports and exports of electricity have both seasonal and daily changes. de Chalendar et al. discovered that the net results can be substantial, with imported electricity increasing California's emissions/power by 20%.

Hour by hour
To figure out the US energy trading landscape, the researchers obtained 2016 data for grid features called balancing areas. The continental US has 66 of these, providing much better spatial resolution on the data than the larger grid subdivisions. This doesn't cover everything—several balancing areas in Canada and Mexico are tied in to the US grid—and some of these balancing areas are much larger than others. The PJM grid, serving Pennsylvania, New Jersey, and Maryland, for example, is more than twice as large as Texas' ERCOT, in a state that produces and consumes the most electricity in the US.

Despite these limitations, it's possible to get hourly figures on how much electricity was generated, what was used to produce it, and whether it was used locally or exported to another balancing area. Information on the generating sources allowed the researchers to attach an emissions figure to each unit of electricity produced. Coal, for example, produces double the emissions of natural gas, which in turn produces more than an order of magnitude more carbon dioxide than the manufacturing of solar, wind, or hydro facilities. These figures were turned into what the authors call "embodied emissions" that can be traced to where they're eventually used.

Similar figures were also generated for sulfur dioxide and nitrogen oxides. Released by the burning of fossil fuels, these can both influence the global climate and produce local health problems.

Huge variation
The results were striking. "The consumption-based carbon intensity of electricity varies by almost an order of magnitude across the different regions in the US electricity system," the authors conclude. The low is the Bonneville Power grid region, which is largely supplied by hydropower; it has typical emissions below 100kg of carbon dioxide per megawatt-hour. The highest emissions come in the Ohio Valley Electric region, where emissions clear 900kg/MW-hr. Only three regional grids match the overall grid emissions intensity, although that includes the very large PJM (where capacity auction payouts recently fell), ERCOT, and Southern Co balancing areas.

Most of the low-emissions power that's exported comes from the Pacific Northwest's abundant hydropower, while the Rocky Mountains area exports electricity with the highest associated emissions. That leads to some striking asymmetries. Local generation in the hydro-rich Idaho Power Company has embodied emissions of only 71kg/MW-hr, while its imports, coming primarily from Rocky Mountain states, have a carbon content of 625kg/MW-hr.

The reliance on hydropower also makes the asymmetry seasonal. Local generation is highest in the spring as snow melts, but imports become a larger source outside this time of year. As solar and wind can also have pronounced seasonal shifts, similar changes will likely be seen as these become larger contributors to many of these regional grids. Similar things occur daily, as both demand and solar production (and, to a lesser extent, wind) have distinct daily profiles.

The Golden State
California's CISO provides another instructive case. Imports represent less than 30% of its total electric use in 2016, yet California electricity imports provided 40% of its embodied emissions. Some of these, however, come internally from California, provided by the Los Angeles Department of Water and Power. The state itself, however, has only had limited tracking of imported emissions, lumping many of its sources as "other," and has been exporting its energy policies to Western states in ways that shape regional markets.

Overall, the 2016 inventory provides a narrow picture of the US grid, as plenty of trends are rapidly changing our country's emissions profile, including the rise of renewables and the widespread adoption of efficiency measures and other utility trends in 2017 that continue to evolve. The method developed here can, however, allow for annual updates, providing us with a much better picture of trends. That could be quite valuable to track things like how the rapid rise in solar power is altering the daily production of clean power.

More significantly, it provides a basis for more informed policymaking. States that wish to promote low-emissions power can use the information here to either alter the source of their imports or to encourage the sites where they're produced to adopt more renewable power. And those states that are exporting electricity produced primarily through fossil fuels could ensure that the locations where the power is used pay a price that includes the health costs of its production.


Related News

View more

U.S. Electric Vehicle Market Share Dips in Q1 2024

U.S. EV Market Share Dip Q1 2024 reflects slower BEV adoption, rising PHEV demand, affordability concerns, charging infrastructure gaps, tax credit shifts, range anxiety, and automaker strategy adjustments across the electric vehicle market.


Key Points

Q1 2024 EV and hybrid share slipped as BEV sales lag, PHEVs rise, and affordability and charging concerns temper demand.

✅ BEV share fell to 7.0% as affordable models remain limited

✅ PHEV sales rose 50% YoY, easing range anxiety concerns

✅ Policy shifts and charging gaps weigh on consumer adoption


The U.S. electric vehicle (EV) market, once a beacon of unbridled growth, appears to be experiencing a course correction. Data from the U.S. Energy Information Administration (EIA) reveals that the combined market share of electric vehicles (battery electric vehicles, or BEVs) and hybrids dipped slightly in the first quarter of 2024, marking the first decline since the onset of the COVID-19 pandemic, even as EU EV share rose during lockdowns in 2020.

This news comes as a surprise to many analysts who predicted continued exponential growth for the EV market. While overall sales of electric vehicles surged into 2024 and did increase by 7% compared to Q1 2023, this growth wasn't enough to keep pace with the overall rise in vehicle sales. The result: a decline in market share from 18.8% in Q4 2023 to 18.0% in Q1 2024.

Several factors may be contributing to this shift. One potential culprit is a slowdown in battery electric vehicle sales. BEVs saw their share of the market dip from 8.1% to 7.0% in the same period. This could be attributed to a lack of readily available affordable options, with many popular EV models still commanding premium prices and concerns that EV supply may miss demand in the near term.

Another factor could be the rising interest in plug-in hybrid electric vehicles (PHEVs). PHEV sales witnessed a significant jump of 50% year-over-year, reflecting how gas-electric hybrids are getting a boost from major automakers, potentially indicating a consumer preference for vehicles that offer both electric and gasoline powertrain options, addressing concerns about range anxiety often associated with BEVs.

Industry experts offer mixed interpretations of this data. Some downplay the significance of the dip, attributing it to a temporary blip, even though EVs remain behind gas cars in total sales. They point to the ongoing commitment from major automakers to invest in EV production and the potential for new, more affordable models to hit the market soon.

Others express more concern, citing Europe's recent EV slump and suggesting this might be a sign of maturing consumer preferences. They argue that simply increasing the number of EVs on the market might not be enough. Automakers need to address issues like affordability, charging infrastructure, and range anxiety to maintain momentum.

The role of government incentives also remains a question mark. The federal tax credit for electric vehicles is currently set to phase out gradually, potentially impacting consumer purchasing decisions in the future. Continued government support, through incentives or infrastructure development, could be crucial in maintaining consumer interest.

The coming quarters will be crucial in determining the long-term trajectory of the U.S. EV market, especially after the global electric car market's rapid expansion in recent years. Whether this is a temporary setback or a more lasting trend remains to be seen. Addressing consumer concerns, ensuring a diverse range of affordable EV options, and continued government support will all be essential in ensuring the continued growth of this critical sector.

This development also presents an opportunity for traditional automakers. By capitalizing on the growing PHEV market and addressing consumer concerns about affordability and range anxiety, they can carve out a strong position in the evolving automotive landscape.


Related News

View more

Saskatchewan to credit solar panel owners, but not as much as old program did

Saskatchewan Solar Net Metering Program lets rooftop solar users offset at retail rate while earning 7.5 cents/kWh credits for excess energy; rebates are removed, SaskPower balances grid costs with a 100 kW cap.


Key Points

An updated SaskPower plan crediting rooftop solar at 7.5 cents/kWh, offsetting usage at retail rate, without rebates.

✅ Excess energy credited at 7.5 cents/kWh

✅ Offsets on-site use at retail electricity rates

✅ Up to 100 kW generation; no program capacity cap


Saskatchewan has unveiled a new program that credits electricity customers for generating their own solar power, but it won’t pay as much as an older program did or reimburse them with rebates for their costs to buy and install equipment.

The new net metering program takes effect Nov. 1, and customers will be able to use solar to offset their own power use at the retail rate, similar to UK households' right to sell power in comparable schemes, though program details differ.

But they will only get 7.5 cents per kilowatt hour credit on their bills for excess energy they put back into the grid, as seen in Duke Energy payment changes in other jurisdictions, rather than the 14 cents in the previous program.

Dustin Duncan, the minister responsible for Crown-owned SaskPower, says the utility had to consider the interests of people wanting to use rooftop solar and everyone else who doesn’t have or can’t afford the panels, who he says would have to make up for the lost revenue.

Duncan says the idea is to create a green energy option, with wind power gains highlighting broader competitiveness, while also avoiding passing on more of the cost of the system to people who just cannot afford solar panels of their own.

Customers with solar panels will be allowed to generate up to 100 kilowatts of power against their bills.

“It’s certainly my hope that this is going to provide sustainability for the industry, as illustrated by Alberta's renewable surge creating jobs, that they have a program that they can take forward to their potential customers, while at the same time ensuring that we’re not passing onto customers that don’t have solar panels more cost to upkeep the grid,” Duncan said Tuesday.

Saskatchewan NDP leader Ryan Meili said he believes eliminating the rebate and cutting the excess power credit will kill the province’s solar energy, a concern consistent with lagging solar demand in Canada in recent national reports, he said.

“(Duncan) essentially made it so that any homeowner who wants to put up panels would take up to twice as long to pay it back, which effectively prices everybody in the small part of the solar production industry — the homeowners, the farms, the small businesses, the small towns — out of the market,” Meili said.

The province’s old net metering program hit its 16 megawatt capacity ahead of schedule, forcing the program to shut down, while disputes like the Manitoba Hydro solar lawsuit have raised questions about program management elsewhere. It also had a rebate of 20 per cent of the cost of the system, but that rebate has been discontinued.

The new net metering program won’t have any limit on program capacity, or an end date.

According to Duncan, the old program would have had a net negative impact to SaskPower of about $54 million by 2025, but this program will be much less — between $4 million and $5 million.

Duncan said other provinces either have already or are in the process of moving away from rebates for solar equipment, including Nova Scotia's proposed solar charge and similar reforms, and away from the one-to-one credits for power generation.


Related News

View more

Wasteful air conditioning adds $200 to summer energy bills, reveals BC Hydro

BC Hydro Air Conditioning Efficiency Tips help cut energy bills as HVAC use rises. Avoid inefficient portable AC units, set thermostats near 25 C, use fans and window shading, and turn systems off when unoccupied.


Key Points

BC Hydro's guidelines to lower summer power bills by optimizing A/C settings, fans, shading, and usage habits at home.

✅ Set thermostats to 25 C; switch off A/C when away

✅ Prefer fans and window shading; close doors/windows in heat

✅ Avoid multiple portable A/C units; choose efficient HVAC


BC Hydro is scolding British Columbians for their ineffective, wasteful and costly use of home air conditioners.

In what the electric utility calls “not-so-savvy” behaviour, it says many people are over-spending on air conditioning units that are poorly installed or used incorrectly.

"The majority of British Columbians will spend more time at home this summer because of the COVID-19 pandemic," BC Hydro says in a news release about an August survey of customers.

"With A/C use on the rise, there is evidence British Columbians are not cooling down efficiently, leading to higher summer electricity bills, as extreme heat boosts U.S. bills too this summer."

BC Hydro estimates some customers are shelling out $200 more on their summer energy bills than they need to during a record-breaking 2021 demand year for electricity.

The pandemic is compounding the demand for cool, comfortable air at home. Roughly two in five British Columbians between the ages of 25 and 50 are working from home five days a week.

However, it’s not just COVID-19 that is putting a strain on energy consumption and monthly bills, with drought affecting generation as well today.

About 90 per cent of people who use an air conditioner set it to a temperature below the recommended 25 Celsius, according to BC Hydro.

In fact, one in three people have set their A/C to the determinedly unseasonable temperature of 19 C.

Another 30 per cent are using more than one portable air conditioning unit, which the utility says is considered the most inefficient model on the market, and questions remain about crypto mining electricity use in B.C. today.

The use of air conditioners is steadily increasing in B.C. and has more than tripled since 2001, according to BC Hydro, with all-time high demand also reported in B.C. during recent heat waves. The demand for climate control is particularly high among condo-dwellers since apartments tend to trap heat and stay warmer.

This may explain why one in 10 residents of the Lower Mainland has three portable air conditioning units, and elsewhere Calgary's frigid February surge according to Enmax.

In addition, 30 per cent of people keep the air conditioning on for the sake of their pets while no one is home.

BC Hydro makes these recommendations to save energy and money on monthly bills while still keeping homes cooled during summer’s hottest days, and it also offers a winter payment plan to help manage costs:

Cool homes to 25 C in summer months when home; air conditioning should be turned off when homes are unoccupied.
In place of air conditioning, running a fan for nine hours a day over the summer costs $7.
Shading windows with drapes and blinds can help insulate a home by keeping out 65 per cent of the heat.
If the temperature outside a home is warmer than inside, keep doors and windows closed to keep cooler air inside.
Use a microwave, crockpot or toaster oven to avoid the extra heat produced by larger appliances, such as an oven, when cooking. Hang clothes to dry instead of using a dryer on hot days.


Related News

View more

Nova Scotia can't order electric utility to lower power rates, minister says

Nova Scotia Power Rate Regulation explains how the privately owned utility is governed by the Utility Review Board, limiting government authority, while COVID-19 relief measures include suspended disconnections, waived fees, payment plans, and emergency assistance.


Key Points

URB oversight where the board, not the province, sets power rates, with COVID-19 relief pausing disconnections and fees.

✅ Province lacks authority to order rate cuts

✅ URB regulates Nova Scotia Power rates

✅ Relief: no disconnections, waived fees, payment plans


The province can't ask Nova Scotia Power to lower its rates to ease the financial pressure on out-of-work residents because it lacks the authority to take that kind of action, even as the Nova Scotia regulator approved a 14% hike in a separate proceeding, the provincial energy minister said Thursday.

Derek Mombourquette said he is in "constant contact" with the privately owned utility.

"The conversations are ongoing with Nova Scotia Power," he said after a cabinet meeting.

When asked if the Liberal government would order the utility to lower electricity rates as households and businesses struggle with the financial fallout from the COVID-19 pandemic, Mombourquette said there was nothing he could do.

"We don't have the regulatory authority as a government to reduce the rates," he told reporters during a conference call.

"They're independent, and they are regulated through the (Nova Scotia Utility Review Board). My conversations with Nova Scotia Power essentially have been to do whatever they can to support Nova Scotians, whether it's residents or businesses in this very difficult time."

Asked if the board would take action, the minister said: "I'm not aware of that," despite the premier's appeals to regulators in separate rate cases.

However, the minister noted that the utility, owned by Emera Inc., has suspended disconnections for bill non-payment for at least 90 days, a step similar to reconnection efforts by Hydro One announced in Ontario.

It has also relaxed payment timelines and waived penalties and fees, while some jurisdictions offered lump-sum credits to help with bills.

Nova Scotia Power CEO Wayne O'Connor has also said the company is making additional donations to a fund available to help low-income individuals and families pay their energy bills.

In late March, Ontario cut electricity rates for residential consumers, farms and small businesses in response to a surge in people forced to work from home as a result of the pandemic, alongside bill support measures for ratepayers.

Premier Doug Ford said there would be a 45-day switch to off-peak rates, later moving to a recovery rate framework, which meant electricity consumers would be paying the lowest rate possible at any time of day.

The change was expected to cost the province about $162 million.


Related News

View more

Sign Up for Electricity Forum’s Newsletter

Stay informed with our FREE Newsletter — get the latest news, breakthrough technologies, and expert insights, delivered straight to your inbox.

Electricity Today T&D Magazine Subscribe for FREE

Stay informed with the latest T&D policies and technologies.
  • Timely insights from industry experts
  • Practical solutions T&D engineers
  • Free access to every issue

Live Online & In-person Group Training

Advantages To Instructor-Led Training – Instructor-Led Course, Customized Training, Multiple Locations, Economical, CEU Credits, Course Discounts.

Request For Quotation

Whether you would prefer Live Online or In-Person instruction, our electrical training courses can be tailored to meet your company's specific requirements and delivered to your employees in one location or at various locations.