China boosts wind energy, photovoltaic and concentrated solar power


china solar power

Protective Relay Training - Basic

Our customized live online or in‑person group training can be delivered to your staff at your location.

  • Live Online
  • 12 hours Instructor-led
  • Group Training Available
Regular Price:
$699
Coupon Price:
$599
Reserve Your Seat Today

China Renewable Energy Law drives growth in wind power, solar thermal, and photovoltaic capacity, supporting grid integration and five-year plans, even as China leads CO2 emissions, with policy incentives, compliance inspections, and national resource assessments.


Key Points

A legal framework that speeds wind, solar thermal, and PV growth in China via mandates, incentives, and grid rules.

✅ 2018 renewables: 1.87T kWh, 26.7% of national power

✅ Over 100 State Council policies enabling deployment

✅ Law inspections and regional oversight across six provinces


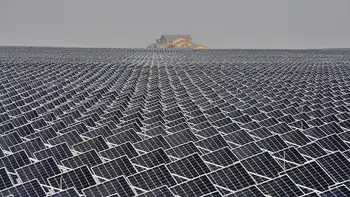
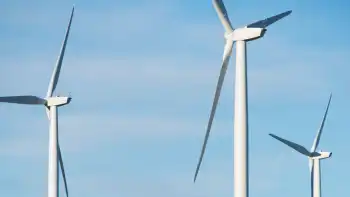
China leads renewable energies, installing more wind power, solar thermal and photovoltaic than any other country, as seen in the China solar PV growth reported in 2016, but also leads CO2 emissions, and much remains to be done.

The effective application of Chinas renewable energy law has boosted the use of renewable energy in the country and facilitated the rapid development of the sector, as solar parity across Chinese cities indicates, a report said.

The report on compliance with renewable energy law was presented today at the current bimonthly session of the Standing Committee of the National Peoples Assembly (APN).

Electricity generated by renewable energy amounted to about 1.87 trillion kilowatts per hour in 2018, representing 26.7 percent of Chinas total energy production in the year, aligning with trends where wind and solar doubling globally over five years, the report said.

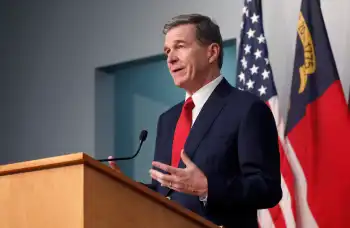
Ding Zhongli, vice president of the NPC Standing Committee, presented the report to the legislators at the second plenary meeting of the session.

An inspection of the law enforcement was carried out from August to November, as U.S. renewables hit 28% record showed momentum elsewhere. A total of 21 members of the NPC Standing Committee and the NPC Environmental Protection and Resource Conservation Committee, as well as national legislators, traveled to six regions at the provincial level on inspection visits. Twelve legislative bodies at the provincial level inspected the law enforcement efforts in their jurisdictions.

The relevant State Council agencies have implemented more than 100 regulations and policies to foster a good policy environment for the development of renewable energy, as seen in markets where U.S. renewable electricity surpassed coal in 2022. Local regulations have also been formulated based on local conditions, according to the report.

In accordance with the law, a thorough investigation of the national conditions of renewable energy resources was undertaken.

In 2008 and 2014 atlas of solar energy resources and wind energy evaluation of China were issued. The relevant agencies of the State Council have also implemented five-year plans for the development of renewable energy, which have provided guidance to the sector, while countries like Ireland's one-third green power target remain in focus within four years.

The main provisions of the law have been met, the law has been effectively applied and the purpose of the legislation has been met, and this momentum is echoed abroad, with U.S. renewables near one-fourth according to projections, Ding said.


Related News

Related News

New EPA power plant rules will put carbon capture to the test

CCUS in the U.S. Power Sector drives investments as DOE grants, 45Q tax credits, and EPA carbon rules spur carbon capture, geologic storage, and utilization, while debates persist over costs, transparency, reliability, and emissions safeguards.


Key Points

CCUS captures CO2 from power plants for storage or use, backed by 45Q tax credits, DOE funding, and EPA carbon rules.

✅ DOE grants and 45Q credits aim to de-risk project economics.

✅ EPA rules may require capture rates to meet emissions limits.

✅ Transparency and MRV guard against tax credit abuse.


New public and private funding, including DOE $110M for CCUS announced recently, and expected strong federal power plant emissions reduction standards have accelerated electricity sector investments in carbon capture, utilization and storage,’ or CCUS, projects but some worry it is good money thrown after bad.

CCUS separates carbon from a fossil fuel-burning power plant’s exhaust through carbon capture methods for geologic storage or use in industrial and other applications, according to the Department of Energy. Fossil fuel industry giants like Calpine and Chevron are looking to take advantage of new federal tax credits and grant funding for CCUS to manage potentially high costs in meeting power plant performance requirements, amid growing investor pressure for climate reporting, including new rules, expected from EPA soon, on reducing greenhouse gas emissions from existing power plants.

Power companies have “ambitious plans” to add CCUS to power plants, estimated to cause 25% of U.S. CO2 emissions. As a result, the power sector “needs CCUS in its toolkit,” said DOE Office of Fossil Energy and Carbon Management Assistant Secretary Brad Crabtree. Successful pilots and demonstrations “will add to investor confidence and lead to more deployment” to provide dispatchable clean energy, including emerging CO2-to-electricity approaches for power system reliability after 2030,| he added.

But environmentalists and others insist potentially cost-prohibitive CCUS infrastructure, including CO2 storage hub initiatives, must still prove itself effective under rigorous and transparent federal oversight.

“The vast majority of long-term U.S. power sector needs can be met without fossil generation, and better options are being deployed and in development,” Sierra Club Senior Advisor, Strategic Research and Development, Jeremy Fisher, said, pointing to carbon-free electricity investments gaining momentum in the market. CCUS “may be needed, but without better guardrails, power sector abuses of federal funding could lead to increased emissions and stranded fossil assets,” he added.

New DOE CCUS project grants, an increased $85 per metric ton, or tonne, federal 45Q tax credit, and the forthcoming EPA power plant carbon rules and the federal coal plan will do for CCUS what similar policies did for renewables, advocates and opponents agreed. But controversial past CCUS performance and tax credit abuses must be avoided with transparent reporting requirements for CO2 capture, opponents added.


Related News

View more

Paying for electricity in India: Power theft can't be business as usual

India Power Sector Payment Crisis strains utilities with electricity theft, discom arrears, coal dues, and subsidy burdens, triggering outages, load-shedding, and tariff stress as record heatwave demand tests grid reliability, billing compliance, and infrastructure upgrades.


Key Points

Linked payment shortfalls, theft, and subsidies driving arrears, outages, and planning gaps across Indias power grid.

✅ Discom arrears surpass Rs 1 lakh crore, straining cash flow

✅ Coal India unpaid, fuel risk rises and tariffs face pressure

✅ Outages and load-shedding worsen amid heatwave demand spike


India is among the world leaders in losing money to electricity theft. The country’s power sector also has a peculiar pattern of entities selling without getting the money on time, or nothing at all, while Manitoba Hydro debt highlights similar strains elsewhere. Coal India is owed about Rs 12,300 crore by power generation companies, which themselves have not been paid over Rs 1 lakh crore by distribution companies. The figures of losses suffered by discoms are much higher, even as UK network profits have drawn criticism, underscoring divergent market outcomes. The circuit does get completed somehow, but the uneven transaction, which defies business sense, introduces a disruptive strand that limits the scope for any future planning. Regular and unannounced shutdowns become the norm as the power supply falls short of demand, which this time is expected to touch record highs of 215-220 gigawatts amid the scorching heatwave, and cases like deferred BC Hydro costs illustrate how financial pressures accumulate.

In debt-ridden Punjab, the power subsidy bill is over Rs 10,000 crore, a large portion of which serves farmers. The AAP government plans to provide free electricity up to 300 units for every household from July 1, even as power bill cuts in Thailand show alternative approaches to affordability. The generous giveaways cannot camouflage the state of affairs. Thirty-three government departments had outstanding electricity bills of Rs 62 crore as on March 31, the end of the last financial year. With arrears of Rs 22.48 crore, the biggest defaulter was the Water and Sanitation Department. According to the Punjab State Power Corporation Limited, around 40 police stations and posts have been found to be stealing power or failing to clear the bills, while utility impersonation scams target consumers elsewhere. Customary warnings have been issued of snapping supply if the dues are not paid, even as utility penalties for disconnection delays underscore enforcement challenges, but ‘public interest’ and ‘essential services’ will ensure that such an eventuality does not arise.

The substantial fine imposed on a dera stealing power in Tarn Taran, along with the registration of an FIR, is exemplary action that needs to be carried forward. Change is tough, but a new way of working begins with those in positions of power leading by example, be it fixing the payment mechanism, upgrading infrastructure with smart grid initiatives in mind, minimising the use of electricity or a gradual switch to alternative energy sources.


Related News

View more

During this Pandemic, Save Money - How To Better Understand Your Electricity Bill

Commercial Electric Tariffs explain utility rate structures, peak demand charges, kWh vs kW pricing, time-of-use periods, voltage, delivery, capacity ratchets, and riders, guiding facility managers in tariff analysis for accurate energy savings.


Key Points

Commercial electric tariffs define utility pricing for energy, demand, delivery, time-of-use periods, riders, and ratchet charges.

✅ Separate kWh charges from kW peak demand fees.

✅ Verify time-of-use windows and demand interval length.

✅ Review riders, capacity ratchets, and minimum demand clauses.


Especially during these tough economic times, as major changes to electric bills are debated in some states, facility executives who don’t understand how their power is priced have been disappointed when their energy projects failed to produce expected dollar savings. Here’s how not to be one of them.

Your electric rate is spelled out in a document called a “tariff” that can be downloaded from your utility’s web page. A tariff should clearly spell out the costs for each component that is part of your rate, reflecting cost allocation practices in your region. Don’t be surprised to learn that it contains a bunch of them. Unlike residential electric rates, commercial electric bills are not based solely on the quantity of kilowatt-hours (kWh) consumed in a billing period (in the United States, that’s a month). Instead, different rates may apply to how your power is supplied, how it is delivered via electricity delivery charges, when it was consumed, its voltage, how fast it was used (in kW), and other factors.

If a tariff’s lingo and word structure are too opaque, spend some time with a utility account rep to translate it. Many state utility commissions also have customer advocates that may assist as they explore new utility rate designs that affect customers. Alternatively, for a fee, facility managers can privately chat with an energy consultant.

Common mistakes

Many facility managers try to estimate savings based on an averaged electric rate, i.e., annual electric spend divided by annual kWh. However, in markets where electricity demand is flat, such a number may obscure the fastest rising cost component: monthly peak demand charges, measured in dollars per kW (or kilo-volt-amperes, kVA).

This charge is like a monthly speeding ticket, based solely on the highest speed you drove during that time. In some areas, peak demand charges now account for 30 to 60 percent of a facility’s annual electric spend. When projecting energy cost savings, failing to separately account for kW peak demand and kWh consumption may result in erroneous results, and a lot of questions from the C-suite.

How peak demand charges are calculated varies among utilities. Some base it on the highest average speed of use across one hour in a month, while others may use the highest average speed during a 15- or 30-minute period. Others may average several of the highest speeds within a defined time period (for example, 8 a.m. to 6 p.m. on weekdays). It is whatever your tariff says it is.

Because some power-consuming (or producing) devices, including those tied to smart home electricity networks, vary in their operation or abilities, they may save money on a few — but not all — of those rate components. If an equipment vendor calculates savings from its product by using an average electric rate, take pause. Tell the vendor to return after the proposal has been redone using tariff-based numbers.

When a vendor is the only person calculating potential savings from using a product, there’s also a built-in conflict of interest: The person profiting from an equipment sale should not also be the one calculating its expected financial return. Before signing any energy project contracts, it’s essential that someone independent of the deal reviews projected savings. That person (typically an energy or engineering consultant) should be quite familiar with your facility’s electric tariff, including any special provisions, riders, discounts, etc., that may pertain. When this doesn’t happen, savings often don’t occur as planned. 

For example, some utilities add another form of demand charge, based on the highest kW in a year. It has various names: capacity, contract demand, or the generic term “ratchet charge.” Some utilities also have a minimum ratchet charge which may be based on a percent of a facility’s annual kW peak. It ensures collection of sufficient utility revenue to cover the cost of installed transmission and distribution even when a customer significantly cuts its peak demand.


Related News

View more

Ontario to seek new wind, solar power to help ease coming electricity supply crunch

Ontario Clean Grid Plan outlines emissions-free electricity growth, renewable energy procurement, nuclear expansion at Bruce and Darlington, reduced natural gas, grid reliability, and net-zero alignment to meet IESO demand forecasts and EV manufacturing loads.


Key Points

A plan to expand emissions-free power via renewables and nuclear, cut natural gas use, and meet growing demand.

✅ Targets renewables, hydro, and nuclear capacity growth

✅ Aims to reduce reliance on gas for grid reliability

✅ Aligns with IESO demand forecasts and EV manufacturing loads


Ontario is working toward filling all of the province’s quickly growing electricity needs with emissions-free sources, including a plan to secure new renewable generation and clean power options, but isn’t quite ready to commit to a moratorium on natural gas.

Energy Minister Todd Smith announced Monday a plan to address growing energy needs for 2030 to 2050 — the Independent Electricity System Operator projects Ontario’s electricity demand could double by mid-century — and next steps involve looking for new wind, solar and hydroelectric power.

“While we may not need to start building today, government and those in the energy sector need to start planning immediately, so we have new clean, zero-emissions projects ready to go when we need them,” Smith said in Windsor, Ont.

The strategy also includes two nuclear projects announced last week — a new large-scale nuclear plant at Bruce Power on the shore of Lake Huron and three new small modular reactors at the site of the Darlington nuclear plant east of Toronto.

Those projects, enough to power six million homes, will help Ontario end its reliance on natural gas to generate electricity, said Smith, but committing to a natural gas moratorium in 2027 and eliminating natural gas by 2050 is contingent on the federal government helping to speed up the new nuclear facilities.

“Today’s report, the Powering Ontario’s Growth plan, commits us to working towards a 100 per cent clean grid,” Smith said in an interview.

“Hopefully the federal government can get on board with our intentions to build this clean generation as quickly as possible … That will put us in a much better position to use our natural gas facilities less in the future, if we can get those new projects online.”

The IESO has said that natural gas is required to ensure supply and stability in the short to medium term, as Ontario works on balancing demand and emissions across the grid, but that it will also increase greenhouse gas emissions from the electricity sector.

The province is expected to face increased demand for electricity from expanded electric vehicle use and manufacturing in the coming years, even as a $400-billion cost estimate for greening the grid is debated.

Keith Brooks, programs director for Environmental Defence, said the provincial plan could have been much more robust, containing firm timelines and commitments.

“This plan does not commit to getting emissions out of the system,” he said.

“It doesn’t commit to net zero, doesn’t set a timeline for a net zero goal or have any projection around emissions from Ontario’s electricity sector going forward. In fact, it’s not really a plan. It doesn’t set out any real goals and it doesn’t it doesn’t project what Ontario’s supply mix might look like.”

The Canadian Climate Institute applauded the plan’s focus on reducing reliance on gas-fired generation and emphasizing non-emitting generation, but also said there are still some question marks.

“The plan is silent on whether the province intends to construct new gas-fired generation facilities,” even as new gas plant expansions are proposed, senior research director Jason Dion wrote in a statement.

“The province should avoid building new gas plants since cost-effective alternatives are available, and such facilities are likely to end up as stranded assets. The province’s timeline for reaching net zero generation is also unclear. Canada and other G7 countries have set a target for 2035, something Ontario will need to address if it wants to remain competitive.”


Related News

View more

South Africa's Eskom could buy less power from wind farms during lockdown

Eskom Wind Power Curtailment reflects South Africa's lockdown-driven drop in electricity demand, prompting grid-balancing measures as Eskom signals reduced IPP procurement from renewable energy projects during low-demand hours, despite guarantees and flexible generation constraints.


Key Points

A temporary reduction of wind IPP purchases by Eskom to balance surplus grid capacity during the COVID-19 lockdown slump

✅ Demand drop of 7,500 MW reduced need for variable renewables.

✅ Curtailment likely during low-demand early-morning hours.

✅ IPP revenues protected via contract extensions and guarantees.


South African state utility Eskom has told independent wind farms that it could buy less of their power in the coming days, as electricity demand has plummeted during a lockdown, reflecting the Covid-19 impact on renewables worldwide, aimed at curbing the spread of the coronavirus.

Eskom, which is mired in a financial crisis and has struggled to keep the lights on in the past year, said on Tuesday that power demand had dropped by more than 7,500 megawatts since the lockdown started on Friday and that it had taken offline some of its own generators.

The utility supplements its generating capacity, which is mainly derived from coal, by buying power from solar and wind farms, as wind becomes a competitive source of electricity globally, under contracts signed as part of the government’s renewable energy programme.

Spokesman Sikonathi Mantshantsha said Eskom had not yet curtailed power procurement from wind farms but that it had told them, echoing industry warnings on wind investment risk seen by the sector, this could happen “for a few hours a day during the next few days, perhaps until the lockdown is lifted”.

“Most of them are able to feed power into the grid in the early hours of the day. That coincides with the lowest demand period and can highlight curtailment challenges when supply exceeds need. And we now have a lot more capacity than needed,” Mantshantsha said.

During the lockdown imposed by President Cyril Ramaphosa, businesses apart from those deemed “essential services” are closed, mirroring Spanish wind factory closures elsewhere. Many power-hungry mines and furnaces have suspended operations.

Eskom has relatively little of its own “flexible generation” capacity, which can be ramped up or down easily, unlike regions riding a renewables boom in South Australia to export power.

The government has committed to buy up to 200 billion rand ($11.1 billion) of electricity from independent power producers and has issued state guarantees for those purchases.

“They will be compensated for their losses, amid U.S. utility-solar slowdowns being reported - each day lost will be added to their contracts,” Mantshantsha said of the wind farms. “In the end they will not be worse off.”


Related News

View more

In 2021, 40% Of The Electricity Produced In The United States Was Derived From Non-Fossil Fuel Sources

Renewable Electricity Generation is accelerating the shift from fossil fuels, as wind, solar, and hydro boost the electric power sector, lowering emissions and overtaking nuclear while displacing coal and natural gas in the U.S. grid.


Key Points

Renewable electricity generation is power from non-fossil sources like wind, solar, and hydro to cut emissions.

✅ Driven by wind, solar, and hydro adoption

✅ Reduces fossil fuel dependence and emissions

✅ Increasing share in the electric power sector


The transition to electric vehicles is largely driven by a need to reduce our reliance on fossil fuels and reduce emissions associated with burning fossil fuels, while declining US electricity use also shapes demand trends in the power sector. In 2021, 40% of the electricity produced by the electric power sector was derived from non-fossil fuel sources.

Since 2007, the increase in non-fossil fuel sources has been largely driven by “Other Renewables” which is predominantly wind and solar. This has resulted in renewables (including hydroelectric) overtaking nuclear power’s share of electricity generation in 2021 for the first time since 1984. An increasing share of electricity generation from renewables has also led to a declining share of electricity from fossil fuel sources like coal, natural gas, and petroleum, with renewables poised to eclipse coal globally as deployment accelerates.

Includes net generation of electricity from the electric power sector only, and monthly totals can fluctuate, as seen when January power generation jumped on a year-over-year basis.

Net generation of electricity is gross generation less the electrical energy consumed at the generating station(s) for station service or auxiliaries, and the projected mix of sources is sensitive to policies and natural gas prices over time. Electricity for pumping at pumped-storage plants is considered electricity for station service and is deducted from gross generation.

“Natural Gas” includes blast furnace gas and other manufactured and waste gases derived from fossil fuels, while in the UK wind generation exceeded coal for the first time in 2016.

“Other Renewables” includes wood, waste, geo-thermal, solar and wind resources among others.

“Other” category includes batteries, chemicals, hydrogen, pitch, purchased steam, sulfur, miscellaneous technologies, and, beginning in 2001, non-renewable waste (municipal solid waste from non-biogenic sources, and tire-derived fuels), noting that trends vary by country, with UK low-carbon generation stalling in 2019.


Related News

View more

Sign Up for Electricity Forum’s Newsletter

Stay informed with our FREE Newsletter — get the latest news, breakthrough technologies, and expert insights, delivered straight to your inbox.

Electricity Today T&D Magazine Subscribe for FREE

Stay informed with the latest T&D policies and technologies.
  • Timely insights from industry experts
  • Practical solutions T&D engineers
  • Free access to every issue

Live Online & In-person Group Training

Advantages To Instructor-Led Training – Instructor-Led Course, Customized Training, Multiple Locations, Economical, CEU Credits, Course Discounts.

Request For Quotation

Whether you would prefer Live Online or In-Person instruction, our electrical training courses can be tailored to meet your company's specific requirements and delivered to your employees in one location or at various locations.