CSA Z463 Electrical Maintenance -
Our customized live online or in‑person group training can be delivered to your staff at your location.

- Live Online
- 6 hours Instructor-led
- Group Training Available
Regular Price:
$249
Coupon Price:
$199
China Power Capacity 2020 Forecast highlights rising demand, installed capacity mix, coal-fired efficiency, non-fossil growth in wind, solar, hydropower, and nuclear, per CEC projections, with kWh consumption surging and standard coal savings targeted.
Context and Background
CEC outlook for China's 2020 power demand and capacity mix, with coal efficiency gains and non-fossil growth.
- Electricity demand 2020: 8,000-8,810 billion kWh; growth 4.6-6.6%.
- Installed capacity 2020: 1.935 billion kW (CEC estimate).
- Coal-fired 1.17 billion kW; efficiency upgrades and savings.
- Non-fossil mix: hydro 420 GW, wind 180 GW, solar 25 GW.
- Targeted coal savings by 2020: about 235 million mt per year.
a is expected to consume 270 million mt/year less standard coal equivalent for electricity generation by 2015, compared with 2011 levels, China Electricity Council said in a report Monday.
This will be achieved through development of more non-fossil energies, alongside power sector reforms advancing, and improving coal consuming technologies, the report said. By 2020, China's electricity industry is estimated to save about 235 million mt/year of standard coal equivalent compared with the coal consumption level in 2015.
In 2011, China's electric power generation sector consumed coal at an average rate of 330g/kWh of electricity generated, down 3g/kWh, or 0.9, year-on-year. China's coal-fired power output totaled 3,825.32 billion kWh in 2011, up 14% year-on-year overall. As such, China's coal-fired power sector consumed a total of 1.262 billion mt of standard coal equivalent in 2011, according to Platts calculations.
China's national electricity consumption is estimated by CEC to reach the range of 6,020 billion - 6,610 billion kWh/year in 2015, with an annual growth rate of 7.5-9.5 from 2011 through 2015, the CEC report said, even as coal costs for electricity were rising. By 2020, China's electricity consumption is estimated to reach the range of 8,000 billion kWh - 8,810 billion kWh/year, with an annual growth rate of 4.6-6.6 from 2016 through 2020.
To meet electricity demand, CEC estimates that China's national installed capacity will reach 1.463 billion kW by 2015, including 342 million kW of hydropower, 928 million kW of coal-fired power capacity as projected, 43 million kW of nuclear power, 40 million kW of natural gas-fired power, 100 million kW of wind power, 5 million kW of solar power, and 5 million kW of biological and other energies.
By 2020, China's national installed capacity is estimated to reach 1.935 billion kW, including 420 million kW of hydropower, 1.17 billion kW of coal-fired power, 80 million kW of nuclear power, 50 million kW of natural gas-fired power, 180 million kW of wind power, 25 million kW of solar power, and 10 million kW of biological and other energies.
China consumed 4,690 billion kWh of electricity in 2011, up 11.7 year-on-year and following a 2010 power consumption increase reported by CEC, at the end of 2011, China's national installed capacity totaled 1.056 billion kW, up 9.2 year-on-year, as reported previously.
Related News
Related News
Why electric buses haven't taken over the world—yet
Electric Buses reduce urban emissions and noise, but require charging infrastructure, grid upgrades, and depot…
View more

Cheap oil contagion is clear and present danger to Canada
Canada Oil Recession Outlook analyzes the Russia-Saudi price war, OPEC discord, COVID-19 demand shock, WTI…
View more
California avoids widespread rolling blackouts as heat strains power grid
California Heat Wave Grid Emergency sees CAISO issue Stage 3 alerts as record demand, extreme…
View more

Hydro-Québec puts global ambitions on hold as crisis weighs on demand
Hydro-Que9bec COVID-19 M&A Pause signals a halt to international expansion as falling electricity demand, weaker…
View more
Starting Texas Schools After Labor Day: Power Grid and Cost Benefits?
Texas After-Labor Day School Start could ease ERCOT's power grid strain by shifting peak demand,…
View more
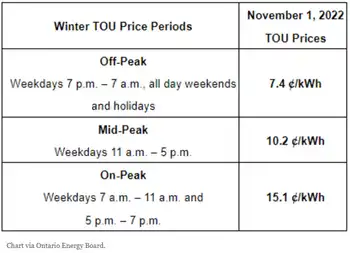
Electricity rates are about to change across Ontario
Ontario Electricity Rate Changes lower OEB Regulated Price Plan costs, adjust Time-of-Use winter hours and…
View more
Sign Up for Electricity Forum’s Newsletter
Stay informed with our FREE Newsletter — get the latest news, breakthrough technologies, and expert insights, delivered straight to your inbox.
Electricity Today T&D Magazine Subscribe for FREE

Stay informed with the latest T&D policies and technologies.
- Timely insights from industry experts
- Practical solutions T&D engineers
- Free access to every issue

