$1 billion per year is being spent to support climate change denial


climate change denial

CSA Z462 Arc Flash Training - Electrical Safety Essentials

Our customized live online or in‑person group training can be delivered to your staff at your location.

  • Live Online
  • 6 hours Instructor-led
  • Group Training Available
Regular Price:
$249
Coupon Price:
$199
Reserve Your Seat Today

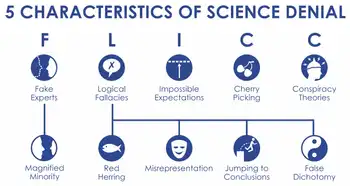
Climate Change Consensus and Disinformation highlights the 97% peer-reviewed agreement on human-caused warming, IPCC warnings, and how fossil fuel lobbying, misinformation, and astroturf tactics echo tobacco denial to mislead media and voters.


Key Points

Explains the 97% scientific consensus and the disinformation that obscures IPCC findings and misleads the public.

✅ 97% peer-reviewed consensus on human-caused climate change

✅ Fossil fuel funding drives denial and media misinformation

✅ IPCC and major scientific bodies confirm severe impacts


Orson Johnson says there is no scientific consensus on climate change. He’s wrong. A 2015 study by Drexel University’s Robert Brulle found that nearly $1 billion per year is being spent to support climate change denial. Electric utilities, fossil fuel and transportation sectors outspent environmental and renewable energy sectors by more than 10-to-1, undermining efforts to achieve net-zero electricity emissions globally. It is virtually the same strategy that tobacco companies used to deny the dangers of tobacco smoke, spending hundreds of millions of dollars to delay recognition of harm from tobacco smoke for decades, and today Trump's oil policies can similarly influence Wall Street's energy strategy. These are the same debunked sources Johnson quotes in his commentary.

The authors of six independent peer-reviewed papers on the consensus for human-caused climate change examined “the available studies and conclude that the finding of 97% consensus in published climate research is robust and consistent with other surveys of climate scientists and peer-reviewed studies,” according to an abstract in Environmental Research Letters, and public support for action is strong, with most Americans willing to contribute financially to climate solutions. Of the 30,000 scientists (people with a bachelor’s degree or higher in science) Johnson cites, only 39 specialized in climate science.

A new study by the U.N. Intergovernmental Panel on Climate Change draws on momentum from the Katowice climate summit to warn that “The consequences for nature and humanity are sweeping and severe.”

California’s Office of Planning and Research says: “Every major scientific organization in the United States with relevant expertise has confirmed the IPCC’s conclusion, including the National Academy of Sciences, the American Meteorological Society, the American Geophysical Union, and the American Association for the Advancement of Science. The list of international scientific organizations affirming the worldwide consensus on climate change is even longer.”

Former President Obama argued that decarbonization is irreversible as the clean-energy transition accelerates.

This issue is a symptom of an even larger problem. Recently, Facebook announced it would continue to allow political ads that contain obvious lies. America’s corporate news media has been following the same policy for years. Printing stories and commentary with information that is clearly not true or where data has been cherry-picked to strongly imply a lie, such as claims that Ottawa is making electricity more expensive for Albertans, sets up a false equivalence fallacy in which two incompatible arguments appear to be logically equivalent when, in fact, they are not.

Conservatives focus exclusively on progressive income taxes to argue that rich people pay a disproportionate share of taxes while ignoring that they take a disproportionate share of income, and federal income taxes account for less than half of taxes collected, with almost all of the other taxes being heavily regressive. Critics of single-payer healthcare disregard that almost every other developed country on earth has been using single-payer for decades to provide better care with universal coverage at roughly half the cost. Other examples abound, including recent policy milestones like the historic U.S. climate deal that nevertheless become targets of misinformation. We live in a society where truth is no longer truth, reality is supplanted by alternative facts and where crippling polarization is driven by the inability to agree on basic facts.

Related News

Paris Finalises Energy Roadmap for 2025–2035 with Imminent Decree

France 2025–2035 Energy Roadmap accelerates carbon neutrality via renewables expansion, energy efficiency, EV adoption, heat pumps, hydrogen, CCS, nuclear buildout, and wind and solar targets, cutting fossil fuels and emissions across transport, housing, industry.


Key Points

A national plan to cut fossil use and emissions, boost renewables, and scale efficiency and clean technologies.

✅ Cuts fossil share to 30% by 2035 with efficiency gains

✅ Scales solar PV and wind; revives nuclear with EPR 2

✅ Electrifies transport and industry with EVs, hydrogen, CCS


Paris is on the verge of finalising its energy roadmap for the period 2025–2035, with an imminent decree expected to be published by the end of the first quarter of 2025. This roadmap is part of France's broader strategy to achieve carbon neutrality by 2050, aligning with wider moves toward clean electricity regulations in other jurisdictions.

Key Objectives of the Roadmap

The energy roadmap outlines ambitious targets for reducing greenhouse gas emissions across various sectors, including transport, housing, food, and energy. The primary goals are:

  • Reducing Fossil Fuel Dependency: Building on the EU's plan to dump Russian energy, the share of fossil fuels in final energy consumption is to fall from 60% in 2022 to 42% in 2030 and 30% in 2035.

  • Enhancing Energy Efficiency: A target of a 28.6% reduction in energy consumption between 2012 and 2030 is set, focusing on conservation and energy efficiency measures.

  • Expanding Decarbonised Energy Production: The roadmap aims to accelerate the development of renewable energies and the revival.

Sector-Specific Targets

  • Transport: The government aims to cut emissions by 31, focusing on the growth of electric vehicles, increasing public transport, and expanding charging infrastructure.

  • Housing: Emissions from buildings are to be reduced by 44%, with plans to replace 75% of oil-fired and install 1 million heat pumps.

  • Agriculture and Food: The roadmap includes measures to reduce emissions from agriculture by 9%, promoting organic farming and reducing the use of nitrogen fertilizers.

  • Industry: A 37% reduction in emissions is targeted through the use of electricity, biomass, hydrogen, and CO₂ capture and storage technologies informed by energy technology pathways outlined in ETP 2017.

Renewable Energy Targets

The roadmap sets ambitious targets for renewable energy production that align with Europe's ongoing electricity market reform efforts:

  • Photovoltaic Power: A sixfold increase in photovoltaic power between 2022

  • Offshore Wind Power: Reaching 18 gigawatts up from 0.6 GW

  • Onshore Wind Power: Doubling capacity from 21 GW to 45 GW over the same period.

  • Nuclear Power: The commissioning of the evolutionary power and the construction of six EPR 2 reactors, underpinned by France's deal on electricity prices with EDF to support long-term investment, with the potential for eight more.
     

Implementation and Governance

The final version of the roadmap will be adopted by decree, alongside a proposed electricity pricing scheme to address EU concerns, rather than being enshrined in law as required by the Energy Code. The government had previously abandoned the energy-climate planning. The decree is expected to be published at the end of the Multiannual Energy Program (PPE) and in the second half of the third National Low-Carbon Strategy (SNBC).

Paris's finalisation of its energy roadmap for 2025–2035 marks a significant step towards achieving carbon neutrality by 2050. The ambitious targets set across various sectors reflect a comprehensive approach to reducing greenhouse gas emissions and transitioning to a more sustainable energy system amid the ongoing EU electricity reform debate shaping market rules. The imminent decree will provide the legal framework necessary to implement these plans and drive the necessary changes across the country.


Related News

View more

B.C. Hydro doing good job managing billions in capital assets, says auditor

BC Hydro Asset Management Audit confirms disciplined oversight of dams, generators, power lines, substations, and transformers, with robust lifecycle planning, reliability metrics, and capital investment sustaining aging infrastructure and near full-capacity performance.


Key Points

Audit confirming BC Hydro's asset governance and lifecycle planning, ensuring safe, reliable grid infrastructure.

✅ $25B in assets; many facilities operating near full capacity.

✅ 80% of assets are dams, generators, lines, poles, substations, transformers.

✅ $2.5B invested in renewal, repair, and replacement in fiscal 2018.


A report by B.C.’s auditor-general says B.C. Hydro is doing a good job managing the province’s dams, generating stations and power lines, including storm response during severe weather events.

Carol Bellringer says in the audit that B.C. Hydro’s assets are valued at more than $25 billion and even though some generating facilities are more than 85 years old they continue to operate near full-capacity and can accommodate holiday demand peaks when needed.

The report says about 80 per cent of Hydro’s assets are dams, generators, power lines, poles, substations and transformers that are used to provide electrical service to B.C., where residential electricity use shifted during the pandemic.

The audit says Hydro invested almost $2.5 billion to renew, repair or replace the assets it manages during the last fiscal year, ending March 31, 2018, and, in a broader context, bill relief has been offered to only part of the province.

Bellringer’s audit doesn’t examine the $10.7 billion Site C dam project, which is currently under construction in northeast B.C. and not slated for completion until 2024.

She says the audit examined whether B.C. Hydro has the information, practices, processes and systems needed to support good asset management, at a time when other utilities are dealing with pandemic impacts on operations.


Related News

View more

WY Utility's First Wind Farm Faces Replacement

Foote Creek I Wind Farm Repowering upgrades Wyoming turbines with new nacelles, towers, and blades, cutting 68 units to 12 while sustaining 41.6 MW, under PacifiCorp and Rocky Mountain Power's Energy Vision 2020 plan.


Key Points

Replacement at Foote Creek Rim I, cutting to 12 turbines while sustaining about 41.6 MW using modern 2-4.2 MW units.

✅ 12 turbines replace 68, output steady near 41.6 MW

✅ New nacelles, towers, blades; taller 500 ft turbines

✅ Part of PacifiCorp Energy Vision 2020 and Gateway West


A Wyoming utility company has filed a permit to replace its first wind farm—originally commissioned in 1998, composed of over 65 turbines—amid new gas capacity competing with nuclear in Ohio, located at Foote Creek Rim I. The replacement would downsize the number of turbines to 12, which would still generate roughly the same energy output.

According to the Star Tribune, PacifiCorp’s new installation would involve new nacelles, new towers and new blades. The permit was filed with Carbon County.


New WY Wind Farm

The replacement wind turbines will stand more than twice as tall as the old: Those currently installed stand 200 feet tall, whereas their replacements will tower closer to 500 feet. Though this move is part of the company’s overall plan to expand its state wind fleet as some utilities respond to declining coal returns in the Midwest, the work going into the Foote Creek site is somewhat special, noted David Eskelsen, spokesperson for Rocky Mountain Power, the western arm of PacifiCorp.

“Foote Creek I repowering is somewhat different from the repowering projects announced in the (Energy Vision) 2020 initiative,” he said. “Foote Creek is a complete replacement of the existing 68 foundations, towers, turbine nacelles and rotors (blades).”

Currently, the turbines at Foote Creek have 600 kilowatts capacity each; the replacements’ maximum production ranges from 2 megawatts to 4.2 megawatts each, with the total output remaining steady at 41.4 megawatts, a scale similar to a 30-megawatt wind expansion in Eastern Kings, though there will be a slight capacity increase to 41.6 megawatts, according to the Star Tribune.

As part of the wind farm repowering initiative, PacifiCorp is to become full owner and operator of the Foote Creek site. When the farm was originally built, an Oregon-based water and electric board was 21 percent owner; 37 percent of the project’s output was tied into a contract with the Bonneville Power Administration.

Otherwise, PacifiCorp is moving to further expand its state wind fleet in line with initiatives like doubling renewable electricity by 2030 in Saskatchewan, with the addition of three new wind farms—to be located in Carbon, Albany and Converse counties—which may add up to 1,150 megawatts of power.

According to PacifiCorp, the company has more than 1,000 megawatts of owned wind generation capability, along with long-term purchase agreements for more than 600 megawatts from other wind farms owned by other entities. Energy Vision 2020 refers to a $3.5 billion investment and company move that is looking to upgrade the company's existing wind fleet with newer technology, adding 1,150 megawatts of new wind resources by 2020 and a a new 140-mile Gateway West transmission segment in Wyoming, comparable to a transmission project in Missouri just energized.


Related News

View more

Electricity and water do mix: How electric ships are clearing the air on the B.C. coast

Hybrid Electric Ships leverage marine batteries, LNG engines, and clean propulsion to cut emissions in shipping. From ferries to cargo vessels, electrification and sustainability meet IMO regulations, Corvus Energy systems, and dockside fast charging.


Key Points

Hybrid electric ships use batteries with diesel or LNG engines to cut fuel and emissions and meet stricter IMO rules.

✅ LNG or diesel gensets recharge marine battery packs.

✅ Cuts CO2, NOx, and particulate emissions in port and at sea.

✅ Complies with IMO standards; enables quiet, efficient operations.


The river is running strong and currents are swirling as the 150-metre-long Seaspan Reliant slides gently into place against its steel loading ramp on the shores of B.C.'s silty Fraser River.

The crew hustles to tie up the ship, and then begins offloading dozens of transport trucks that have been brought over from Vancouver Island.

While it looks like many vessels working the B.C. coast, below decks, the ship is very different. The Reliant is a hybrid, partly powered by electricity, and joins BC Ferries' hybrid ships in the region, the seagoing equivalent of a Toyota Prius.

Down below decks, Sean Puchalski walks past a whirring internal combustion motor that can run on either diesel or natural gas. He opens the door to a gleaming white room full of electrical cables and equipment racks along the walls.

"As with many modes of transportation, we're seeing electrification, from electric planes to ferries," said Puchalski, who works with Corvus Energy, a Richmond, B.C. company that builds large battery systems for the marine industry.

In this case, the batteries are recharged by large engines burning natural gas.

"It's definitely the way of the future," said Puchalski.

The 10-year-old company's battery system is now in use on 200 vessels around the world. Business has spiked recently, driven by the need to reduce emissions, and by landmark projects such as battery-electric high-speed ferries taking shape in the U.S.

"When you're building a new vessel, you want it to last for, say, 30 years. You don't want to adopt a technology that's on the margins in terms of obsolescence," said Puchalski. "You want to build it to be future-proof."


Dirty ships

For years, the shipping industry has been criticized for being slow to clean up its act. Most ships use heavy fuel oil, a cheap, viscous form of petroleum that produces immense exhaust. According to the European Commission, shipping currently pumps out about 940 million tonnes of CO2 each year, nearly three per cent of the global total.

That share is expected to climb even higher as other sectors reduce emissions.

When it comes to electric ships, Scandinavia is leading the world. Several of the region's car and passenger ferries are completely battery powered — recharged at the dock by relatively clean hydro power, and projects such as Kootenay Lake's electric-ready ferry show similar progress in Canada.


Tougher regulations and retailer pressure

The push for cleaner alternatives is being partly driven by worldwide regulations, with international shipping regulators bringing in tougher emission standards after a decade of talk and study, while financing initiatives are helping B.C. electric ferries scale up.

At the same time, pressure is building from customers, such as Mountain Equipment Co-op, which closely tracks its environmental footprint. Kevin Lee, who heads MEC's supply chain, said large companies are realizing they are accountable for their contributions to climate change, from the factory to the retail floor.

"You're hearing more companies build it into their DNA in terms of how they do business, and that's cool to see," said Lee. "It's not just MEC anymore trying to do this, there's a lot more partners out there."

In the global race to cut emissions, all kinds of options are on the table for ships, including giant kites being tested to harvest wind power at sea, and ports piloting hydrogen-powered cranes to cut dockside emissions.

Modern versions of sailing ships are also being examined to haul cargo with minimal fuel consumption.

But in practical terms, hybrids and, in the future, pure electrics are likely to play a larger role in keeping the propellers turning along Canada's coast, with neighboring fleets like Washington State Ferries' upgrade underscoring the shift.


Related News

View more

Power Outage Disrupts Morning Routine for Thousands in London

London, Ontario Power Outage disrupts the electricity grid, causing a citywide blackout, stalled commuters, dark traffic signals, and closed businesses, as London Hydro crews race restoration after a transformer malfunction and infrastructure failures.


Key Points

A blackout caused by a transformer malfunction, disrupting commuters, businesses, and traffic across London, Ontario.

✅ Traffic signals dark; delays and congestion citywide

✅ London Hydro crews repairing malfunctioning transformer

✅ Businesses closed; transit routes delayed and rerouted


A widespread power outage early Monday morning left thousands of residents in London, Ontario, without electricity, causing significant disruption for commuters and businesses at the start of the workday. The outage, which affected several neighborhoods across the city, lasted for hours, creating a chaotic morning as residents scrambled to adjust to the unexpected interruption.

The Outage Strikes

The power failure was first reported at approximately 6:30 a.m., catching many off guard as they began their day. The affected areas included several busy neighborhoods, with power lines down and substations impacted, issues that windstorms often exacerbate for utilities. Early reports indicated that the outage was caused by a combination of issues, including technical failures and possible equipment malfunctions. London Hydro, the city's primary electricity provider, responded quickly to the situation, assuring residents that crews were dispatched to restore power as soon as possible.

"Crews are on site and working hard to restore power to those affected," a spokesperson for London Hydro said. "We understand the frustration this causes and are doing everything we can to get the power back on as soon as possible."

Impact on Commuters and Businesses

The power outage had an immediate impact on the morning commute. Traffic lights across the affected areas were down, leading to delays and rush-hour disruptions at major intersections. Drivers were forced to navigate through intersections without traffic control, creating an additional layer of complexity for those trying to get to work or school.

Public transit was also affected, with some bus routes delayed due to the power loss at key transit stations. The situation added further stress to commuters already dealing with the challenges of a typical Monday morning rush.

Businesses in the affected neighborhoods faced a variety of challenges. Some were forced to close early or delay their opening hours due to a lack of electricity. Many shops and offices struggled with limited access to the internet and phone lines, which hindered their ability to process orders and serve customers. Local coffee shops, often a go-to for busy workers, were also unable to operate their coffee machines or provide basic services, forcing customers to go without their usual morning caffeine fix.

"For a lot of people, it's their first stop in the morning," said one local business owner. "It’s frustrating because we rely on power to function, and with no warning, we had to turn away customers."

The Response

As the hours ticked by, residents were left wondering when the power would return. London Hydro’s social media accounts were filled with updates, keeping residents informed about the restoration efforts, a practice echoed when BC Hydro crews responded during an atypical storm. The utility company urged those who were experiencing issues to report them online to help prioritize repair efforts.

"We are aware that many people are affected, and our teams are working tirelessly to restore power," the utility posted on Twitter. "Please stay safe, and we thank you for your patience."

Throughout the morning, the power was gradually restored to different areas of the city. However, some parts remained without electricity well into the afternoon, a situation reminiscent of extended outages that test city resilience. London Hydro confirmed that the outage was caused by a malfunctioning transformer, and the necessary repairs would take time to complete.

Long-Term Effects and Community Concerns

While the immediate effects of the outage were felt most acutely during the morning hours, some residents expressed concern about the potential long-term effects. The city’s reliance on a stable electricity grid became a focal point of discussion, with many wondering if similar outages could occur in the future, as seen in the North Seattle outage earlier this year.

"I understand that things break, but it’s frustrating that it took so long for power to come back," said a London resident. "This isn’t the first time something like this has happened, and it makes me wonder about the reliability of our infrastructure."

City officials responded by reassuring residents that efforts are underway to upgrade the city's infrastructure to prevent such outages from happening in the future. A report released by London Hydro highlighted ongoing investments in upgrading transformers and other key components of the city's power grid. Province-wide, Hydro One restored power to more than 277,000 customers after damaging storms, underscoring the scale of upgrades needed. Despite these efforts, however, experts warn that older infrastructure in some areas may still be vulnerable to failure, especially during extreme weather events or other unforeseen circumstances.

The morning outage serves as a reminder of how reliant modern cities are on stable electricity networks. While the response from London Hydro was swift and effective in restoring power, it’s clear that these types of events can cause significant disruptions to daily life. As the city moves forward, many are calling for increased investment in infrastructure and proactive measures to prevent future outages, especially after Toronto outages persisted following a spring storm in the region.

In the meantime, Londoners have adapted, finding ways to go about their day as best they can. For some, it’s a reminder of the importance of preparedness in an increasingly unpredictable world. Whether it’s an extra flashlight or a backup power source, residents are learning to expect the unexpected and be ready for whatever the next workday might bring.


Related News

View more

UK low-carbon electricity generation stalls in 2019

UK low-carbon electricity 2019 saw stalled growth as renewables rose slightly, wind expanded, nuclear output fell, coal hit record lows, and net-zero targets demand faster deployment to cut CO2 intensity below 100gCO2/kWh.


Key Points

Low-carbon sources supplied 54% of UK power in 2019, up just 1TWh; wind grew, nuclear fell, and coal dropped to 2%.

✅ Wind up 8TWh; nuclear down 9TWh amid outages

✅ Fossil fuels 43% of generation; coal at 2%

✅ Net-zero needs 15TWh per year added to 2030


The amount of electricity generated by low-carbon sources in the UK stalled in 2019, Carbon Brief analysis shows.

Low-carbon electricity output from wind, solar, nuclear, hydro and biomass rose by just 1 terawatt hour (TWh, less than 1%) in 2019. It represents the smallest annual increase in a decade, where annual growth averaged 9TWh. This growth will need to double in the 2020s to meet UK climate targets while replacing old nuclear plants as they retire.

Some 54% of UK electricity generation in 2019 came from low-carbon sources, including 37% from renewables and 20% from wind alone, underscoring wind's leading role in the power mix during key periods. A record-low 43% was from fossil fuels, with 41% from gas and just 2% from coal, also a record low. In 2010, fossil fuels generated 75% of the total.

Carbon Brief’s analysis of UK electricity generation in 2019 is based on figures from BM Reports and the Department for Business, Energy and Industrial Strategy (BEIS). See the methodology at the end for more on how the analysis was conducted.

The numbers differ from those published earlier in January by National Grid, which were for electricity supplied in Great Britain only (England, Wales and Scotland, but excluding Northern Ireland), including via imports from other countries.

Low-carbon low
In 2019, the UK became the first major economy to target net-zero greenhouse gas emissions by 2050, increasing the ambition of its legally binding Climate Change Act.

To date, the country has cut its emissions by around two-fifths since 1990, with almost all of its recent progress coming from the electricity sector.

Emissions from electricity generation have fallen rapidly in the decade since 2010 as coal power has been almost phased out and even gas output has declined. Fossil fuels have been displaced by falling demand and by renewables, such as wind, solar and biomass.

But Carbon Brief’s annual analysis of UK electricity generation shows progress stalled in 2019, with the output from low-carbon sources barely increasing compared to a year earlier.

The chart below shows low-carbon generation in each year since 2010 (grey bars) and the estimated level in 2019 (red). The pale grey bars show the estimated future output of existing low-carbon sources after old nuclear plants retire and the pale red bars show the amount of new generation needed to keep electricity sector emissions to less than 100 grammes of CO2 per kilowatt hour (gCO2/kWh), the UK’s nominal target for the sector.

 Annual electricity generation in the UK by fuel, terawatt hours, 2010-2019. Top panel: fuel by fuel. Bottom panel: cumulative total generation from all sources. Source: BEIS energy trends, BM Reports and Carbon Brief analysis. Chart by Carbon Brief using Highcharts.
As the chart shows, the UK will require significantly more low-carbon electricity over the next decade as part of meeting its legally binding climate goals.

The nominal 100gCO2/kWh target for 2030 was set in the context of the UK’s less ambitious goal of cutting emissions to 80% below 1990 levels by 2050. Now that the country is aiming to cut emissions to net-zero by 2050, that 100gCO2/kWh indicator is likely to be the bare minimum.

Even so, it would require a rapid step up in the pace of low-carbon expansion, compared to the increases seen over the past decade. On average, low-carbon generation has risen by 9TWh each year in the decade since 2010 – including a rise of just 1TWh in 2019.

Given scheduled nuclear retirements and rising demand expected by the Committee on Climate Change (CCC) – with some electrification of transport and heating – low-carbon generation would need to increase by 15TWh each year until 2030, just to meet the benchmark of 100gCO2/kWh.

For context, the 3.2 gigawatt (GW) Hinkley C new nuclear plant being built in Somerset will generate around 25TWh once completed around 2026. The world’s largest offshore windfarm, the 1.2GW Hornsea One scheme off the Yorkshire coast, will generate around 5TWh each year.

The new Conservative government is targeting 40GW of offshore wind by 2030, up from today’s figure of around 8GW. If policies are put in place to meet this goal, then it could keep power sector emissions below 100gCO2/kWh, depending on the actual performance of the windfarms built.

However, new onshore wind and solar, further new nuclear or other low-carbon generation, such as gas with carbon capture and storage (CCS), is likely to be needed if demand is higher than expected, or if the 100gCO2/kWh benchmark is too weak in the context of net-zero by 2050.

The CCC says it is “likely” to “reflect the need for more rapid deployment” of low-carbon towards net-zero emissions in its advice on the sixth UK carbon budget for 2033-2037, due in September.

Trading places
Looking more closely at UK electricity generation in 2019, Carbon Brief’s analysis shows why there was so little growth for low-carbon sources compared to the previous year.

There was another increase for wind power in 2019 (up 8TWh, 14%), with record wind generation as several large new windfarms were completed including the 1.2GW Hornsea One project in October and the 0.6GW Beatrice offshore windfarm in Q2 of 2019. But this was offset by a decline for nuclear (down 9TWh, 14%), due to ongoing outages for reactors at Hunterston in Scotland and Dungeness in Kent.

(Analysis of data held by trade organisation RenewableUK suggests some 0.6GW of onshore wind capacity also started operating in 2019, including the 0.2GW Dorenell scheme in Moray, Scotland.)

As a result of these movements, the UK’s windfarms overtook nuclear for the first time ever in 2019, becoming the country’s second-largest source of electricity generation, and earlier, wind and solar together surpassed nuclear in the UK as momentum built. This is shown in the figure below, with wind (green line, top panel) trading places with nuclear (purple) and gas (dark blue) down around 25% since 2010 but remaining the single-largest source.

 Annual electricity generation in the UK by fuel, terawatt hours, 2010-2019. Top panel: fuel by fuel. Bottom panel: cumulative total generation from all sources. Source: BEIS energy trends, BM Reports and Carbon Brief analysis. Chart by Carbon Brief using Highcharts.
The UK’s currently suspended nuclear plants are due to return to service in January and March, according to operator EDF, the French state-backed utility firm. However, as noted above, most of the UK’s nuclear fleet is set to retire during the 2020s, with only Sizewell B in Suffolk due to still be operating by 2030. Hunterston is scheduled to retire by 2023 and Dungeness by 2028.

Set against these losses, the UK has a pipeline of offshore windfarms, secured via “contracts for difference” with the government, at a series of auctions. The most recent auction, in September 2019, saw prices below £40 per megawatt hour – similar to current wholesale electricity prices.

However, the capacity contracted so far is not sufficient to meet the government’s target of 40GW by 2030, meaning further auctions – or some other policy mechanism – will be required.

Coal zero
As well as the switch between wind and nuclear, 2019 also saw coal fall below solar for the first time across a full year, echoing the 2016 moment when wind outgenerated coal across the UK, after it suffered another 60% reduction in electricity output. Just six coal plants remain in the UK, with Aberthaw B in Wales and Fiddlers Ferry in Cheshire closing in March.

Coal accounted for just 2% of UK generation in 2019, a record-low coal share since centralised electricity supplies started to operate in 1882. The fuel met 40% of UK needs as recently as 2012, but has plummeted thanks to falling demand, rising renewables, cheaper gas and higher CO2 prices.

The reduction in average coal generation hides the fact that the fuel is now often not required at all to meet the UK’s electricity needs. The chart below shows the number of days each year when coal output was zero in 2019 (red line) and the two previous years (blue).

 Cumulative number of days when UK electricity generation from renewable sources has been higher than that from fossil fuels. Source: BEIS energy trends, BM Reports and Carbon Brief analysis. Chart by Carbon Brief using Highcharts.
The 83 days in 2019 with zero coal generation amount to nearly a quarter of the year and include the record-breaking 18-day stretch without the fuel.

Great Britain has been running for a record TWO WEEKS without using coal to generate electricity – the first time this has happened since 1882.

The country’s grid has been coal-free for 45% of hours in 2019 so far.https://www.carbonbrief.org/countdown-to-2025-tracking-the-uk-coal-phase-out …

Coal generation was set for significant reductions around the world in 2019 – including a 20% reduction for the EU as a whole – according to analysis published by Carbon Brief in November.

Notably, overall UK electricity generation fell by another 9TWh in 2019 (3%), bringing the total decline to 58TWh since 2010. This is equivalent to more than twice the output from the Hinkley C scheme being built in Somerset. As Carbon Brief explained last year, falling demand has had a similar impact on electricity-sector CO2 emissions as the increase in output from renewables.

This is illustrated by the fact that the 9TWh reduction in overall generation translated into a 9TWh (6%) cut in fossil-fuel generation during 2019, with coal falling by 10TWh and gas rising marginally.

Increasingly renewable
As fossil-fuel output and overall generation have declined, the UK’s renewable sources of electricity have continued to increase. Their output has risen nearly five-fold in the past decade and their share of the UK total has increased from 7% in 2010 to 37% in 2019.

As a result, the UK’s increasingly renewable grid is seeing more minutes, hours and days during which the likes of wind, solar and biomass collectively outpace all fossil fuels put together, and on some days wind is the main source as well.

The chart below shows the number of days during each year when renewables generated more electricity than fossil fuels in 2019 (red line) and each of the previous four years (blue lines). In total, nearly two-fifths of days in 2019 crossed this threshold.

 Cumulative number of days when the UK has not generated any electricity from coal. Source: BEIS energy trends, BM Reports and Carbon Brief analysis. Chart by Carbon Brief using Highcharts.
There were also four months in 2019 when renewables generated more of the UK’s electricity than fossil fuels: March, August, September and December. The first ever such month came in September 2018 and more are certain to follow.

National Grid, which manages Great Britain’s high-voltage electricity transmission network, is aiming to be able to run the system without fossil fuels by 2025, at least for short periods. At present, it sometimes has to ask windfarm operators to switch off and gas plants to start running in order to keep the electricity grid stable.

Note that biomass accounted for 11% of UK electricity generation in 2019, nearly a third of the total from all renewables. Some two-thirds of the biomass output is from “plant biomass”, primarily wood pellets burnt at Lynemouth in Northumberland and the Drax plant in Yorkshire. The remainder was from an array of smaller sites based on landfill gas, sewage gas or anaerobic digestion.

The CCC says the UK should “move away” from large-scale biomass power plants, once existing subsidy contracts for Drax and Lynemouth expire in 2027.

Using biomass to generate electricity is not zero-carbon and in some circumstances could lead to higher emissions than from fossil fuels. Moreover, there are more valuable uses for the world’s limited supply of biomass feedstock, the CCC says, including carbon sequestration and hard-to-abate sectors with few alternatives.

Methodology
The figures in the article are from Carbon Brief analysis of data from BEIS Energy Trends chapter 5 and chapter 6, as well as from BM Reports. The figures from BM Reports are for electricity supplied to the grid in Great Britain only and are adjusted to include Northern Ireland.

In Carbon Brief’s analysis, the BM Reports numbers are also adjusted to account for electricity used by power plants on site and for generation by plants not connected to the high-voltage national grid. This includes many onshore windfarms, as well as industrial gas combined heat and power plants and those burning landfill gas, waste or sewage gas.

By design, the Carbon Brief analysis is intended to align as closely as possible to the official government figures on electricity generated in the UK, reported in BEIS Energy Trends table 5.1.

Briefly, the raw data for each fuel is in most cases adjusted with a multiplier, derived from the ratio between the reported BEIS numbers and unadjusted figures for previous quarters.

Carbon Brief’s method of analysis has been verified against published BEIS figures using “hindcasting”. This shows the estimates for total electricity generation from fossil fuels or renewables to have been within ±3% of the BEIS number in each quarter since Q4 2017. (Data before then is not sufficient to carry out the Carbon Brief analysis.)

For example, in the second quarter of 2019, a Carbon Brief hindcast estimates gas generation at 33.1TWh, whereas the published BEIS figure was 34.0TWh. Similarly, it produces an estimate of 27.4TWh for renewables, against a BEIS figure of 27.1TWh.

National Grid recently shared its own analysis for electricity in Great Britain during 2019 via its energy dashboard, which differs from Carbon Brief’s figures.


Related News

View more

Sign Up for Electricity Forum’s Newsletter

Stay informed with our FREE Newsletter — get the latest news, breakthrough technologies, and expert insights, delivered straight to your inbox.

Electricity Today T&D Magazine Subscribe for FREE

Stay informed with the latest T&D policies and technologies.
  • Timely insights from industry experts
  • Practical solutions T&D engineers
  • Free access to every issue

Live Online & In-person Group Training

Advantages To Instructor-Led Training – Instructor-Led Course, Customized Training, Multiple Locations, Economical, CEU Credits, Course Discounts.

Request For Quotation

Whether you would prefer Live Online or In-Person instruction, our electrical training courses can be tailored to meet your company's specific requirements and delivered to your employees in one location or at various locations.