Four Facts about Covid and U.S. Electricity Consumption


charts

NFPA 70e Training - Arc Flash

Our customized live online or in‑person group training can be delivered to your staff at your location.

  • Live Online
  • 6 hours Instructor-led
  • Group Training Available
Regular Price:
$199
Coupon Price:
$149
Reserve Your Seat Today

COVID-19 Impact on U.S. Electricity Consumption shows commercial and industrial demand dropped as residential use rose, with flattened peak loads, weekday-weekend convergence, Texas hourly data, and energy demand as a real-time economic indicator.


Key Points

It reduced commercial and industrial demand while raising residential use, shifting peaks and weekday patterns.

✅ Commercial electricity down 12%; industrial down 14% in Q2 2020

✅ Residential use up 10% amid work-from-home and lockdowns

✅ Peaks flattened; weekday-weekend loads converged in Texas


This is an important turning point for the United States. We have a long road ahead. But one of the reasons I’m optimistic about Biden-Harris is that we will once again have an administration that believes in science.

To embrace this return to science, I want to write today about a fascinating new working paper by Tufts economist Steve Cicala.

Professor Cicala has been studying the effect of Covid on electricity consumption since back in March, when the Wall Street Journal picked up his work documenting an 18% decrease in electricity consumption in Italy.

The new work, focused on the United States, is particularly compelling because it uses data that allows him to distinguish between residential, commercial, and industrial sectors, against a backdrop of declining U.S. electricity sales over recent years.

Without further ado, here are four facts he uncovers about Covid and U.S. electricity demand during COVID-19 and consumption.


Fact #1: Firms Are Using Less
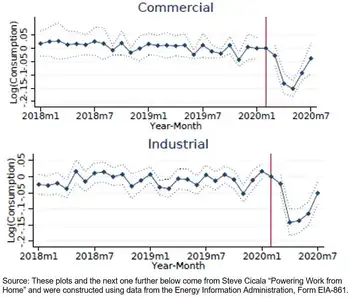
U.S. commercial electricity consumption fell 12% during the second quarter of 2020. U.S. industrial electricity consumption fell 14% over the same period.

This makes sense. The second quarter was by some measures, the worst quarter for the U.S. economy in over 145 years!

Economic activity shrank. Schools closed. Offices closed. Factories closed. Restaurants closed. Malls closed. Even health care offices closed as patients delayed going to the dentist and other routine care. All this means less heating and cooling, less lighting, less refrigeration, less power for computers and other office equipment, less everything.

The decrease in the industrial sector is a little more surprising. My impression had been that the industrial sector had not fallen as far as commercial, but amid broader disruptions in coal and nuclear power that strained parts of the energy economy, the patterns for both sectors are quite similar with the decline peaking in May and then partially rebounding by July. The paper also shows that areas with higher unemployment rates experienced larger declines in both sectors.


Fact #2: Households Are Using More
While firms are using less, households are using more. U.S. residential electricity consumption increased 10% during the second quarter of 2020. Consumption surged during March, April, and May, a reflection of the lockdown lifestyle many adopted, and then leveled off in June and July – with much less of the rebound observed on the commercial/industrial side.

This pattern makes sense, too. In Professor Cicala’s words, “people are spending an inordinate amount of time at home”. Many of us switched over to working from home almost immediately, and haven’t looked back. This means more air conditioning, more running the dishwasher, more CNN (especially last week), more Zoom, and so on.

The paper also examines the correlates of the decline. Areas in the U.S. where more people can work from home experienced larger increases. Unemployment rates, however, are almost completely uncorrelated with the increase.


Fact #3: Firms are Less Peaky
The paper next turns to a novel dataset from Texas, where Texas grid reliability is under active discussion, that makes it possible to measure hourly electricity consumption by sector.

As the figure above illustrates, the biggest declines in commercial/industrial electricity consumption have occurred Monday through Friday between 9AM and 5PM.

The dashed line shows the pattern during 2019. Notice the large spikes in electricity consumption during business hours. The solid line shows the pattern during 2020. Much smaller spikes during business hours.


Fact #4: Everyday is Like Sunday
Finally, we have what I would like to nominate as the “Energy Figure of the Year”.

Again, start with the pattern for 2019, reflected by the dashed line. Prior to Covid, Texas households used a lot more electricity on Saturdays and Sundays.

Then along comes Covid, and turned every day into the weekend. Residential electricity consumption in Texas during business hours Monday-Friday is up 16%(!).

In the pattern for 2020, it isn’t easy to distinguish weekends from weekdays. If you feel like weekdays and weekends are becoming a big blur – you are not alone.


Conclusion
Researchers are increasingly thinking about electricity consumption as a real-time indicator of economic activity, even as flat electricity demand complicates utility planning and investment. This is an intriguing idea, but Professor Cicala’s new paper shows that it is important to look sector-by-sector.

While commercial and industrial consumption indeed seem to measure the strength of an economy, residential consumption has been sharply countercylical – increasing exactly when people are not at work and not at school.

These large changes in behavior are specific to the pandemic. Still, with the increased blurring of home and non-home activities we may look back on 2020 as a key turning point in how we think about these three sectors of the economy.

More broadly, Professor Cicala’s paper highlights the value of social science research. We need facts, data, and yes, science, if we are to understand the economy and craft effective policies on energy insecurity and shut-offs as well.


Related News

Related News

UK low-carbon electricity generation stalls in 2019

UK low-carbon electricity 2019 saw stalled growth as renewables rose slightly, wind expanded, nuclear output fell, coal hit record lows, and net-zero targets demand faster deployment to cut CO2 intensity below 100gCO2/kWh.


Key Points

Low-carbon sources supplied 54% of UK power in 2019, up just 1TWh; wind grew, nuclear fell, and coal dropped to 2%.

✅ Wind up 8TWh; nuclear down 9TWh amid outages

✅ Fossil fuels 43% of generation; coal at 2%

✅ Net-zero needs 15TWh per year added to 2030


The amount of electricity generated by low-carbon sources in the UK stalled in 2019, Carbon Brief analysis shows.

Low-carbon electricity output from wind, solar, nuclear, hydro and biomass rose by just 1 terawatt hour (TWh, less than 1%) in 2019. It represents the smallest annual increase in a decade, where annual growth averaged 9TWh. This growth will need to double in the 2020s to meet UK climate targets while replacing old nuclear plants as they retire.

Some 54% of UK electricity generation in 2019 came from low-carbon sources, including 37% from renewables and 20% from wind alone, underscoring wind's leading role in the power mix during key periods. A record-low 43% was from fossil fuels, with 41% from gas and just 2% from coal, also a record low. In 2010, fossil fuels generated 75% of the total.

Carbon Brief’s analysis of UK electricity generation in 2019 is based on figures from BM Reports and the Department for Business, Energy and Industrial Strategy (BEIS). See the methodology at the end for more on how the analysis was conducted.

The numbers differ from those published earlier in January by National Grid, which were for electricity supplied in Great Britain only (England, Wales and Scotland, but excluding Northern Ireland), including via imports from other countries.

Low-carbon low
In 2019, the UK became the first major economy to target net-zero greenhouse gas emissions by 2050, increasing the ambition of its legally binding Climate Change Act.

To date, the country has cut its emissions by around two-fifths since 1990, with almost all of its recent progress coming from the electricity sector.

Emissions from electricity generation have fallen rapidly in the decade since 2010 as coal power has been almost phased out and even gas output has declined. Fossil fuels have been displaced by falling demand and by renewables, such as wind, solar and biomass.

But Carbon Brief’s annual analysis of UK electricity generation shows progress stalled in 2019, with the output from low-carbon sources barely increasing compared to a year earlier.

The chart below shows low-carbon generation in each year since 2010 (grey bars) and the estimated level in 2019 (red). The pale grey bars show the estimated future output of existing low-carbon sources after old nuclear plants retire and the pale red bars show the amount of new generation needed to keep electricity sector emissions to less than 100 grammes of CO2 per kilowatt hour (gCO2/kWh), the UK’s nominal target for the sector.

 Annual electricity generation in the UK by fuel, terawatt hours, 2010-2019. Top panel: fuel by fuel. Bottom panel: cumulative total generation from all sources. Source: BEIS energy trends, BM Reports and Carbon Brief analysis. Chart by Carbon Brief using Highcharts.
As the chart shows, the UK will require significantly more low-carbon electricity over the next decade as part of meeting its legally binding climate goals.

The nominal 100gCO2/kWh target for 2030 was set in the context of the UK’s less ambitious goal of cutting emissions to 80% below 1990 levels by 2050. Now that the country is aiming to cut emissions to net-zero by 2050, that 100gCO2/kWh indicator is likely to be the bare minimum.

Even so, it would require a rapid step up in the pace of low-carbon expansion, compared to the increases seen over the past decade. On average, low-carbon generation has risen by 9TWh each year in the decade since 2010 – including a rise of just 1TWh in 2019.

Given scheduled nuclear retirements and rising demand expected by the Committee on Climate Change (CCC) – with some electrification of transport and heating – low-carbon generation would need to increase by 15TWh each year until 2030, just to meet the benchmark of 100gCO2/kWh.

For context, the 3.2 gigawatt (GW) Hinkley C new nuclear plant being built in Somerset will generate around 25TWh once completed around 2026. The world’s largest offshore windfarm, the 1.2GW Hornsea One scheme off the Yorkshire coast, will generate around 5TWh each year.

The new Conservative government is targeting 40GW of offshore wind by 2030, up from today’s figure of around 8GW. If policies are put in place to meet this goal, then it could keep power sector emissions below 100gCO2/kWh, depending on the actual performance of the windfarms built.

However, new onshore wind and solar, further new nuclear or other low-carbon generation, such as gas with carbon capture and storage (CCS), is likely to be needed if demand is higher than expected, or if the 100gCO2/kWh benchmark is too weak in the context of net-zero by 2050.

The CCC says it is “likely” to “reflect the need for more rapid deployment” of low-carbon towards net-zero emissions in its advice on the sixth UK carbon budget for 2033-2037, due in September.

Trading places
Looking more closely at UK electricity generation in 2019, Carbon Brief’s analysis shows why there was so little growth for low-carbon sources compared to the previous year.

There was another increase for wind power in 2019 (up 8TWh, 14%), with record wind generation as several large new windfarms were completed including the 1.2GW Hornsea One project in October and the 0.6GW Beatrice offshore windfarm in Q2 of 2019. But this was offset by a decline for nuclear (down 9TWh, 14%), due to ongoing outages for reactors at Hunterston in Scotland and Dungeness in Kent.

(Analysis of data held by trade organisation RenewableUK suggests some 0.6GW of onshore wind capacity also started operating in 2019, including the 0.2GW Dorenell scheme in Moray, Scotland.)

As a result of these movements, the UK’s windfarms overtook nuclear for the first time ever in 2019, becoming the country’s second-largest source of electricity generation, and earlier, wind and solar together surpassed nuclear in the UK as momentum built. This is shown in the figure below, with wind (green line, top panel) trading places with nuclear (purple) and gas (dark blue) down around 25% since 2010 but remaining the single-largest source.

 Annual electricity generation in the UK by fuel, terawatt hours, 2010-2019. Top panel: fuel by fuel. Bottom panel: cumulative total generation from all sources. Source: BEIS energy trends, BM Reports and Carbon Brief analysis. Chart by Carbon Brief using Highcharts.
The UK’s currently suspended nuclear plants are due to return to service in January and March, according to operator EDF, the French state-backed utility firm. However, as noted above, most of the UK’s nuclear fleet is set to retire during the 2020s, with only Sizewell B in Suffolk due to still be operating by 2030. Hunterston is scheduled to retire by 2023 and Dungeness by 2028.

Set against these losses, the UK has a pipeline of offshore windfarms, secured via “contracts for difference” with the government, at a series of auctions. The most recent auction, in September 2019, saw prices below £40 per megawatt hour – similar to current wholesale electricity prices.

However, the capacity contracted so far is not sufficient to meet the government’s target of 40GW by 2030, meaning further auctions – or some other policy mechanism – will be required.

Coal zero
As well as the switch between wind and nuclear, 2019 also saw coal fall below solar for the first time across a full year, echoing the 2016 moment when wind outgenerated coal across the UK, after it suffered another 60% reduction in electricity output. Just six coal plants remain in the UK, with Aberthaw B in Wales and Fiddlers Ferry in Cheshire closing in March.

Coal accounted for just 2% of UK generation in 2019, a record-low coal share since centralised electricity supplies started to operate in 1882. The fuel met 40% of UK needs as recently as 2012, but has plummeted thanks to falling demand, rising renewables, cheaper gas and higher CO2 prices.

The reduction in average coal generation hides the fact that the fuel is now often not required at all to meet the UK’s electricity needs. The chart below shows the number of days each year when coal output was zero in 2019 (red line) and the two previous years (blue).

 Cumulative number of days when UK electricity generation from renewable sources has been higher than that from fossil fuels. Source: BEIS energy trends, BM Reports and Carbon Brief analysis. Chart by Carbon Brief using Highcharts.
The 83 days in 2019 with zero coal generation amount to nearly a quarter of the year and include the record-breaking 18-day stretch without the fuel.

Great Britain has been running for a record TWO WEEKS without using coal to generate electricity – the first time this has happened since 1882.

The country’s grid has been coal-free for 45% of hours in 2019 so far.https://www.carbonbrief.org/countdown-to-2025-tracking-the-uk-coal-phase-out …

Coal generation was set for significant reductions around the world in 2019 – including a 20% reduction for the EU as a whole – according to analysis published by Carbon Brief in November.

Notably, overall UK electricity generation fell by another 9TWh in 2019 (3%), bringing the total decline to 58TWh since 2010. This is equivalent to more than twice the output from the Hinkley C scheme being built in Somerset. As Carbon Brief explained last year, falling demand has had a similar impact on electricity-sector CO2 emissions as the increase in output from renewables.

This is illustrated by the fact that the 9TWh reduction in overall generation translated into a 9TWh (6%) cut in fossil-fuel generation during 2019, with coal falling by 10TWh and gas rising marginally.

Increasingly renewable
As fossil-fuel output and overall generation have declined, the UK’s renewable sources of electricity have continued to increase. Their output has risen nearly five-fold in the past decade and their share of the UK total has increased from 7% in 2010 to 37% in 2019.

As a result, the UK’s increasingly renewable grid is seeing more minutes, hours and days during which the likes of wind, solar and biomass collectively outpace all fossil fuels put together, and on some days wind is the main source as well.

The chart below shows the number of days during each year when renewables generated more electricity than fossil fuels in 2019 (red line) and each of the previous four years (blue lines). In total, nearly two-fifths of days in 2019 crossed this threshold.

 Cumulative number of days when the UK has not generated any electricity from coal. Source: BEIS energy trends, BM Reports and Carbon Brief analysis. Chart by Carbon Brief using Highcharts.
There were also four months in 2019 when renewables generated more of the UK’s electricity than fossil fuels: March, August, September and December. The first ever such month came in September 2018 and more are certain to follow.

National Grid, which manages Great Britain’s high-voltage electricity transmission network, is aiming to be able to run the system without fossil fuels by 2025, at least for short periods. At present, it sometimes has to ask windfarm operators to switch off and gas plants to start running in order to keep the electricity grid stable.

Note that biomass accounted for 11% of UK electricity generation in 2019, nearly a third of the total from all renewables. Some two-thirds of the biomass output is from “plant biomass”, primarily wood pellets burnt at Lynemouth in Northumberland and the Drax plant in Yorkshire. The remainder was from an array of smaller sites based on landfill gas, sewage gas or anaerobic digestion.

The CCC says the UK should “move away” from large-scale biomass power plants, once existing subsidy contracts for Drax and Lynemouth expire in 2027.

Using biomass to generate electricity is not zero-carbon and in some circumstances could lead to higher emissions than from fossil fuels. Moreover, there are more valuable uses for the world’s limited supply of biomass feedstock, the CCC says, including carbon sequestration and hard-to-abate sectors with few alternatives.

Methodology
The figures in the article are from Carbon Brief analysis of data from BEIS Energy Trends chapter 5 and chapter 6, as well as from BM Reports. The figures from BM Reports are for electricity supplied to the grid in Great Britain only and are adjusted to include Northern Ireland.

In Carbon Brief’s analysis, the BM Reports numbers are also adjusted to account for electricity used by power plants on site and for generation by plants not connected to the high-voltage national grid. This includes many onshore windfarms, as well as industrial gas combined heat and power plants and those burning landfill gas, waste or sewage gas.

By design, the Carbon Brief analysis is intended to align as closely as possible to the official government figures on electricity generated in the UK, reported in BEIS Energy Trends table 5.1.

Briefly, the raw data for each fuel is in most cases adjusted with a multiplier, derived from the ratio between the reported BEIS numbers and unadjusted figures for previous quarters.

Carbon Brief’s method of analysis has been verified against published BEIS figures using “hindcasting”. This shows the estimates for total electricity generation from fossil fuels or renewables to have been within ±3% of the BEIS number in each quarter since Q4 2017. (Data before then is not sufficient to carry out the Carbon Brief analysis.)

For example, in the second quarter of 2019, a Carbon Brief hindcast estimates gas generation at 33.1TWh, whereas the published BEIS figure was 34.0TWh. Similarly, it produces an estimate of 27.4TWh for renewables, against a BEIS figure of 27.1TWh.

National Grid recently shared its own analysis for electricity in Great Britain during 2019 via its energy dashboard, which differs from Carbon Brief’s figures.


Related News

View more

Ontario's electricity operator kept quiet about phantom demand that cost customers millions

IESO Fictitious Demand Error inflated HOEP in the Ontario electricity market, after embedded generation was mis-modeled; the OEB says double-counted load lifted wholesale prices and shifted costs via the Global Adjustment.


Key Points

An IESO modeling flaw that double-counted load, inflating HOEP and charges in Ontario's wholesale market.

✅ Double-counted unmetered load from embedded generation

✅ Inflated HOEP; shifted costs via Global Adjustment

✅ OEB flagged transparency; exporters paid more


For almost a year, the operator of Ontario’s electricity system erroneously counted enough phantom demand to power a small city, causing prices to spike and hundreds of millions of dollars in extra charges to consumers, according to the provincial energy regulator.

The Independent Electricity System Operator (IESO) also failed to tell anyone about the error once it noticed and fixed it.

The error likely added between $450 million and $560 million to hourly rates and other charges before it was fixed in April 2017, according to a report released this month by the Ontario Energy Board’s Market Surveillance Panel.

It did this by adding as much as 220 MW of “fictitious demand” to the market starting in May 2016, when the IESO started paying consumers who reduced their demand for power during peak periods. This involved the integration of small-scale embedded generation (largely made up of solar) into its wholesale model for the first time.

The mistake assumed maximum consumption at such sites without meters, and double-counted that consumption.

The OEB said the mistake particularly hurt exporters and some end-users, who did not benefit from a related reduction of a global adjustment rate applicable to other customers.

“The most direct impact of the increase in HOEP (Hourly Ontario Energy Price) was felt by Ontario consumers and exporters of electricity, who paid an artificially high HOEP, to the benefit of generators and importers,” the OEB said.

The mix-up did not result in an equivalent increase in total system costs, because changes to the HOEP are offset by inverse changes to a electricity cost allocation mechanism such as the Global Adjustment rate, the OEB noted.


A chart from the OEB's report shows the time of day when fictitious demand was added to the system, and its influence on hourly rates.

Peak time spikes
The OEB said that the fictitious demand “regularly inflated” the hourly price of energy and other costs calculated as a direct function of it.

For almost a year, Ontario's electricity system operator @IESO_Tweets erroneously counted enough phantom demand to power a small city, causing price spikes and hundreds of millions in charges to consumers, @OntEnergyBoard says. @5thEstate reports.

It estimated the average increase to the HOEP was as much as $4.50/MWh, but that price spikes, compounded by scheduled OEB rate changes, would have been much higher during busier times, such as the mid-morning and early evening.

“In times of tight supply, the addition of fictitious demand often had a dramatic inflationary impact on the HOEP,” the report said.

That meant on one summer evening in 2016 the hourly rate jumped to $1,619/MWh, it said, which was the fourth highest in the history of the Ontario wholesale electricity market.

“Additional demand is met by scheduling increasingly expensive supply, thus increasing the market price. In instances where supply is tight and the supply stack is steep, small increases in demand can cause significant increases in the market price.

The OEB questioned why, as of September this year, the IESO had failed to notify its customers or the broader public, amid a broader auditor-regulator dispute that drew political attention, about the mistake and its effect on prices.

“It's time for greater transparency on where electricity costs are really coming from,” said Sarah Buchanan, clean energy program manager at Environmental Defence.

“Ontario will be making big decisions in the coming years about whether to keep our electricity grid clean, or burn more fossil fuels to keep the lights on,” she added. “These decisions need to be informed by the best possible evidence, and that can't happen if critical information is hidden.”

In a response to the OEB report on Monday, the IESO said its own initial analysis found that the error likely pushed wholesale electricity payments up by $225 million. That calculation assumed that the higher prices would have changed consumer behaviour, while upcoming electricity auctions were cited as a way to lower costs, it said.

In response to questions, a spokesperson said residential and small commercial consumers would have saved $11 million in electricity costs over the 11-month period, even as a typical bill increase loomed province-wide, while larger consumers would have paid an extra $14 million.

That is because residential and small commercial customers pay some costs via time-of-use rates, including a temporary recovery rate framework, the IESO said, while larger customers pay them in a way that reflects their share of overall electricity use during the five highest demand hours of the year.

The IESO said it could not compensate those that had paid too much, given the complexity of the system, and that the modelling error did not have a significant impact on ratepayers.

While acknowledging the effects of the mistake would vary among its customers, the IESO said the net market impact was less than $10 million, amid ongoing legislation to lower electricity rates in Ontario.

It said it would improve testing of its processes prior to deployment and agreed to publicly disclose errors that significantly affect the wholesale market in the future.


Related News

View more

'Pakistan benefits from nuclear technology'

Pakistan Nuclear Energy advances clean power with IAEA guidance, supporting SDGs via electricity generation, nuclear security, and applications in healthcare, agriculture, and COVID-19 testing, as new 1,100 MW reactors near grid connection.


Key Points

Pakistan Nuclear Energy is the nation's atomic program delivering clean electricity, SDGs gains, and IAEA-guided safety.

✅ Two 1,100 MW reactors nearing grid connection

✅ IAEA-aligned safety and nuclear security regime

✅ Nuclear tech supports healthcare, agriculture, COVID-19 tests


Pakistan is utilising its nuclear technology to achieve its full potential by generating electricity, aligning with China's steady nuclear development trends, and attaining socio-economic development goals outlined by the United Nations Sustainable Development Goals.

This was stated by Pakistan Atomic Energy Commission (PAEC) Chairperson Muhammad Naeem on Tuesday while addressing the 64th International Atomic Energy Agency (IAEA) General Conference (GC) which is being held in Vienna from September 21, a forum taking place amid regional milestones like the UAE's first Arab nuclear plant startup as well.

Regarding nuclear security, the PAEC chief stated that Pakistan considered it as a national responsibility and that it has developed a comprehensive and stringent safety and security regime, echoing IAEA praise for China's nuclear security in the region, which is regularly reviewed and upgraded in accordance with IAEA's guidelines.

Many delegates are attending the event through video link due to the novel coronavirus (Covid-19) pandemic.

On the first day of the conference, IAEA Director General Rafael Mariano Grossi highlighted the role of the nuclear watchdog in the monitoring and verification of nuclear activities across the globe, as seen in Barakah Unit 1 at 100% power milestones reported worldwide.

He also talked about the various steps taken by the IAEA to help member states contain the spread of coronavirus such as providing testing kits etc.

In a recorded video statement, the PAEC chairperson said that Pakistan has a mutually beneficial relationship with IAEA, similar to IAEA assistance to Bangladesh on nuclear power development efforts. He also congratulated Ambassador Azzeddine Farhane on his election to become the President of the 64th GC and assured him of Pakistan's full support and cooperation.

Naeem stated that as a clean, affordable and reliable source, nuclear energy can play a key role, with India's nuclear program moving back on track, in fighting climate change and achieving the Sustainable Development Goals (SDGs).

The PAEC chief informed the audience that two 1,100-megawatt (MW) nuclear power plants are near completion and, like the UAE grid connection milestone, are expected to be connected to the national grid next year.

He also highlighted the role of PAEC in generating electricity through nuclear power plants, while also helping the country achieve the socio-economic development goals outlined under the United Nations SDGs through the application of nuclear technology in diverse fields like agriculture, healthcare, engineering and manufacturing, human resource development and other sectors.


Related News

View more

Investigation reveals power company 'gamed' $100M from Ontario's electricity system

Goreway Power Station Overbilling exposed by Ontario Energy Board shows IESO oversight failures, GCG gaming, and $100M in inappropriate payments at the Brampton natural gas plant, penalized with fines and repayments impacting Ontario ratepayers.


Key Points

Goreway exploited IESO GCG flaws, causing about $100M in improper payouts and fines.

✅ OEB probe flagged $89M in ineligible start-up O&M charges

✅ IESO fined Goreway $10M; majority of excess costs recovered

✅ Audit found $200M in overbilling across nine generators


Hydro customers shelled out about $100 million in "inappropriate" payments to a natural gas plant that exploited flaws in how Ontario manages its private electricity generators, according to the Ontario Energy Board.

The company operating the Goreway Power Station in Brampton "gamed" the system for at least three years, according to an investigation by the provincial energy regulator. 

The investigation also delivers stinging criticism of the provincial government's Independent Electricity System Operator (IESO), slamming it for a lack of oversight. The probe by the Ontario Energy Board's market surveillance panel was completed nearly a year ago, but was only made public in November because it was buried on its website without a news release. CBC News is the first media outlet to report on the investigation.  

The excess payments to Goreway Power Station included:

  • $89 million in ineligible expenses billed as the costs of firing up power production. 
  • $5.6 million paid in three months from a flaw in how IESO calculated top-ups for the company committing to generate power a day in advance.   
  • Of $11.2 million paid to compensate the company for IESO ordering it to start or stop generating power, the investigation concluded "a substantial portion ... was the result of gaming."  

Most privately-owned natural gas-fired plants in the province do not generate electricity constantly, but start and stop production in response to fluctuating market demand, even as the energy minister has requested an halt to natural gas generation across the grid.  IESO pays them a premium for the costs of firing up production, through what it calls "generation cost guarantee" programs. 

But the investigation found IESO did little checking into the details of Goreway Power Station's billings. 

Goreway Power Station, located near Highway 407 in Brampton, Ont., is an 875 megawatt natural gas power plant. (Goreway)

"Conservatively, at least $89 million of Goreway's submissions were clearly ineligible by any reasonable measure," concludes the report.

"Goreway routinely submitted what were obviously inappropriate expenses to be reimbursed by the IESO, and ultimately borne by Ontario ratepayers,"

The investigation panel found an "extraordinary pattern" to these billings by Goreway Power Station, suggesting the IESO should have caught on sooner. The company submitted more than $100 million in start-up operating and maintenance costs during the three-year period investigated — more than all other gas-fired generators in the province combined. The company's costs per start-up were more than double the next most expensive power generator. 

"Goreway repeatedly exploited defects in the GCG (generation cost guarantee) program, and in doing so received at least $89 million in gamed GCG payments." 

Company fined $10M

The investigation covered a three-year period from when Goreway Power Station began generating power in June 2009. Investigators said that delays in releasing documents slowed down their probe, and they only obtained all the records they needed in April 2016.

The investigating panel does not have the power to impose penalties on companies it found broke the rules. 

The IESO fined Goreway Power Station $10 million. The company has also repaid IESO "a substantial portion" of the excess payments it received during its first six years of operating, but the exact figure is blacked out in the investigation report that was made public. 

The control room from which the provincial government's Independent Electricity System Operator manages Ontario's power supply. The agency is also responsible for managing contracts with private power producers.(IESO)

"Goreway does not agree with many of the draft report's findings and conclusions, including any suggestion that Goreway engaged in gaming or that it deliberately misled the IESO," writes lawyer George Vegh on behalf of the company in a response to the investigation report, dated Aug. 1.

"Goreway has implemented initiatives designed to ensure that compliance is a chief operating principle."     

The power station, located near Highway 407 in Brampton, is a joint venture between Toyota Tsusho Corp. and JERA Co. Inc. During the period under scrutiny, the project was run by Toyota Tsusho and Chubu Electric Power Inc., both headquartered in Japan. 

Investigators fear 'same situation' exists today

The report blames the provincially-controlled IESO for creating a system with defects that allowed the over-billing. 

"Goreway was able to — and repeatedly did — exploit these defects," says the investigation report. It goes on to explain the flaws "have created opportunities for exploitation, to the serious financial disadvantage of Ontario's ratepayers," even as greening Ontario's grid could entail massive costs.

The investigation suggests IESO hasn't made adequate changes to ensure it won't happen again, at a time when an analysis of a dirtier grid is raising concerns.   

"Goreway stands as a clear example of how generators are able to exploit the generation costs guarantee regime," says the report.

"The Panel is concerned that the same situation remains in place today." 

PC energy critic Todd Smith raised CBC News' report on the Goreway Power Station in Tuesday's question period. (Ontario Legislature)

After CBC News broke the story Tuesday, the provincial government was forced to respond in question period, amid a broader push for new gas plants to boost electricity production. 

"Here we have yet another gas plant scandal in Peel region that's costing electricity customers over $100 million," said PC energy critic Todd Smith. He slammed "the incompetence of a government that once again failed to look out for electricity customers." 

Economic Development Minister Brad Duguid said: "There is no excuse for any company in this province to ever game the system."

Nine companies overbilled $200M: audit 

The IESO found out about the overbilling "some time ago," said Duguid.

"They fully investigated, they've recovered most of the cost, they delivered a $10 million fine — the biggest fine on record."

The program that Goreway exploited became the subject of an audit that the IESO launched in 2011. The agency uncovered $200 million in ineligible billings by nine power producers, wrote the IESO vice president for policy Terry Young in an email to CBC News.

The IESO has recovered up to 85 per cent of those ineligible costs, Young noted.

Reforms to the design of the the program have removed the potential for overpayments and made it more efficient, he said, even as Ontario weighs embracing clean power more broadly. Last year, its total annual costs dropped to $23 million, down from $61 million in 2014.


Related News

View more

Volkswagen's German Plant Closures

VW Germany Plant Closures For EV Shift signal a strategic realignment toward electric vehicles, sustainability, and zero-emission mobility, optimizing manufacturing, cutting ICE capacity, boosting battery production, retraining workers, and aligning with the Accelerate decarbonization strategy.


Key Points

VW is shuttering German plants to cut ICE costs and scale EV output, advancing sustainability and competitiveness.

✅ Streamlines operations; reallocates capital to EV platforms and batteries.

✅ Cuts ICE output, lowers emissions, and boosts clean manufacturing capacity.

✅ Retrains workforce amid closures; invests in software and charging tech.


Volkswagen (VW), one of the world’s largest automakers, is undergoing a significant transformation with the announcement of plant closures in Germany. As reported by The Guardian, this strategic shift is part of VW’s broader move towards prioritizing electric vehicles (EVs) and adapting to the evolving automotive market as EVs reach an inflection point globally. The decision highlights the company’s commitment to sustainability and innovation amid a rapidly changing industry landscape.

Strategic Plant Closures

Volkswagen’s decision to close several of its plants in Germany marks a pivotal moment in the company's history. These closures are part of a broader strategy to streamline operations, reduce costs, and focus on the production of electric vehicles. The move reflects VW’s response to the growing demand for EVs and the need to transition from traditional internal combustion engine (ICE) vehicles to cleaner, more sustainable alternatives.

The affected plants, which have been key components of VW’s manufacturing network, will cease production as the company reallocates resources and investments towards its electric vehicle programs. This realignment is aimed at improving operational efficiency and ensuring that VW remains competitive in a market that is increasingly oriented towards electric mobility.

A Shift Towards Electric Vehicles

The closures are closely linked to Volkswagen’s strategic shift towards electric vehicles. The automotive industry is undergoing a profound transformation as governments and consumers place greater emphasis on sustainability and reducing carbon emissions. Volkswagen has recognized this shift and is investing heavily in the development and production of EVs as part of its "Accelerate" strategy, anticipating widespread EV adoption within a decade across key markets.

The company’s commitment to electric vehicles is evident in its plans to launch a range of new electric models and increase production capacity for EVs. Volkswagen aims to become a leader in the electric mobility sector by leveraging its technological expertise and scale to drive innovation and expand its EV offerings.

Economic and Environmental Implications

The closure of VW’s German plants carries both economic and environmental implications. Economically, the move will impact the workforce and local economies dependent on these manufacturing sites. Volkswagen has indicated that it will work on providing support and retraining opportunities for affected employees, as the EV aftermarket evolves and reshapes service needs, but the transition will still pose challenges for workers and their communities.

Environmentally, the shift towards electric vehicles represents a significant positive development. Electric vehicles produce zero tailpipe emissions, which aligns with global efforts to combat climate change and reduce air pollution. By focusing on EV production, Volkswagen is contributing to the reduction of greenhouse gas emissions and supporting the transition to a more sustainable transportation system.

Challenges and Opportunities

While the transition to electric vehicles presents opportunities, it also comes with challenges. Volkswagen will need to manage the complexities of closing and repurposing its existing plants while ramping up production at new or upgraded facilities dedicated to EVs. This transition requires substantial investment in new technologies, infrastructure, and training, including battery supply strategies that influence manufacturing footprints, to ensure a smooth shift from traditional automotive manufacturing.

Additionally, Volkswagen faces competition from other automakers that are also investing heavily in electric vehicles, including Daimler's electrification plan outlining the scope of its transition. To maintain its competitive edge, VW must continue to innovate and offer attractive, high-performance electric models that meet consumer expectations.

Future Outlook

Looking ahead, Volkswagen’s focus on electric vehicles aligns with broader industry trends and regulatory pressures. Governments worldwide are implementing stricter emissions regulations and providing incentives for EV adoption, although Germany's plan to end EV subsidies has sparked debate domestically, creating a favorable environment for companies that are committed to sustainability and clean technology.

Volkswagen’s investment in electric vehicles and its strategic realignment reflect a proactive approach to addressing these trends. The company’s ability to navigate the challenges associated with plant closures and the transition to electric mobility will be critical, especially as Europe's EV slump tests demand signals, in determining its success in the evolving automotive landscape.

Conclusion

Volkswagen’s decision to close several plants in Germany and focus on electric vehicle production represents a significant shift in the company’s strategy. While the closures present challenges, they also highlight Volkswagen’s commitment to sustainability and its response to the growing demand for cleaner transportation solutions. By investing in electric vehicles and adapting its operations, Volkswagen aims to lead the way in the transition to a more sustainable automotive future. As the company moves forward, its ability to effectively manage this transition will be crucial in shaping its role in the global automotive market.


Related News

View more

B.C. ordered to pay $10M for denying Squamish power project

Greengen Misfeasance Ruling details a B.C. Supreme Court decision awarding $10.125 million over wrongfully denied Crown land and water licence permits for a Fries Creek run-of-river hydro project under a BC Hydro contract.


Key Points

A B.C. Supreme Court ruling awarding $10.125M for wrongful denial of Crown land and water licences on Greengen's project.

✅ $10.125M damages for misfeasance in public office

✅ Denial of Crown land tenure and water licence permits

✅ Tied to Fries Creek run-of-river and BC Hydro EPA


A B.C. Supreme Court judge has ordered the provincial government to pay $10.125 million after it denied permits to a company that wanted to build a run-of-the river independent power project near Squamish.

In his Oct. 10 decision, Justice Kevin Loo said the plaintiff, Greengen Holdings Ltd., “lost an opportunity to achieve a completed and profitable hydro-electric project” after government representatives wrongfully exercised their legal authority, a transgression described in the ruling as “misfeasance,” with separate concerns reflected in an Ontario market gaming investigation reported elsewhere.

Between 2003 and 2009, the company sought to develop a hydro-electric project on and around Fries Creek, which sits opposite the Brackendale neighbourhood on the other side of the Squamish River. To do so, Greengen Holdings Ltd. required a water licence from the Minister of the Environment and tenure over Crown land from the Minister of Agriculture.

After a lengthy process involving extensive communications between Greengen and various provincial and other ministries and regulatory agencies, the permits were denied, according to Loo. Both decisions cited impacts on Squamish Nation cultural sites that could not be mitigated.

Elsewhere, an Indigenous-owned project in James Bay proceeded despite repeated denials, underscoring varied approaches to community participation.

40-year electricity plan relied on Crown land
The case dates back to December 2005, when BC Hydro issued an open call for power with Greengen. The company submitted a tender several months later.

On July 26, 2006, BC Hydro awarded Greengen an energy purchase agreement, amid evolving LNG electricity demand across the province, under which Greengen would be entitled to supply electricity at a fixed price for 40 years.

Unlike conventional hydroelectric projects, such as new BC generating stations recently commissioned, which store large volumes of water in reservoirs, and in so doing flood large tracts of land, a run of the river project often requires little or no water storage. Instead, from a high elevation, they divert water from a stream or river channel.

Water is then sent into a pressured pipeline known as a penstock, and later passed through turbines to generate electricity, Loo explained, as utilities pursue long-term plans like the Hydro-Québec strategy to reduce fossil fuel reliance. The system returns water to the original stream or river, or into another body of water. 

The project called for most of that infrastructure to be built on Crown land, according to the ruling.

All sides seemed to support the project
In early 2005, company principle Terry Sonderhoff discussed the Fries Creek project in a preliminary meeting with Squamish Nation Chief Ian Campbell.

“Mr. Sonderhoff testified that Chief Campbell seemed supportive of the project at the time,” Loo said.


Related News

View more

Sign Up for Electricity Forum’s Newsletter

Stay informed with our FREE Newsletter — get the latest news, breakthrough technologies, and expert insights, delivered straight to your inbox.

Electricity Today T&D Magazine Subscribe for FREE

Stay informed with the latest T&D policies and technologies.
  • Timely insights from industry experts
  • Practical solutions T&D engineers
  • Free access to every issue

Live Online & In-person Group Training

Advantages To Instructor-Led Training – Instructor-Led Course, Customized Training, Multiple Locations, Economical, CEU Credits, Course Discounts.

Request For Quotation

Whether you would prefer Live Online or In-Person instruction, our electrical training courses can be tailored to meet your company's specific requirements and delivered to your employees in one location or at various locations.