Substation Relay Protection Training
Our customized live online or in‑person group training can be delivered to your staff at your location.

- Live Online
- 12 hours Instructor-led
- Group Training Available
Regular Price:
$699
Coupon Price:
$599
EU antitrust regulators said they had charged several makers of electricity generation equipment with forming a price-fixing cartel.
It did not name the power transformer makers it had charged, but said the companies would be able to defend themselves in writing and at a hearing before the European Union decides on whether to fine them.
Germany's Siemens AG, France's Areva and Swiss engineering group ABB confirmed they had received the charges.
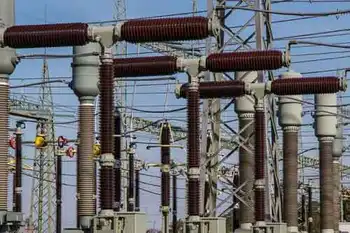
Power transformers are used to control the voltage in electrical circuits and are key components in transmission and distribution networks. They are bought by major power generation and transmission companies — so higher prices may raise costs and contribute to more expensive electricity prices for households and companies.
EU cartel fines can cost a company up to 10 percent of its global yearly revenue for each year it broke antitrust rules, often running into hundreds of millions of euros (dollars).
Officials raided several power transformer companies in France, Germany and Austria in February 2007.
Siemens AG spokesman Joern Roggenbuck confirmed that it was among those charged, but had no further comment.
The company said last year it had suspended three employees it suspected of colluding with rivals on the German market between 2001 and 2003. It said this happened before Siemens bought the Power Transmission and Distribution Group and VA Tech EBG units in 2005.
But Siemens said the behavior only became known as a result of the antitrust raids — meaning it was not the first to blow the whistle on the cartel. Whistle-blowers usually win a complete amnesty from fines.
Areva said the charges related to behavior predating its January 2004 purchase of a power transmission and distribution business from Alstom SA.
ABB said in a statement that it had also been charged and that it had a zero tolerance policy for employees who broke the law or behaved unethically.
Related News

Energy chief says electricity would continue uninterrupted if coal phased out within 30 years
Australia Energy Policy Debate highlights IPCC warnings, Paris Agreement goals, coal phase-out, emissions reduction, renewables,…
View more
35 arrested in India for stealing electricity
BEST vigilance raid on Wadala electricity theft uncovered a Mumbai power theft racket in Antop…
View more
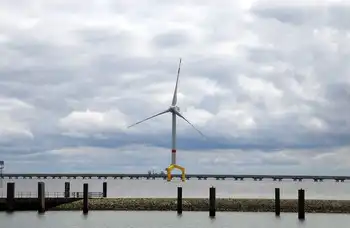
Marine Renewables Canada shifts focus towards offshore wind
Marine Renewables Canada Offshore Wind integrates marine renewables, tidal and wave energy, advancing clean electricity,…
View more
U.S. Launches $250 Million Program To Strengthen Energy Security For Rural Communities
DOE RMUC Cybersecurity Program supports rural, municipal, and small investor-owned utilities with grants, technical assistance,…
View more
Canada's looming power problem is massive but not insurmountable: report
Canada Net-Zero Electricity Buildout will double or triple power capacity, scaling clean energy, renewables, nuclear,…
View more
Ontario Sets Electricity Rates at Off-Peak Price until February 7
Ontario Off-Peak Electricity Rate offers 8.2 cents per kWh for 24 hours, supporting Time-of-Use and…
View more
Sign Up for Electricity Forum’s Newsletter
Stay informed with our FREE Newsletter — get the latest news, breakthrough technologies, and expert insights, delivered straight to your inbox.
Electricity Today T&D Magazine Subscribe for FREE

Stay informed with the latest T&D policies and technologies.
- Timely insights from industry experts
- Practical solutions T&D engineers
- Free access to every issue
