NFPA 70b Training - Electrical Maintenance
Our customized live online or in‑person group training can be delivered to your staff at your location.

- Live Online
- 12 hours Instructor-led
- Group Training Available
Regular Price:
$699
Coupon Price:
$599
The construction of Russia's first floating nuclear power plant, Academiciam Lomonosov, has been put on hold because the Sevmash factory, its main contractor, is facing budget shortfalls.
The company is a Defense Ministry factory whose priority is fulfilling military orders.
In May, Russian officials announced that the delay in the building of the floating nuclear power plant would not last more than five months, adding that the plant would be ready in 2011 instead of the originally estimated date of 2010.
The controversial power station is equipped with two 30-MW KLT40C reactors housed in ice-breaking vessels. The construction, which is estimated at more than $336 million, is 60% complete.
The floating nuclear power plant will supply electricity to the town of Severodvinsk and will cover the nearby Sevmash shipbuilding plant's energy needs.
Related News
Investing in a new energy economy for Montana
Montana New Energy Economy integrates grid modernization, renewable energy, storage, and demand response to cut…
View more
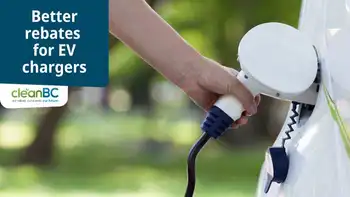
British Columbians can access more in EV charger rebates
B.C. EV Charging Rebates boost CleanBC incentives as NRCan and ZEVIP funding covers up to…
View more
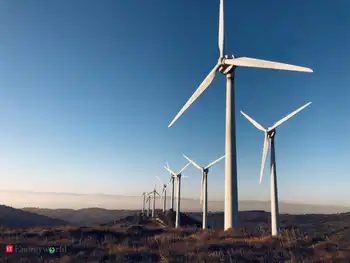
Wind turbine firms close Spanish factories as Coronavirus restrictions tighten
Spain Wind Turbine Factory Shutdowns disrupt manufacturing as Vestas, Siemens Gamesa, and Nordex halt Spanish…
View more

Honda Accelerates Electric Vehicle Push with Massive Investment in Ontario
Honda Ontario EV Investment accelerates electric vehicle manufacturing in Canada, adding a battery plant, EV…
View more
U.S. Launches $250 Million Program To Strengthen Energy Security For Rural Communities
DOE RMUC Cybersecurity Program supports rural, municipal, and small investor-owned utilities with grants, technical assistance,…
View more

Seattle City Light's Initiative Helps Over 93,000 Customers Reduce Electricity Bills
Seattle City Light Energy Efficiency Programs help 93,000 residents cut bills with rebates, home energy…
View more
Sign Up for Electricity Forum’s Newsletter
Stay informed with our FREE Newsletter — get the latest news, breakthrough technologies, and expert insights, delivered straight to your inbox.
Electricity Today T&D Magazine Subscribe for FREE

Stay informed with the latest T&D policies and technologies.
- Timely insights from industry experts
- Practical solutions T&D engineers
- Free access to every issue

