
NFPA 70b Training - Electrical Maintenance
Our customized live online or in‑person group training can be delivered to your staff at your location.

- Live Online
- 12 hours Instructor-led
- Group Training Available
Regular Price:
$699
Coupon Price:
$599
TORONTO
—
Ontario Electricity Grid Decarbonization outlines the IESO's net-zero pathway: $400B investment, nuclear expansion, renewables, hydrogen, storage, and demand management to double capacity by 2050 while initiating a 2027 natural gas moratorium.
What's Behind the News
A 2050 plan to double capacity, retire gas, and invest $400B in nuclear, renewables, and storage for a net-zero grid.
$400B over 25 years to build a net-zero electricity system.
Capacity to double from 42,000 MW to 88,000 MW by 2050.
2027 moratorium on new gas, contingent on non-emitting supply.
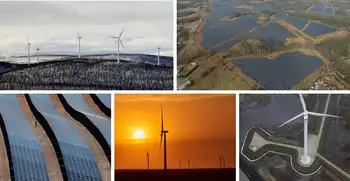
Expand nuclear, renewables, hydrogen, storage, and efficiency.
Risks: long build times, cost escalation, and demand growth ~2%/yr.
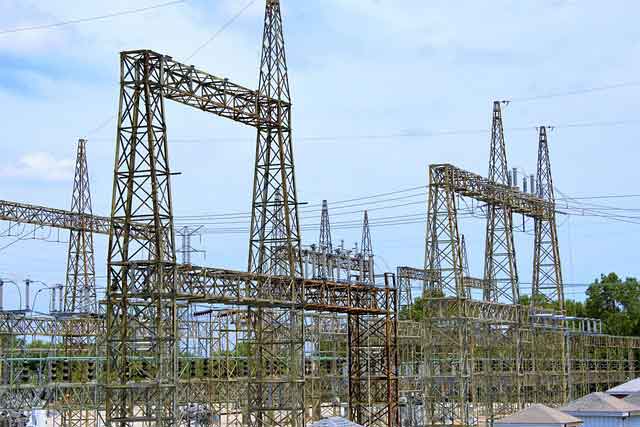
Ontario will need to spend $400 billion over the next 25 years in order to decarbonize the electricity grid and embrace clean power according to a new report by the province’s electricity system manager that’s now being considered by the Ford government.
The Independent System Electricity Operator (IESO) was tasked with laying out a path to reducing Ontario’s reliance on natural gas for electricity generation and what it would take to decarbonize the entire electricity grid by 2050.
Meeting the goal, the IESO concluded, will require an “aggressive” approach of doubling the electricity capacity in Ontario over the next two-and-a-half decades — from 42,000 MW to 88,000 MW — by investing in nuclear, hydrogen and wind and solar power while implementing conservation policies and managing demand.
“The process of fully eliminating emissions from the grid itself will be a significant and complex undertaking,” IESO president Lesley Gallinger said in a news release.
The road to decarbonization, the IESO said, begins with a moratorium on natural gas power generation starting in 2027 as long as the province has “sufficient, non-emitting supply” to meet the growing demands on the grid.
The approach, however, comes with significant risks.
The IESO said hydroelectric and nuclear facilities can take 10 to 15 years to build and if costs aren’t controlled the plan could drive up the price of clean electricity, turning homeowners and businesses away from electrification.
“Rapidly rising electricity costs could discourage electrification, stifle economic growth or hurt consumers with low incomes,” the report states.
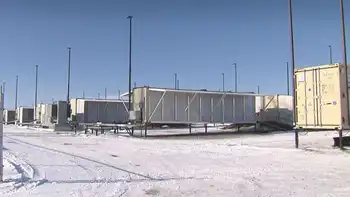
The IESO said the province will need to take several “no regret” actions, including selecting sites and planning to construct new large-scale nuclear plants as well as hydroelectric and energy storage projects and expanding energy-efficiency programs beyond 2024.
READ MORE: Ontario faces calls to dramatically increase energy efficiency rebate programs
Ontario’s minister of energy didn’t immediately commit to implementing the recommendations, citing the need to consult with stakeholders first.
“I look forward to launching a consultation in the new year on next steps from today’s report, including the potential development of major nuclear, hydroelectric and transmissions projects,” Todd Smith said in a statement.
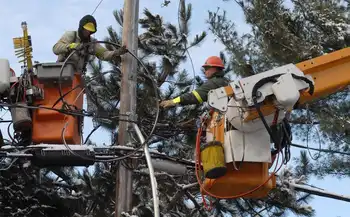
Currently, electricity demand is increasing by roughly two per cent per year, raising concerns Ontario could be short of electricity in the coming years as the manufacturing and transportation sectors electrify and as more sectors consider decarbonization.
At the same time, the province’s energy supply is facing “downward pressure” with the Pickering nuclear power plant slated to wind down operations and the Darlington nuclear generating station under active refurbishment.
To meet the energy need, the Ford government said it intended to extend the life of the Pickering plant until 2026.
READ MORE: Ontario planning to keep Pickering nuclear power station open until 2026
But to prepare for the increase, the Ontario government was told the province would also need to build new natural gas facilities to bridge Ontario’s electricity supply gap in the near term — a recommendation the Ford government agreed to.
The IESO said a request for proposals has been opened and the province is looking for host communities, with the expectation that existing facilities would be upgraded before projects on undeveloped land would be considered.
The IESO said the contract for any new facilities would expire in 2040, and all natural gas facilities would be retired in the 2040s.
Related News
Related News
IEA: Asia set to use half of world's electricity by 2025
Asia Electricity Consumption 2025 highlights an IEA forecast of surging global power demand led by…
View more

LNG powered with electricity could be boon for B.C.'s independent power producers
B.C. LNG Electrification embeds clean hydro and wind power into low-emission liquefied natural gas, cutting…
View more
Berlin Electric Utility Wins National Safety Award
Berlin Electric Utility APPA Safety Award recognizes Gold Designation performance in public power, highlighting OSHA-aligned…
View more
Electricity deal clinches $100M bitcoin mining operation in Medicine Hat
Medicine Hat Bitcoin Mining Deal delivers 42 MW electricity to Hut 8, enabling blockchain data…
View more
Hydro-Québec will refund a total of $535 million to customers who were account holders in 2018 or 2019
Hydro-Québec Bill 34 Refund issues $535M customer credits tied to electricity rates, consumption-based rebates, and…
View more
Amazon launches new clean energy projects in US, UK
Amazon Renewable Energy Projects advance net zero goals with a Scotland wind farm PPA and…
View more
Sign Up for Electricity Forum’s Newsletter
Stay informed with our FREE Newsletter — get the latest news, breakthrough technologies, and expert insights, delivered straight to your inbox.
Electricity Today T&D Magazine Subscribe for FREE

Stay informed with the latest T&D policies and technologies.
- Timely insights from industry experts
- Practical solutions T&D engineers
- Free access to every issue

