CSA Z463 Electrical Maintenance -
Our customized live online or in‑person group training can be delivered to your staff at your location.

- Live Online
- 6 hours Instructor-led
- Group Training Available
Regular Price:
$249
Coupon Price:
$199
Temperatures approaching 100 degrees have started to slowly sap away the water Lake Norman had gained in the past six months.
The lake level at Lake Norman has dipped 0.3 feet in the past 10 days. While that put the lake at its target level, the rapid evaporation, and the expected dry, hot conditions of the next week, will keep Duke Energy officials and others monitoring the water. Duke is in a Stage 3 drought program.
Duke Energy spokeswoman Marilyn Lineberger said the Drought Management Advisory Group - which includes Duke Energy, local municipalities and local businesses - won't make any decisions about further restrictions until its June 25 meeting. Duke Energy is not granting permits for new pumps at residential properties and said other properties also face restrictions.
Lake residents can still pump water from the lake on Saturdays, but that could change if the high evaporation levels continue, officials said.
"We weren't seeing conditions like this until August last year," Joe Klutz of Duke Energy told the Lake Norman Marine Commission. Lineberger said the group will look at drought monitors, stream flows, lake levels and other indicators to make a determination.
Each jurisdiction makes its own decisions, while Duke controls lake pumps and lake levels.
"Droughts evolve over a period of time," Lineberger said. "Collaboration is very important." Lineberger said that includes conserving resources.
"Everyone, whether they are on the lake or not, needs to change their behavior," Lineberger said. "We all need to conserve water. That goes a long way."
Related News
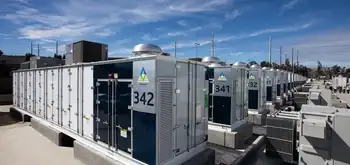
'Unlayering' peak demand could accelerate energy storage adoption
Duration Portfolio Energy Storage aligns layered peak demand with right-sized batteries, enabling peak shaving, gas…
View more
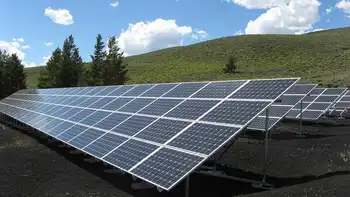
In 2021, 40% Of The Electricity Produced In The United States Was Derived From Non-Fossil Fuel Sources
Renewable Electricity Generation is accelerating the shift from fossil fuels, as wind, solar, and hydro…
View more
Washington State's Electric Vehicle Rebate Program
Washington EV Rebate Program drives EV adoption with incentives, funding, and clean energy goals, cutting…
View more
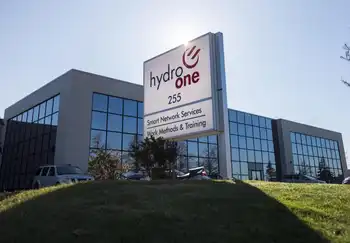
Hydro One reports $1.1B Q2 profit boosted by one-time gain due to court ruling
Hydro One Q2 Earnings surge on a one-time gain from a court ruling on a…
View more
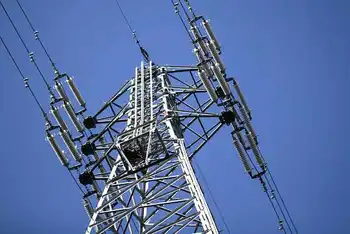
Alberta Proposes Electricity Market Changes
Alberta Electricity Market Reforms aim to boost grid reliability and efficiency through a day-ahead market,…
View more

Fish boom prompts energy conglomerate to spend $14.5M to bury subsea cables
Maritime Link Cable Burial safeguards 200-kV subsea cables in the Cabot Strait as Emera and…
View more
Sign Up for Electricity Forum’s Newsletter
Stay informed with our FREE Newsletter — get the latest news, breakthrough technologies, and expert insights, delivered straight to your inbox.
Electricity Today T&D Magazine Subscribe for FREE

Stay informed with the latest T&D policies and technologies.
- Timely insights from industry experts
- Practical solutions T&D engineers
- Free access to every issue

