Protective Relay Training - Basic
Our customized live online or in‑person group training can be delivered to your staff at your location.

- Live Online
- 12 hours Instructor-led
- Group Training Available
Regular Price:
$699
Coupon Price:
$599
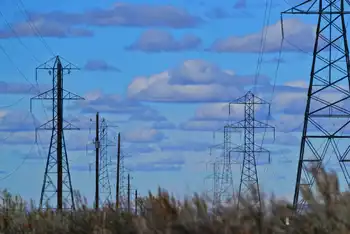
Kansai Electric Power Shortages highlight nuclear shutdown impacts, LNG and crude oil reliance, peak demand gaps in Osaka, Kyoto, and Kobe, and stress-test politics driving delayed reactor restarts and rising electricity costs.
What's Going On
Supply shortfalls in Kansai after reactor shutdowns, forcing LNG and oil use and risking 41 summer shortage days.
- Estimated costs hit 1.7 trillion yen in FY2012-13, from 1.3 trillion.
- Only 2 of 54 reactors online after March 2011 disaster.
- LNG use at 7.3 million tons; crude oil near 5 million kL.
Kansai Electric Power Co. said costs to run thermal plants and purchase electricity from other companies will rise by about 400 billion yen $4.85 billion next fiscal year without the restart of a nuclear reactor.
The Osaka-based company estimated the total costs to fill the void left by nuclear reactors shut for safety checks amid a broader nuclear debate over energy policy would total more than 1.7 trillion yen for the year ending March 2013, up from 1.3 trillion yen this fiscal year, according to a presentation on its website.
Only two of Japan’s 54 nuclear reactors remain online after the March 11, 2011, quake and tsunami crippled Tokyo Electric Power Co.’s Fukushima Dai-Ichi nuclear station. The government has said it won’t approve the restart of reactors, even if they pass so-called stress tests, despite the generation drop reported nationwide, unless local authorities agree.
Kansai Electric’s crude oil consumption in the year ending March is estimated to be nearly 5 million kiloliters 31.4 million barrels, reflecting a broader increase in oil use among utilities, while use of liquefied natural gas is expected to reach about 7.3 million tons, which is the capacity of its facilities.
The company’s maximum supply capacity this summer without nuclear power is estimated at 23.98 million kilowatts, and it plans to restart thermal units to ease constraints, the presentation said. That’s 13.9 percent less than the 27.84 million kilowatts of peak electricity demand last summer in the Kansai region that includes the cities of Osaka, Kyoto and Kobe.
Based on that forecast, the utility expects 41 days of power shortages between July and September, while Tokyo power shortages were also projected in separate reports.
Related News
Related News
Energy experts: US electric grid not designed to withstand the impacts of climate change
Summer Power Grid Reliability and Climate Risk drives urgent planning as extreme heat, peak demand,…
View more
New rules give British households right to sell solar power back to energy firms
UK Smart Export Guarantee enables households to sell surplus solar energy to suppliers, with dynamic…
View more

Victims of California's mega-fire will sue electricity company
PG&E Wildfire Lawsuit alleges utility negligence, inadequate infrastructure maintenance, and faulty transmission lines, as victims…
View more

Roads Need More Electricity: They Will Make It Themselves
Electrically Smart Roads integrate solar road surfaces, inductive charging, IoT sensors, AI analytics, and V2X…
View more
Pickering nuclear station is closing as planned, despite calls for refurbishment
Ontario Pickering Nuclear Closure will shift supply to natural gas, raising emissions as the electricity…
View more
As California enters a brave new energy world, can it keep the lights on?
California Grid Transition drives decarbonization with renewable energy, EV charging, microgrids, and energy storage, while…
View more
Sign Up for Electricity Forum’s Newsletter
Stay informed with our FREE Newsletter — get the latest news, breakthrough technologies, and expert insights, delivered straight to your inbox.
Electricity Today T&D Magazine Subscribe for FREE

Stay informed with the latest T&D policies and technologies.
- Timely insights from industry experts
- Practical solutions T&D engineers
- Free access to every issue
