Kaspersky Lab Discovers Russian Hacker Infrastructure
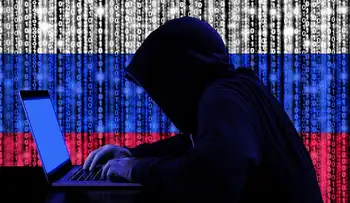

russian hacking code

NFPA 70b Training - Electrical Maintenance

Our customized live online or in‑person group training can be delivered to your staff at your location.

  • Live Online
  • 12 hours Instructor-led
  • Group Training Available
Regular Price:
$599
Coupon Price:
$499
Reserve Your Seat Today

Crouching Yeti APT targets energy infrastructure with watering-hole attacks, compromising servers to steal credentials and stage intrusions; Kaspersky Lab links the Energetic Bear group to ICS threats across Russia, US, Europe, and Turkey.


Key Points

Crouching Yeti APT, aka Energetic Bear, is a threat group that targets energy firms using watering-hole attacks.

✅ Targets energy infrastructure via watering-hole compromises

✅ Uses open-source tools and backdoored sshd for persistence

✅ Scans global servers to stage intrusions and steal credentials


A hacker collective known for attacking industrial companies around the world have had some of their infrastructure identified by Russian security specialists.

Kaspersky Lab said that it has discovered a number of servers compromised by the group, belonging to different organisations based in Russia, the US, and Turkey, as well as European countries.

The Russian-speaking hackers, known as Crouching Yeti or Energetic Bear, mostly focus on energy facilities, as seen in reports of infiltration of the U.S. power grid targeting critical infrastructure, for the main purpose of stealing valuable data from victim systems.


Hacked servers

Crouching Yeti is described as an advanced persistent threat (APT) group that Kaspersky Lab has been tracking since 2010.

#google#

Kaspersky Lab said that the servers it has compromised are not just limited to industrial companies. The servers were hit in 2016 and 2017 with different intentions. Some were compromised to gain access to other resources or to be used as intermediaries to conduct attacks on other resources.

Others, including those hosting Russian websites, were used as watering holes.

It is a common tactic for Crouching Yeti to utilise watering hole attacks where the attackers inject websites with a link redirecting visitors to a malicious server.

“In the process of analysing infected servers, researchers identified numerous websites and servers used by organisations in Russia, US, Europe, Asia and Latin America that the attackers had scanned with various tools, possibly to find a server that could be used to establish a foothold for hosting the attackers’ tools and to subsequently develop an attack,” said the security specialists in a blog posting.

“The range of websites and servers that captured the attention of the intruders is extensive,” the firm said. “Kaspersky Lab researchers found that the attackers had scanned numerous websites of different types, including online stores and services, public organisations, NGOs, manufacturing, etc.

Kaspersky Lab said that the hackers used publicly available malicious tools, designed for analysing servers, and for seeking out and collecting information. The researchers also found a modified sshd file with a preinstalled backdoor. This was used to replace the original file and could be authorised with a ‘master password’.

“Crouching Yeti is a notorious Russian-speaking group that has been active for many years and is still successfully targeting industrial organisations through watering hole attacks, among other techniques,” explained Vladimir Dashchenko, head of vulnerability research group at Kaspersky Lab ICS CERT.


Russian government?

“Our findings show that the group compromised servers not only for establishing watering holes, but also for further scanning, and they actively used open-sourced tools that made it much harder to identify them afterwards,” he said.

“The group’s activities, such as initial data collection, the theft of authentication data, and the scanning of resources, are used to launch further attacks,” said Dashchenko. “The diversity of infected servers and scanned resources suggests the group may operate in the interests of the third parties.”

This may well tie into a similar conclusion from a rival security vendor.

In 2014 CrowdStrike claimed that the ‘Energetic Bear’ group was also tracked in Symantec's Dragonfly research and had been hacking foreign companies on behalf of the Russian state.

The security vendor had said the group had been carrying out attacks on foreign companies since 2012, with reports of breaches at U.S. power plants that underscored the campaign, and there was evidence that these operations were sanctioned by the Russian government.

Last month the United States for the first time publicly accused Russia in a condemnation of Russian grid hacking of attacks against the American power grid.

Symantec meanwhile warned last year of a resurgence in cyber attacks on European and US energy companies, including reports of access to U.S. utility control rooms that could result in widespread power outages.

And last July the UK’s National Cyber Security Centre (NCSC) acknowledged it was investigating a broad wave of attacks on companies in the British energy and manufacturing sectors.


Related News

Related News

California just made more clean energy than it needed

CAISO Net Negative Emissions signal moments when greenhouse gas intensity of serving ISO demand drops below zero, driven by high renewable generation, low load, strong solar exports, and imports accounting in the California grid.


Key Points

Moments when CAISO's CO2 to serve demand is below zero, driven by renewables, exports, and import accounting.

✅ Calculated using imports and exports to serve ISO demand

✅ Occur during high solar output, low weekend load

✅ Coincide with curtailment and record renewable penetration


We’re a long way from the land of milk and honey, but on Easter Sunday – for about an hour – we got a taste.

On Sunday, at 1:55 PM Pacific Time the California Independent Systems Operator (CAISO) reported that greenhouse gas emissions necessary to serve its demand (~80% of California’s electricity demand on an annual basis), was measured at a rate -16 metric tons of CO2 per hour. Five minutes later, the value was -2 mTCO2/h, before it crept back up to 40 mTCO2/h at 2:05 PM PST. At 2:10 PST though it fell back to -86 mTCO2/h and stayed negative until 3:05 PM PST, even as global CO2 emissions flatlined in 2019 according to the IEA.

This information was brought to the attention of pv magazine via tweet from eagle eye Jon Pa after CAISO’s site first noted the negative values:

The region was still generating CO2 though, as natural gas, biogas, biomass, geothermal and even coal plants were running and pumping out emissions, even as potent greenhouse gases declined in the US under control efforts. CAISO’s Greenhouse Gas Emission Tracking Methodology, December 28, 2016 (pdf) notes the below calculations to create the value what it terms, “Total GHG emissions to serve ISO demand”:

Of importance to note is that to get to the net negative value, CAISO considered all electricity imports and exports, a reminder that climate policy shapes grid operations across North America. And as can be noted in the image below the CO2 intensity of imports during the day rapidly declined as the sun came up, first going negative around 9:05 AM PST, and mostly staying so until just before 6 PM PST.

During this same weekend, other records were noted (reiterating that we’re in record setting season and as the state pursues its 100% carbon-free mandate now in law) such as a new electricity export record of greater than 2 GW and total renewable electricity as part of total demand at greater than 70%.

At the peak negative moment of 2:15 PM PST, -112 mTCO2/h seen below, the total amount of clean instantaneous generation being used in the power grid region was 17 GW, a far cry from heat-driven reliability strains like rolling blackout warnings that arise during extreme demand, with renewables giving 76% of the total, hydro 14%, nuclear 13% and imports of -12% countering the CO2 coming from just over 1.4 GW of gas generation.

Also of importance are a few layers of nuance in the electricity demand charts. First off we’re in the shoulder seasons  of California – nice cool weather before the warmth of summer drives air conditioning demand. Additional the weekend electricity demand is always lower, as well, Easter Sunday might have had an affect, whereas in colder regions Calgary’s electricity use can soar during frigid snaps.

Lastly to note was the amount of electricity from solar and wind generation being curtailed. And while the Sunday numbers weren’t available yet, the below image noted Saturday with 10 GWh in total being curtailed (pdf) – peaking at over 3.2 GW of instantaneous mostly solar power even as solar is now the cheapest electricity according to the IEA, in the hours of 2 and 3 PM PST. On an annualized basis, less than 2% of total potential solar electricity was curtailed in 2018.


Related News

View more

How Synchrophasors are Bringing the Grid into the 21st Century

Synchrophasors deliver PMU-based, real-time monitoring for the smart grid, helping NYISO prevent blackouts, cut costs, and integrate renewables, with DOE-backed deployments boosting reliability, situational awareness, and data sharing across regional partners.


Key Points

Synchrophasors, or PMUs, are grid sensors that measure synced voltage, current, and frequency to enhance reliability.

✅ Real-time grid visibility and situational awareness

✅ Early fault detection to prevent cascading outages

✅ Supports renewable integration and lowers operating costs


Have you ever heard of a synchrophasor? It may sound like a word out of science fiction, but these mailbox-sized devices are already changing the electrical grid as we know it.

The grid was born over a century ago, at a time when our needs were simpler and our demand much lower. More complex needs are putting a heavy strain on the aging infrastructure, which is why we need to innovate and update our grid with investments in a smarter electricity infrastructure so it’s ready for the demands of today.

That’s where synchrophasors come in.

A synchrophasor is a sophisticated monitoring device that can measure the instantaneous voltage, current and frequency at specific locations on the grid. This gives operators a near-real-time picture of what is happening on the system, including insights into power grid vulnerabilities that allow them to make decisions to prevent power outages.

Just yesterday I attended the dedication of the New York Independent System Operator's smart grid control center, a $75 million project that will use these devices to locate grid problems at an early stage and share these data with their regional partners. This should mean fewer blackouts for the State of New York. I would like to congratulate NYISO for being a technology leader.

And not only will these synchrophasors help prevent outages, but they also save money. By providing more accurate and timely data on system limits, synchrophasors make the grid more reliable and efficient, thereby reducing planning and operations costs and addressing grid modernization affordability concerns for utilities.

The Department has worked with utilities across the country to increase the number of synchrophasors five-fold -- from less than 200 in 2009 to over 1,700 today. And this is just a part of our commitment to making a smarter, more resilient grid a reality, reinforced by grid improvement funding from DOE.

In September 2013, the US Department of Energy announced up to $9 million in funding to facilitate rapid response to unusual grid conditions. As a result, utilities will be able to better detect and head off potential blackouts, while improving day-to-day grid reliability and helping with the integration of solar into the grid and other clean renewable sources.

If you’d like to learn more about our investments in the smart grid and how they are improving our electrical infrastructure, please visit the Office of Electricity Delivery and Energy Reliability’s www.smartgrid.gov.

Patricia Hoffman is Assistant Secretary, Office of Electricity Delivery & Energy Reliability


Related News

View more

Energy Efficiency and Demand Response Can Nearly Level Southeast Electricity Demand for More than a Decade

Southeast Electricity Demand Forecast examines how energy efficiency, photovoltaics, electric vehicles, heat pumps, and demand response shape grid needs, stabilize load through 2030, shift peaks, and inform utility planning across the region.


Key Points

An outlook of load shaped by efficiency, solar, EVs, with demand response keeping usage steady through 2030.

✅ Stabilizes regional demand through 2030 under accelerated adoption

✅ Energy efficiency and demand response are primary levers

✅ EVs and heat pumps drive growth post 2030; shift winter peaks


Electricity markets in the Southeast are facing many changes on the customer side of the meter. In a new report released today, we look at how energy efficiency, photovoltaics (solar electricity), electric vehicles, heat pumps, and demand response (shifting loads from periods of high demand) might affect electricity needs in the Southeast.

We find that if all of these resources are pursued on an accelerated basis, electricity demand in the region can be stabilized until about 2030.

After that, demand will likely grow in the following decade because of increased market penetration of electric vehicles and heat pumps, but energy planners will have time to deal with this growth if these projections are borne out. We also find that energy efficiency and demand response can be vital for managing electricity supply and demand in the region and that these resources can help contain energy demand growth, reducing the impact of expensive new generation on consumer wallets.


National trends

This is the second ACEEE report looking at regional electricity demand. In 2016, we published a study on electricity consumption in New England, finding an even more pronounced effect. For New England, with even more aggressive pursuit of energy efficiency and these other resources, consumption was projected to decline through about 2030, before rebounding in the following decade.

These regional trends fit into a broader national pattern. In the United States, electricity consumption has been characterized by flat electricity demand for the past decade. Increased energy efficiency efforts have contributed to this lack of consumption growth, even as the US economy has grown since the Great Recession. Recently, the US Energy Information Administration (EIA – a branch of the US Department of Energy) released data on US electricity consumption in 2016, finding that 2016 consumption was 0.3% below 2015 consumption, and other analysts reported a 1% slide in 2023 on milder weather.


Five scenarios for the Southeast

ACEEE’s new study focuses on the Southeast because it is very different from New England, with warmer weather, more economic growth, and less-aggressive energy efficiency and distributed energy policies than the Northeast. For the Southeast, we examined five scenarios: a business-as-usual scenario; two alternative scenarios with progressively higher levels of energy efficiency, photovoltaics informed by a solar strategy for the South that is emerging regionally, electric vehicles, heat pumps, and demand response; and two scenarios combining high numbers of electric vehicles and heat pumps with more modest levels of the other resources. This figure presents electricity demand for each of these scenarios:

Over the 2016-2040 period, we project that average annual growth will range from 0.1% to 1.0%, depending on the scenario, much slower than historic growth in the region. Energy efficiency is generally the biggest contributor to changes in projected 2040 electricity consumption relative to the business-as-usual scenario, as shown in the figure below, which presents our accelerated scenario that is based on levels of energy efficiency and other resources now targeted by leading states and utilities in the Southeast.

To date, Entergy Arkansas has achieved the annual efficiency savings as a percent of sales shown in the accelerated scenario and Progress Energy (a division of Duke Energy) has nearly achieved those savings in both North and South Carolina. Sixteen states outside the Southeast have also achieved these savings statewide.

The efficiency savings shown in the aggressive scenario have been proposed by the Arkansas PSC. This level of savings has already been achieved by Arizona as well as six other states. Likewise, the demand response savings we model have been achieved by more than 10 utilities, including four in the Southeast. The levels of photovoltaic, electric vehicle, and heat pump penetration are more speculative and are subject to significant uncertainty.

We also examined trends in summer and winter peak demand. Most utilities in the Southeast have historically had peak demand in the summer, often seeing heatwave-driven surges that stress operations across the Eastern U.S., but our analysis shows that winter peaks will be more likely in the region as photovoltaics and demand response reduce summer peaks and heat pumps increase winter peaks.


Why it’s vital to plan broadly

Our analysis illustrates the importance of incorporating energy efficiency, demand response, and photovoltaics into utility planning forecasts as utility trends to watch continue to evolve. Failing to include these resources leads to much higher forecasts, resulting in excess utility system investments, unnecessarily increasing customer electricity rates. Our analysis also illustrates the importance of including electric vehicles and heat pumps in long-term forecasts. While these technologies will have moderate impacts over the next 10 years, they could become increasingly important in the long run.

We are entering a dynamic period of substantial uncertainty for long-term electricity sales and system peaks, highlighted by COVID-19 demand shifts that upended typical patterns. We need to carefully observe and analyze developments in energy efficiency, photovoltaics, electric vehicles, heat pumps, and demand response over the next few years. As these technologies advance, we can create policies to reduce energy bills, system costs, and harmful emissions, drawing on grid reliability strategies tested in Texas, while growing the Southeast’s economy. Resource planners should be sure to incorporate these emerging trends and policies into their long-term forecasts and planning.


Related News

View more

Hong Kong to expect electricity bills to rise 1 or 2 per cent

Hong Kong Electricity Tariff Increase reflects a projected 1-2% rise as HK Electric and CLP Power shift to cleaner fuel and natural gas, expand gas-fired units and LNG terminals, and adjust the fuel clause charge.


Key Points

An expected 1-2% 2018 rise from cleaner fuel, natural gas projects, asset growth, and shrinking fuel cost surpluses.

✅ Expected 1-2% rise amid cleaner fuel and gas shift

✅ Fuel clause charge and asset expansion pressure prices

✅ HK Electric and CLP Power urged to use surpluses prudently


Hong Kong customers have been asked to expect higher electricity bills next year, as seen with BC Hydro rate increases in Canada, with a member of a government panel on energy policy anticipating an increase in tariffs of one or two per cent.

The environment minister, Wong Kam-sing, also hinted they should be prepared to dig deeper into their pockets for electricity, as debates over California electric bills illustrate, in the wake of power companies needing to use more expensive but cleaner fuel to generate power in the future.

HK Electric supplies power to Hong Kong Island, Lamma Island and Ap Lei Chau. Photo: David Wong

The city’s two power companies, HK Electric and CLP Power, are to brief lawmakers on their respective annual tariff adjustments for 2018, amid Ontario electricity price pressures drawing international attention, at a Legislative Council economic development panel meeting on Tuesday.

HK Electric supplies electricity to Hong Kong Island and neighbouring Lamma Island and Ap Lei Chau, while CLP Power serves Kowloon and the New Territories, including Lantau Island.

Wong said on Monday: “We have to appreciate that when we use cleaner fuel, there is a need for electricity tariffs to keep pace. I believe it is the hope of mainstream society to see a low-carbon and healthier environment.”

Secretary for the Environment Wong Kam-sing believes most people desire a low-carbon environment. Photo: Sam Tsang

But he declined to comment on how much the tariffs might rise.

World Green Organisation chief executive William Yu Yuen-ping, also a member of the Energy Advisory Committee, urged the companies to better use their “overflowing” surpluses in their fuel cost recovery accounts.

Tariffs are comprised of two components: a basic amount reflecting a company’s operating costs and investments, and the fuel clause charge, which is based on what the company projects it will pay for fuel for the year.

William Yu of World Green Organisation says the companies should use their surpluses more carefully. Photo: May Tse

Critics have claimed the local power suppliers routinely overestimate their fuel costs and amass huge surpluses.

In recent years, the two managed to freeze or cut their tariffs thanks to savings from lower fuel costs. Last year, HK Electric offered special rebates to its customers, which saw its tariff drop by 17.2 per cent. CLP Power froze its own charge for 2017.

Yu said the two companies should use the surpluses “more carefully” to stabilise tariffs.

Rise after fall in Hong Kong electricity use linked to subsidies

“We estimate a big share of the surplus has been used up and so the honeymoon period is over.”

Based on his group’s research, Yu believed the tariffs would increase by one or two per cent.

Economist and fellow committee member Billy Mak Sui-choi said the expansion of the power companies’ fixed asset bases, such as building new gas-fired units and offshore liquefied natural gas terminals, a pattern reflected in Nova Scotia's 14% rate hike recently approved by regulators, would also cause tariffs to rise.

To fight climate change and improve air quality, the government has pledged to cut carbon intensity by between 50 and 60 per cent by 2020. Officials set a target of boosting the use of natural gas for electricity generation to half the total fuel mix from 2020.

Both power companies are privately owned and monitored by the government through a mutually agreed scheme of control agreements, akin to oversight seen under the UK energy price cap in other jurisdictions. These require the firms to seek government approval for their development plans, including their projected basic tariff levels.

At present, the permitted rate of return on their net fixed assets is 9.99 per cent. The deals are due to expire late next year.

Earlier this year, officials reached a deal with the two companies on the post-2018 scheme, settling on a 15-year term. The new agreements slash their permitted rate of return to 8 per cent.


Related News

View more

Why power companies should be investing in carbon-free electricity

Noncarbon Electricity Investment Strategy helps utilities hedge policy uncertainty, carbon tax risks, and emissions limits by scaling wind, solar, and CCS, avoiding stranded assets while balancing costs, reliability, and climate policy over decades.


Key Points

A strategy for utilities to invest 20-30 percent of capacity in low carbon sources to hedge emissions and carbon risks.

✅ Hedges future carbon tax and emissions limits

✅ Targets 20-30 percent of new generation from clean sources

✅ Reduces stranded asset risk and builds renewables capacity


When utility executives make decisions about building new power plants, a lot rides on their choices. Depending on their size and type, new generating facilities cost hundreds of millions or even billions of dollars. They typically will run for 40 or more years — 10 U.S. presidential terms. Much can change during that time.

Today one of the biggest dilemmas that regulators and electricity industry planners face is predicting how strict future limits on greenhouse gas emissions will be. Future policies will affect the profitability of today’s investments. For example, if the United States adopts a carbon tax 10 years from now, it could make power plants that burn fossil fuels less profitable, or even insolvent.

These investment choices also affect consumers. In South Carolina, utilities were allowed to charge their customers higher rates to cover construction costs for two new nuclear reactors, which have now been abandoned because of construction delays and weak electricity demand. Looking forward, if utilities are reliant on coal plants instead of solar and wind, it will be much harder and more expensive for them to meet future emissions targets, even as New Zealand's electrification push accelerates abroad. They will pass the costs of complying with these targets on to customers in the form of higher electricity prices.

With so much uncertainty about future policy, how much should we be investing in noncarbon electricity generation in the next decade? In a recent study, we proposed optimal near-term electricity investment strategies to hedge against risks and manage inherent uncertainties about the future.

We found that for a broad range of assumptions, 20 to 30 percent of new generation in the coming decade should be from noncarbon sources such as wind and solar energy across markets. For most U.S. electricity providers, this strategy would mean increasing their investments in noncarbon power sources, regardless of the current administration’s position on climate change.

Many noncarbon electricity sources — including wind, solar, nuclear power and coal or natural gas with carbon capture and storage — are more expensive than conventional coal and natural gas plants. Even wind power, which is often mentioned as competitive, is actually more costly when accounting for costs such as backup generation and energy storage to ensure that power is available when wind output is low.

Over the past decade, federal tax incentives and state policies designed to promote clean electricity sources spurred many utilities to invest in noncarbon sources. Now the Trump administration is shifting federal policy back toward promoting fossil fuels. But it can still make economic sense for power companies to invest in more expensive noncarbon technologies if we consider the potential impact of future policies.

How much should companies invest to hedge against the possibility of future greenhouse gas limits? On one hand, if they invest too much in noncarbon generation and the federal government adopts only weak climate policies throughout the investment period, utilities will overspend on expensive energy sources.

On the other hand, if they invest too little in noncarbon generation and future administrations adopt stringent emissions targets, utilities will have to replace high-carbon energy sources with cleaner substitutes, which could be extremely costly.


Economic modeling with uncertainty

We conducted a quantitative analysis to determine how to balance these two concerns and find an optimal investment strategy given uncertainty about future emissions limits. This is a core choice that power companies have to make when they decide what kinds of plants to build.

First we developed a computational model that represents the sectors of the U.S. economy, including electric power. Then we embedded it within a computer program that evaluates decisions in the electric power sector under policy uncertainty.

The model explores different electric power investment decisions under a wide range of future emissions limits with different probabilities of being implemented. For each decision/policy combination, it computes and compares economy-wide costs over two investment periods extending from 2015 to 2030.

We looked at costs across the economy because emissions policies impose costs on consumers and producers as well as power companies. For example, they may lead to higher electricity, fuel or product prices. By seeking to minimize economy-wide costs, our model identifies the investment decision that produces the greatest overall benefits to society.


More investments in clean generation make economic sense

We found that for a broad range of assumptions, the optimal investment strategy for the coming decade is for 20 to 30 percent of new generation to be from noncarbon sources. Our model identified this as the best level because it best positions the United States to meet a wide range of possible future policies at a low cost to the economy.

From 2005-2015, we calculated that about 19 percent of the new generation that came online was from noncarbon sources. Our findings indicate that power companies should put a larger share of their money into noncarbon investments in the coming decade.

While increasing noncarbon investments from a 19 percent share to a 20 to 30 percent share of new generation may seem like a modest change, it actually requires a considerable increase in noncarbon investment dollars. This is especially true since power companies will need to replace dozens of aging coal-fired power plants that are expected to be retired.

In general, society will bear greater costs if power companies underinvest in noncarbon technologies than if they overinvest. If utilities build too much noncarbon generation but end up not needing it to meet emissions limits, they can and will still use it fully. Sunshine and wind are free, so generators can produce electricity from these sources with low operating costs.

In contrast, if the United States adopts strict emissions limits within a decade or two, they could prevent carbon-intensive generation built today from being used. Those plants would become “stranded assets” — investments that are obsolete far earlier than expected, and are a drain on the economy.

Investing early in noncarbon technologies has another benefit: It helps develop the capacity and infrastructure needed to quickly expand noncarbon generation. This would allow energy companies to comply with future emissions policies at lower costs.


Seeing beyond one president

The Trump administration is working to roll back Obama-era climate policies such as the Clean Power Plan, and to implement policies that favor fossil generation. But these initiatives should alter the optimal strategy that we have proposed for power companies only if corporate leaders expect Trump’s policies to persist over the 40 years or more that these new generating plants can be expected to run.

Energy executives would need to be extremely confident that, despite investor pressure from shareholders, the United States will adopt only weak climate policies, or none at all, into future decades in order to see cutting investments in noncarbon generation as an optimal near-term strategy. Instead, they may well expect that the United States will eventually rejoin worldwide efforts to slow the pace of climate change and adopt strict emissions limits.

In that case, they should allocate their investments so that at least 20 to 30 percent of new generation over the next decade comes from noncarbon sources. Sustaining and increasing noncarbon investments in the coming decade is not just good for the environment — it’s also a smart business strategy that is good for the economy.


Related News

View more

Power Co-Op Gets Bond Rating Upgrade After Exiting Kemper Deal

Cooperative Energy bond rating upgrade signals lower debt costs as Fitch lifts GO Zone Bonds to A, reflecting Kemper exit, shift to owned generation, natural gas, and renewable energy for co-op members and borrowing rates.


Key Points

Fitch raised Cooperative Energy's GO Zone Bonds to A, cutting debt costs after Kemper exit and shift to natural gas.

✅ Fitch upgrades 2009A GO Zone Bonds from A- to A.

✅ Kemper divestment reduced risk and exposure to coal.

✅ Shift to owned generation, natural gas, renewables lowers costs.


Cooperative Energy and its 11 co-op members will see lower debt costs on $35.4 million bond; similar to regional utilities offering one-time bill decreases for customers recently.

Bailing out of its 15 percent ownership stake in Mississippi Power’s Kemper gasification plant, amid debates over coal and nuclear subsidies in federal policy, has helped Hattiesburg-based Cooperative Energy gain a ratings upgrade on a $35.4 million bond issue.

The electric power co-op, which changed its name to Cooperative Energy from South Mississippi Electric Power Association in November, received a ratings upgrade from A- to A for its 2009 2009A Mississippi Business Finance Corporation Gulf Opportunity Zone Bonds, even as other utilities announced bill reductions for customers during 2020.

“This rating upgrade reflects the success of our strategy to move from purchased power to owned generation resources, and from coal to natural gas and renewable energy as clean energy priorities gain traction,” said Cooperative Energy President/CEO Jim Compton in a press release.  “The result for our members is lower borrowing costs and more favorable rates.”

An “A” rating from Fitch designates the bond issue as “near premium quality,” a status noted as utilities adapted to pandemic-era electricity demand trends nationwide.


Related News

View more

Sign Up for Electricity Forum’s Newsletter

Stay informed with our FREE Newsletter — get the latest news, breakthrough technologies, and expert insights, delivered straight to your inbox.

Electricity Today T&D Magazine Subscribe for FREE

Stay informed with the latest T&D policies and technologies.
  • Timely insights from industry experts
  • Practical solutions T&D engineers
  • Free access to every issue

Download the 2025 Electrical Training Catalog

Explore 50+ live, expert-led electrical training courses –

  • Interactive
  • Flexible
  • CEU-cerified