Substation Relay Protection Training
Our customized live online or in‑person group training can be delivered to your staff at your location.

- Live Online
- 12 hours Instructor-led
- Group Training Available
Regular Price:
$699
Coupon Price:
$599
LONDON
—
IEA Electricity Market Outlook 2023-2025 projects faster demand growth as renewables and nuclear dominate supply, stabilizing power-sector carbon emissions, with Asia leading expansion despite energy crisis shocks and weather-driven volatility.
Context and Background
IEA forecast for 2023-2025 electricity demand: renewables and nuclear meet growth as power-sector emissions hold steady.
Global demand growth averages 3% through 2025 after 2% in 2022
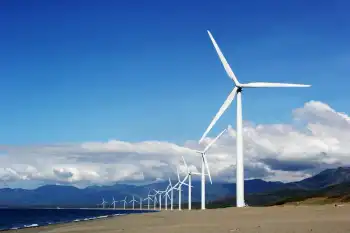
Renewables' share rises to 35% by 2025, surpassing coal generation
Nuclear and renewables meet most new load, limiting CO2 emissions
Asia drives over 70% of growth; China nears one-third of demand
System flexibility and grid resilience needed for weather shocks
The world’s electricity demand growth slowed only slightly in 2022, despite headwinds from the energy crisis, and is expected to accelerate in the years ahead
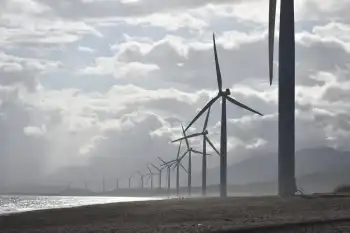
Renewables are set to dominate the growth of the world’s electricity supply over the next three years as, renewables eclipse coal in global generation, together with nuclear power they meet the vast majority of the increase in global demand through to 2025, making significant rises in the power sector’s carbon emissions unlikely, according to a new IEA report.
After slowing slightly last year to 2% amid the turmoil of the global energy crisis and exceptional weather conditions in some regions, the growth in world electricity demand is expected to accelerate to an average of 3% over the next three years, the IEA’s Electricity Market Report 2023 finds. Emerging and developing economies in Asia are the driving forces behind this faster pace, which is a step up from average growth of 2.4% during the years before the pandemic and above pre-pandemic levels globally.
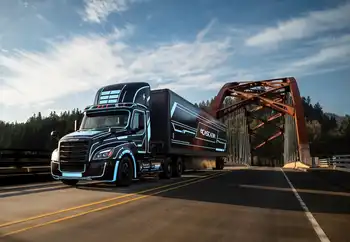
More than 70% of the increase in global electricity demand over the next three years is expected to come from China, India and Southeast Asia, as Asia’s power use nears half of the world by mid-decade, although considerable uncertainties remain over trends in China as its economy emerges from strict Covid restrictions. China’s share of global electricity consumption is currently forecast to rise to a new record of one-third by 2025, up from one-quarter in 2015. At the same time, advanced economies are seeking to expand electricity use to displace fossil fuels in sectors such as transport, heating and industry.
“The world’s growing demand for electricity is set to accelerate, adding more than double Japan’s current electricity consumption over the next three years,” said IEA Executive Director Fatih Birol. “The good news is that renewables and nuclear power are growing quickly enough to meet almost all this additional appetite, suggesting we are close to a tipping point for power sector emissions. Governments now need to enable low-emissions sources to grow even faster and drive down emissions so that the world can ensure secure electricity supplies while reaching climate goals.”
While natural gas-fired power generation in the European Union is forecast to fall in the coming years, as wind and solar outpaced gas in 2022, based on current trends, significant growth in the Middle East is set to partly offset this decrease. Sharp spikes in natural gas prices amid the energy crisis have in turn fuelled soaring electricity prices in some markets, particularly in Europe, prompting debate in policy circles over reforms to power market design.
Meanwhile, expected declines in coal-fired generation in Europe and the Americas are likely to be matched by a rise in the Asia-Pacific region, despite increases in nuclear power deployment and restarts of plants in some countries such as Japan. This means that after reaching an all-time high in 2022, carbon dioxide (CO2) emissions from global power generation are set to remain around the same level through 2025.
The strong growth of renewables means their share of the global power generation mix is forecast to rise from 29% in 2022 to 35% in 2025, with the shares of coal- and gas-fired generation falling. As a result, the CO2 intensity of global power generation will continue to decrease in the coming years. Europe bucked this global trend last year, however. The CO2 intensity of Europe’s power generation increased as a result of higher use of coal and gas amid steep drops in output from both hydropower, due to drought, and nuclear power, due to plant closures and maintenance. This setback will be temporary, though, as Europe’s power generation emissions are expected to decrease on average by about 10% a year through 2025.
Electricity demand trends varied widely by region in 2022. India’s electricity consumption rose strongly, while China’s growth was more subdued due to its zero-Covid policy weighing heavily on economic activity. The United States recorded a robust increase in demand, driven by economic activity and higher residential use amid hotter summer weather and a colder-than-normal winter, even as electricity sales projections continue to decline according to some outlooks.


Demand in the European Union contracted due to unusually mild winter weather and a decline in electricity consumption in the industrial sector, which significantly scaled back production because of high energy prices and supply disruptions caused by Russia’s invasion of Ukraine. The 3.5% decrease in EU demand was its second largest percentage decline since the global financial crisis in 2009, with the largest being the exceptional contraction due to the COVID-19 shock in 2020.
The new IEA report notes that electricity demand and supply worldwide are becoming increasingly weather dependent, with extreme conditions a recurring theme in 2022. In addition to the drought in Europe, there were heatwaves in India, resulting in the country’s highest ever peak in power demand. Similarly, central and eastern regions of China were hit by heatwaves and drought, which caused demand for air conditioning to surge amid reduced hydropower generation in Sichuan province. The United States also saw severe winter storms in December, triggering massive power outages.
These highlight the need for faster decarbonisation and accelerated deployment of clean energy technologies, the report says. At the same time, as the clean energy transition gathers pace, the impact of weather events on electricity demand will intensify due to the increased electrification of heating, while the share of weather-dependent renewables will continue to grow in the generation mix. In such a world, increasing the flexibility of power systems, which are under growing strain across grids and markets, while ensuring security of supply and resilience of networks will be crucial.
Related News
Related News
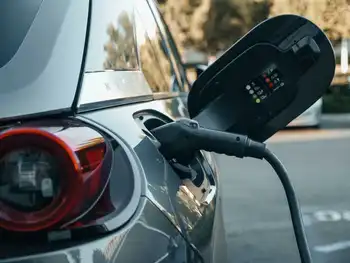
Reversing the charge - Battery power from evs to the grid could open a fast lane
Vehicle-to-Grid V2G unlocks EV charging flexibility and grid services, integrating renewable energy, demand response, and…
View more
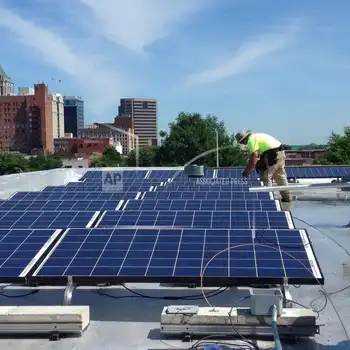
Court Sees If Church Solar Panels Break Electricity Monopoly
NC WARN Solar Case tests third-party solar rights as North Carolina Supreme Court reviews Utilities…
View more
Renewable Electricity Is Coming on Strong
Cascadia electrification accelerates renewable energy with wind and solar, EVs, heat pumps, and grid upgrades…
View more

"Remarkable" New Contract Award Adds 10 GW of Renewables to UK Grid
UK Renewable Energy Auction secures 10 GW for the grid at record-low costs, led by…
View more
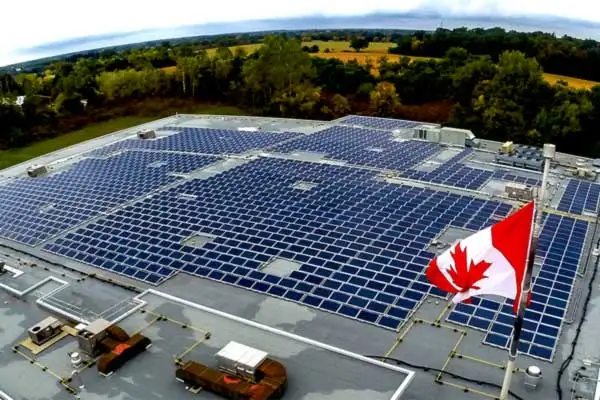
Canada is a solar power laggard, this expert says
Canada Distributed Energy faces disruption as solar, smart grids, microgrids, and storage scale utility-scale renewables,…
View more
Stalled spending on electrical grids slows rollout of renewable energy
IEA Grid Expansion Warning highlights stalled investment in power lines and transmission infrastructure, risking renewable…
View more
Sign Up for Electricity Forum’s Newsletter
Stay informed with our FREE Newsletter — get the latest news, breakthrough technologies, and expert insights, delivered straight to your inbox.
Electricity Today T&D Magazine Subscribe for FREE

Stay informed with the latest T&D policies and technologies.
- Timely insights from industry experts
- Practical solutions T&D engineers
- Free access to every issue

