Protective Relay Training - Basic
Our customized live online or in‑person group training can be delivered to your staff at your location.

- Live Online
- 12 hours Instructor-led
- Group Training Available
Regular Price:
$699
Coupon Price:
$599
NEW DELHI
—
India Village Electrification hailed by the IEA in World Energy Outlook 2018 showcases rapid energy access progress, universal village power, clean cooking advances via LPG, and Modi-led initiatives, inspiring Indonesia, Bangladesh, and Sub-Saharan Africa.
Context and Background
A national push to power every Indian village, praised by the IEA for boosting energy access and clean cooking.
IEA World Energy Outlook 2018 hails India a star performer
All 597,464 villages electrified, goal met ahead of schedule
Access gains lift 230M people; EV market growth also noted
Big gaps persist: 670M lack power, 90% in sub-Saharan Africa
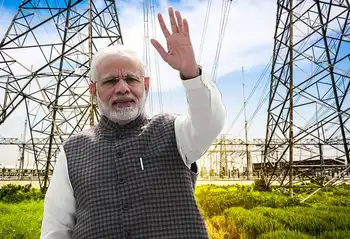
The global energy watchdog International Energy Agency (IEA) has called India's electrification of every village the greatest success story of 2018. In its latest report, World Energy Outlook 2018, the IEA has called India a "star performer" in terms of achieving the big milestone of the providing power to each village. "In particular, one of the greatest success stories in access to energy in 2018 was India completing the electrification of all of its villages," said the IEA. It added that countries like Indonesia and Bangladesh have also achieved the commendable electrification rate of 95% (up from 50% in 2000), and 80% (up from 20% in 2000), respectively, even as Europe's electrification push continues as part of broader transitions.
This 643-page report by the IEA says over 120 million people worldwide gained access to electricity in 2017 and charts growth in the electric car market as part of broader energy trends. For the first time ever, the total number of people without access fell below 1 billion, it said. The mega plan of providing electricity to 597,464 villages in India was announced by Prime Minister Narendra Modi during his Independence Day speech in 2015. On April 28, 2018, PM Modi confirmed that India had achieved its goal ahead of schedule. "This is one of the greatest achievements in the history of energy," said the IEA.
Praising the Narendra Modi government for making efforts towards lighting up every village in India, the agency said: "Since 2000 around half a billion people have gained access to electricity in India, with political effort over the last five years significantly accelerating progress."
India's achievement of providing universal household electricity access will improve the lives of over 230 million people, said the IEA, even as analyses like a Swedfund report debate some poverty outcomes in electrified areas. For a start, electric lighting makes the use of candles, kerosene and other polluting fuels for lighting redundant, not only saving money (and providing more light) but also seriously improving health, it said.
Though the global energy agency has called India "a success story", and a "bright spot for energy access", it says huge challenges remain in other regions of the world where over 670 million people still live without electricity access. "90% of these people are concentrated in sub-Saharan Africa, with countries such as Nigeria facing severe shortages," said the report.
Seven decades after independence and nearly three decades after India's economic liberalisation, the Modi government achieved the historic milestone of giving power to every single village of India, 12 days ahead of the deadline set by PM Modi. Leisang in Manipur became the last village to be connected to the grid, while a Delhi energy storage project explores ways to balance supply and demand.
The agency also praised India for tackling a related problem: access to clean cooking facilities. "While an estimated 780 million people in India rely on biomass for cooking, progress is emerging, as India is one of the few countries in the world targeting this "blind spot" of energy policy," it said.
Around 36 million LPG connections have been made since Prime Minister Modi and Minister for Petroleum and Natural Gas, Dharmendra Pradhan, launched the Pradhan Mantri Ujjwala Yojana scheme in May 2016 to provide free connections to families living below the poverty line. In India, around 50 million free LPG stoves and initial refills have been provided to poor households via this scheme since 2015. The government has set a target of providing LPG connections to 80 million households by 2020.
Related News
Related News
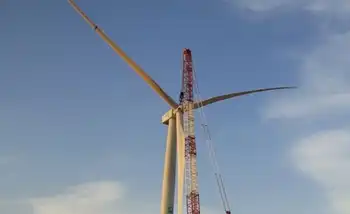
Saudis set to 'boost wind by over 6GW'
Saudi Arabia Wind Power Market set to lead the Middle East, driven by Vision 2030…
View more

Energy Vault Lands $110M From SoftBank’s Vision Fund for Gravity Storage
Energy Vault Gravity Storage uses crane-stacked concrete blocks to deliver long-duration, grid-scale renewable energy; a…
View more
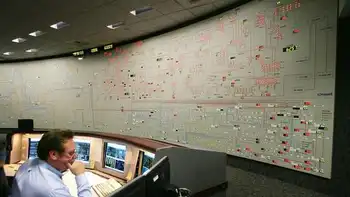
Cal ISO Warns Rolling Blackouts Possible, Calls For Conservation As Power Grid Strains
Cal ISO Flex Alert urges Southern California energy conservation as a Stage 2 emergency strains…
View more
Trump's Vision of U.S. Energy Dominance Faces Real-World Constraints
U.S. Energy Dominance envisions deregulation, oil and gas growth, LNG exports, pipelines, and geopolitical leverage,…
View more
Nevada on track to reach RPS mandate of 50% renewable electricity by 2030: report
Nevada Renewable Portfolio Standard 2030 targets 50% clean energy, advancing solar, geothermal, and wind, cutting…
View more
Almost 500-mile-long lightning bolt crossed three US states
Longest Lightning Flash Record confirmed by WMO: a 477.2-mile megaflash spanning Mississippi, Louisiana, and Texas,…
View more
Sign Up for Electricity Forum’s Newsletter
Stay informed with our FREE Newsletter — get the latest news, breakthrough technologies, and expert insights, delivered straight to your inbox.
Electricity Today T&D Magazine Subscribe for FREE

Stay informed with the latest T&D policies and technologies.
- Timely insights from industry experts
- Practical solutions T&D engineers
- Free access to every issue

