Photovoltaic farming is growing

By Ottawa Sun


Protective Relay Training - Basic

Our customized live online or in‑person group training can be delivered to your staff at your location.

  • Live Online
  • 12 hours Instructor-led
  • Group Training Available
Regular Price:
$699
Coupon Price:
$599
Reserve Your Seat Today
No more winter, no more boots, No more winter's crap snowsuits.

It's my adult-version of a children's anthem telling winter to stick it where the sun don't shine.

And I'm thinking that must be a bad, sad, place.

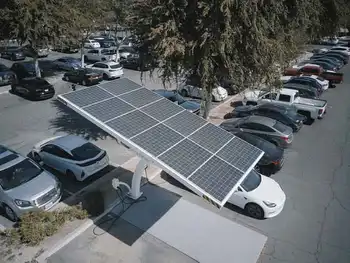
June 20 marked the official beginning of summer and sunshiny days. Every year we're reminded of the healing balm of the sun's rays after a dispiriting winter. We bask in the sun and let the light recharge our depleted batteries - an energy source that's undervalued in a country of sun-worshipping idolaters.

"We have in the populated areas of Canada, a solar resource that's greater than what Germany has," said Frederic Pouyot, president of the Solar Energy Society of Canada from Ottawa. "And Germany is the world leader for solar power."

In 2006, Germany became the first country to install more than one gigawatt of solar power in a single year.

Canada gets between three to five kW/hr per square metre per day of direct sunlight. A kilowatt-hour is calculated by multiplying the wattage of a product by the number of hours it is in use. For example, a 100-watt light bulb will use one kWh if it's illuminated for 10 hours.

"The different levels of government have been supporting oil and gas at $3 billion a year altogether for the last 50 years," Pouyot said of the heavily subsidized industry. "Renewable energy basically gets crumbs."

Meanwhile, unlike fossil fuel-based energies, solar power doesn't carry hidden costs like health care resulting from asthma or cancer, and ensuing productivity loss and absenteeism, he added.

But there's a new dawn rising in Ontario - widely cited as the leader in Canada - as North America's largest solar farm is set to carpet a swath of land in Sarnia with hundreds of thousands of ground-mounted photovoltaic cells which will convert sunlight into electricity. The 50-MW project will be able to power 20,000 homes and will be up and running by 2010, feeding Ontario's electricity grid. Solar PV projects are paid 42 cents/kWh, compared to 11 cents for wind. The province also set up a task force earlier this year to meet its goal of installing 100,000 solar systems in households across the province.

"What PV does is take pressure off during peak periods," adds Elizabeth McDonald, executive director of the Canadian Solar Industries Association and task force member.

So on hot, sunny summer days, when Canadians crank up their AC, solar farms produce electricity when utilities need it most.

While grey winters may cast a cloud over PV efficiency in Canada, Pouyot points out PV can capture up to 80% of light reflected off the snow (called the albedo effect). Solar resources in B.C. are also better than Germany and Japan - world leaders - despite its wet climes.

But for reliable, efficient results, it's important to integrate all the renewable energy forms into the grid, Pouyot says.

"If you combine every technology together, you have the potential to displace the old paradigm of carbon-intensive energies."

According to a 2006 industry report, the energy yield of PV in Canada has been pegged at 14 - that means over its lifetime, the project will produce 14 times the energy that was needed to manufacture it. The energy yield for nuclear is about 16, wind 18-35, and hydro 170-180.

"PV is a new technology. But one kW/hr from the sun is free radiation," Pouyot says.

Solar farms are being erected at a dizzying pace, with countries such as Spain, Portugal, Germany and the state of New Mexico each claiming they boast the world's biggest photovoltaic project.

The growth of the PV market in Canada has been averaging 25% annually since 1993. According to the Earth Policy Institute, production of photovoltaics jumped to 3,800 MW worldwide last year, up 50% from 2006, and has become the world's fastest-growing energy source.

Related News

UK Anticipates a 16% Decrease in Energy Bills in April

UK Energy Price Cap Cut 2024 signals relief as wholesale gas prices fall; Ofgem price cap drops per Cornwall Insight, aided by LNG supply, mild winter, despite Red Sea tensions and Ukraine conflict impacts.


Key Points

A forecast cut to Great Britain's Ofgem price cap as wholesale gas falls, easing typical annual household bills in 2024.

✅ Cap falls from £1,928 to £1,620 in April 2024

✅ Forecast £1,497 in July, then about £1,541 from October

✅ Drivers: lower wholesale gas, LNG supply, mild winter


Households in Great Britain are set to experience a significant reduction in energy costs this spring, with bills projected to drop by over £300 annually. This decrease is primarily due to a decline in wholesale gas prices, offering some respite to those grappling with the cost of living crisis.

Cornwall Insight, a well-regarded industry analyst, predicts a 16% reduction in average bills from the previous quarter, potentially reaching the lowest levels since the onset of the Ukraine conflict.

The industry’s price cap, indicative of the average annual bill for a typical household, is expected to decrease from the current £1,928, set earlier this month, to £1,620 in April – a reduction of £308 and £40 less than previously forecasted in December, as ministers consider ending the gas-electricity price link to improve market resilience.

Concerns about escalating tensions in the Red Sea, where Houthi rebels have disrupted global shipping, initially led analysts to fear an increase in wholesale oil prices and subsequent impact on household energy costs.

Contrary to these concerns, oil prices have remained relatively stable, and European gas reserves have been higher than anticipated during a mild winter, with European gas prices returning to pre-Ukraine war levels since November.

Cornwall Insight anticipates that energy prices will continue to be comparatively low through 2024. They predict a further decline to £1,497 for a typical annual bill from July, followed by a slight increase to £1,541 starting in October.

This forecast is a welcome development for Britons who have been dealing with increased expenses across various sectors, from food to utilities, amidst persistently high inflation rates, with energy-driven EU inflation hitting lower-income households hardest across member states.

Energy bills saw a steep rise in 2021, which escalated further due to the Ukraine conflict in 2022, driving up wholesale gas prices. This surge prompted government intervention to subsidize bills, with the UK price cap estimated to cost around £89bn to the public purse, capping costs to a typical household at £2,500.

Cornwall Insight noted that the supply of liquified natural gas to Europe had not been as adversely affected by the Red Sea disruptions as initially feared. Moreover, the UK has been well-supplied with gas from the US, which has become a more significant supplier since the Ukraine war, even as US electricity prices have risen to multi-decade highs. Contributing factors also include lower gas prices in Asia, mild weather, and robust gas availability.

Craig Lowrey, a principal consultant at Cornwall Insight, remarked that concerns about Red Sea events driving up energy prices have not materialized, allowing households to expect a reduction in prices.

On Monday, the next-month wholesale gas price dropped by 4% to 65p a therm.

However, Lowrey cautioned that a complete return to pre-crisis energy bill levels remains unlikely due to ongoing market impacts from shifting away from Russian energy sources and persistent geopolitical tensions, as well as policy changes such as Britain’s Energy Security Bill shaping market reforms.

Richard Neudegg, director of regulation at Uswitch, welcomed the potential further reduction of the price cap in April. However, he pointed out that this offers little solace to households currently struggling with high winter energy costs during the winter. Neudegg urged Ofgem, the energy regulator, to prompt suppliers to reintroduce more competitive and affordable fixed-price deals.


Related News

View more

California Public Utilities Commission sides with community energy program over SDG&E

CPUC Decision on San Diego Community Power directs SDG&E to use updated forecasts, stabilizing electricity rates for CCA customers and supporting clean energy in San Diego with accurate rate forecasting and reduced volatility.


Key Points

A CPUC ruling directing SDG&E to use updated forecasts to ensure accurate, stable CCA rates and limit volatility.

✅ Uses 2021 sales forecasts for rate setting

✅ Aims to prevent undercollection and bill spikes

✅ Levels changes across customer classes


The California Public Utilities Commission on Thursday sided with the soon-to-launch San Diego community energy program in a dispute it had with San Diego Gas & Electric.

San Diego Community Power — which will begin to purchase power for customers in San Diego, Chula Vista, La Mesa, Encinitas and Imperial Beach later this year — had complained to the commission that data SDG&E intended to use to calculate rates, including community choice exit fees that could make the new energy program less attractive to prospective customers.

SDG&E argued it was using numbers it was authorized to employ as part of a general rate case amid a potential rate structure revamp that is still being considered by the commission.

But in a 4-0 vote, the commission, or CPUC, sided with San Diego Community Power and directed SDG&E to use an updated forecast for energy sales.

"This was not an easy decision," said CPUC president Marybel Batjer at the meeting, held remotely due to COVID-19 restrictions. "In my mind, this outcome best accounts for the shifting realities ... in the San Diego area while minimizing the impact on ratepayers during these difficult financial times."

In filings to the commission, SDG&E predicted a rate decrease of 12.35 percent in the coming year. While that appears to be good news for customers, Californians still face soaring electricity prices statewide, Commissioner Martha Guzman Aceves said the data set SDG&E wanted to use would lead to an undercollection of $150 million to $260 million.

That would result in rates that would be "artificially low," Guzman Aceves said, and rates "would inevitably go up quite a bit after the undercollection was addressed."

San Diego Community Power, or SDCP, said the temporary reduction would make its rates less attractive than SDG&E's, especially amid SDG&E's minimum charge proposal affecting low-usage customers, just as it is about to begin serving customers. SDCP's board members wrote an open letter last month to the commission, accusing the utility of "willful manipulation of data."

Working with an administrative law judge at the CPUC, Guzman Aceves authored a proposal requiring SDG&E to use numbers based on 2021 forecasts, as regulators simultaneously weigh whether the state needs more power plants to ensure reliability. The utility argued that could result in an increase of "roughly 40 percent" for medium and large commercial and industrial customers this year.

To help reduce potential volatility, Guzman Aceves, SDCP and other community energy supporters called for using a formula that would average out changes in rates across customer classes amid debates over income-based utility charges statewide. That's what the commissioners OK'd Thursday.

"It is essential that customer commodity rates be as accurate as we can possibly get them to avoid undercollections," said Commissioner Genevieve Shiroma.

San Diego Community Power is one of 23 community choice aggregation, or CCA, energy programs that have launched in California in the past decade.

CCAs compete with traditional power companies amid California's evolving power competition landscape, in one important role — purchasing power for a given community. They were created to boost the use of cleaner energy sources, such as wind and solar, at rates equal to or lower than investor-owned utilities.

However, CCAs do not replace utilities because the incumbent power companies still perform all of the tasks outside of power purchasing, such as transmission and distribution of energy and customer billing.

When a CCA is formed, California rules stipulate the utility customers in that area are automatically enrolled in the CCA. If customers prefer to stay with their previous power company, they can opt out of joining the CCA.

The shift of customers from SDG&E to San Diego Community Power is expected to be large. The total number of accounts for SDCP is expected to be 770,000, which would make it the second-largest CCA in the state. That's why SDCP considered Thursday's CPUC decision to be so important.

"At a time when customers are choosing between sticking with San Diego Gas & Electric and migrating to a CCA, we want them to have accurate bill information," said Commissioner Clifford Rechtschaffen.

"SDCP is very happy with today's CPUC decision, and that the commissioners shared our goal of limiting rate volatility for businesses and families in the region," said SDCP interim CEO Bill Carnahan. "This is definitely a win for accurate rate forecasting, and our mutual customers, and we look forward to working with SDG&E on next steps."

In an email, SDG&E spokeswoman Helen Gao said, "We are committed to continuing to work collaboratively with local Community Choice Aggregation programs to support their successful launch in 2021 and ensure that our mutual customers receive excellent customer service."

San Diego Community Power's case before the CPUC was joined by the California Community Choice Association, a trade group advocating for CCAs, and the Clean Energy Alliance — the North County-based CCA representing Del Mar, Solana Beach and Carlsbad that is scheduled to launch this summer.

SDCP will begin its rollout this year, folding in about 71,000 municipal, commercial and industrial accounts. The bulk of its roughly 700,000 residential accounts is expected to come in January 2022.


Related News

View more

China to build 2,000-MW Lawa hydropower station on Jinsha River

Lawa Hydropower Station approved on the Jinsha River, a Yangtze tributary, delivers 2,000 MW via four units; 784 ft dam, 12 sq mi reservoir, Sichuan-Tibet site, US$4.59b investment, Huadian stake, renewable energy generation.


Key Points

A 2,000 MW dam project on the Jinsha River with four units, a 784 ft barrier, and 8.36 billion kWh annual output.

✅ Sichuan-Tibet junction on the Jinsha River

✅ 2,000 MW capacity; four turbine-generator units

✅ 8.36 bn kWh/yr; US$4.59b total; Huadian 48% stake


China has approved construction of the 2,000-MW Lawa hydropower station, a Yangtze tributary hydropower project on the Jinsha River, multiple news agencies are reporting.

Lawa, at the junction of Sichuan province and the Tibet autonomous region, will feature a 784-foot-high dam and the reservoir will submerge about 12 square miles of land. The Jinsha River is a tributary of the Yangtze River, and the project aligns with green hydrogen development in China.

The National Development and Reform Commission of the People’s Republic of China, which also guides China's nuclear energy development as part of national planning, is reported to have said that four turbine-generator units will be installed, and the project is expected to produce about 8.36 billion kWh of electricity annually.

Total investment in the project is to be US$4.59 billion, and Huadian Group Co. Ltd. will have a 48% stake in the project, reflecting overseas power infrastructure activity, with minority stakes held by provincial firms, according to China Daily.

In other recent news in China, Andritz received an order in December 2018 to supply four 350-MW reversible pump-turbines and motor-generators, alongside progress in compressed air generation technologies, for the 1,400-MW ZhenAn pumped storage plant in Shaanxi province.


Related News

View more

Top Senate Democrat calls for permanent renewable energy, storage, EV tax credits

Clean Energy Tax Incentives could expand under Democratic proposals, including ITC, PTC, and EV tax credits, boosting renewable energy, energy storage, and grid modernization within a broader infrastructure package influenced by Green New Deal goals.


Key Points

Federal incentives like ITC, PTC, and EV credits that cut costs and speed renewables, storage, and grid upgrades.

✅ Proposes permanence for ITC, PTC, and EV tax credits

✅ Could accelerate solar, wind, storage, and grid upgrades

✅ Passage depends on bipartisan infrastructure compromise


The 115th U.S. Congress has not even adjourned for the winter, and already a newly resurgent Democratic Party is making demands that reflect its majority status in the U.S. House come January.

Climate appears to be near the top of the list. Last Thursday, Senator Chuck Schumer (D-NY), the Democratic Leader in the Senate, sent a letter to President Trump demanding that any infrastructure package taken up in 2019 include “policies and funding to transition to a clean energy economy and mitigate the risks that the United States is already facing due to climate change.”

And in a list of policies that Schumer says should be included, the top item is “permanent tax incentives for domestic production of clean electricity and storage, energy efficient homes and commercial buildings, electric vehicles, and modernizing the electric grid.”

In concrete terms, this could mean an extension of the Investment Tax Credit (ITC) for solar and energy storage, the Production Tax Credit (PTC) for wind and the federal electric vehicle (EV) tax credit program as well.


Pressure from the Left

This strong statement on climate change, clean energy and infrastructure investment comes as at least 30 incoming members of the U.S. House of Representatives have signed onto a call for the creation of a committee to explore a “Green New Deal” and to move the nation to 100% renewable energy by 2030.*

It also comes as Schumer has come under fire by activists for rumors that he plans to replace Senator Maria Cantwell (D-Washington) with coal state Democrat Joe Manchin (D-West Virginia) as the top Democrat on the Senate Energy and Natural Resources Committee.

As such, one possible way to read these moves is that centrist leaders like Schumer are responding to pressure from an energized and newly elected Left wing of the Democratic Party. It is notable that Schumer’s program includes many of the aims of the Green New Deal, while avoiding any explicit use of that phrase.


Implications of a potential ITC extension

The details of levels and timelines are important here, particularly for the ITC.

The ITC was set to expire at the end of 2016, but was extended in legislative horse-trading at the end of 2015 to a schedule where it remains at 30% through the end of 2019 and then steps down for the next three years, and disappears entirely for residential projects. Since that extension the IRS has issued guidance around the use of co-located energy storage, as well as setting a standard under which PV projects can claim the ITC for the year that they begin construction.

This language around construction means that projects can start work in 2019, complete in 2023 and still claim the 30% ITC, and this may be why we at pv magazine USA are seeing an unprecedented boom in project pipelines across the United States.

Of course, if the ITC were to become permanent some of those projects would be pushed out to later years. But as we saw in 2016, despite an extension of the ITC many projects were still completed before the deadline, leading to the largest volume of PV installed in the United States in any one year to date.

This means that if the ITC were extended by the end of 2020, we could see the same thing all over again – a boom in projects created by the expected sunset, and then after a slight lull a continuation of growth.

Or it is possible that a combination of raw economics, increased investor and utility interest, and accelerating renewable energy mandates will cause solar growth rates to continue every year, and that any changes in the ITC will only be a bump against a larger trend.

While the basis for expiration of the EV tax credit is the number of vehicles sold, not any year, both the battery storage and EV industries, which many see at an inflection point, could see similar effects if the ITC and EV tax credits are made permanent.


Will consensus be reached?

It is also unclear that any such infrastructure package will be taken up by Republicans, or that both parties will be able to come to a compromise on this issue. While the U.S. Congress passed an infrastructure bill in 2017, given the sharp and growing differences between the two parties, and divergent trade approaches such as the 100% tariff on Chinese-made EVs, it is not clear that they will be able to come to a meaningful compromise during the next two years.


Related News

View more

UK must start construction of large-scale storage or fail to meet net zero targets.

UK Hydrogen Storage Caverns enable long-duration, low-carbon electricity balancing, storing surplus wind and solar power as green hydrogen in salt formations to enhance grid reliability, energy security, and net zero resilience by 2035 and 2050.


Key Points

They are salt caverns storing green hydrogen to balance wind and solar, stabilizing a low-carbon UK grid.

✅ Stores surplus wind and solar as green hydrogen in salt caverns

✅ Enables long-duration, low-carbon grid balancing and security

✅ Complements wind and solar; reduces dependence on flexible CCS


The U.K. government must kick-start the construction of large-scale hydrogen storage facilities if it is to meet its pledge that all electricity will come from low-carbon electricity sources by 2035 and reach legally binding net zero targets by 2050, according to a report by the Royal Society.

The report, "Large-scale electricity storage," published Sep. 8, examines a wide variety of ways to store surplus wind and solar generated electricity—including green hydrogen, advanced compressed air energy storage (ACAES), ammonia, and heat—which will be needed when Great Britain's electricity generation is dominated by volatile wind and solar power.

It concludes that large scale electricity storage is essential to mitigate variations in wind and sunshine, particularly long-term variations in the wind, and to keep the nation's lights on. Storing most of the surplus as hydrogen, in salt caverns, would be the cheapest way of doing this.

The report, based on 37 years of weather data, finds that in 2050 up to 100 Terawatt-hours (TWh) of storage will be needed, which would have to be capable of meeting around a quarter of the U.K.'s current annual electricity demand. This would be equivalent to more than 5,000 Dinorwig pumped hydroelectric dams. Storage on this scale, which would require up to 90 clusters of 10 caverns, is not possible with batteries or pumped hydro.

Storage requirements on this scale are not currently foreseen by the government, and the U.K.'s energy transition faces supply delays. Work on constructing these caverns should begin immediately if the government is to have any chance of meeting its net zero targets, the report states.

Sir Chris Llewellyn Smith FRS, lead author of the report, said, "The need for long-term storage has been seriously underestimated. Demand for electricity is expected to double by 2050 with the electrification of heat, transport, and industrial processing, as well as increases in the use of air conditioning, economic growth, and changes in population.

"It will mainly be met by wind and solar generation. They are the cheapest forms of low-carbon electricity generation, but are volatile—wind varies on a decadal timescale, so will have to be complemented by large scale supply from energy storage or other sources."

The only other large-scale low-carbon sources are nuclear power, gas with carbon capture and storage (CCS), and bioenergy without or with CCS (BECCS). While nuclear and gas with CCS are expected to play a role, they are expensive, especially if operated flexibly.

Sir Peter Bruce, vice president of the Royal Society, said, "Ensuring our future electricity supply remains reliable and resilient will be crucial for our future prosperity and well-being. An electricity system with significant wind and solar generation is likely to offer the lowest cost electricity but it is essential to have large-scale energy stores that can be accessed quickly to ensure Great Britain's energy security and sovereignty."

Combining hydrogen with ACAES, or other forms of storage that are more efficient than hydrogen, could lower the average cost of electricity overall, and would lower the required level of wind power and solar supply.

There are currently three hydrogen storage caverns in the U.K., which have been in use since 1972, and the British Geological Survey has identified the geology for ample storage capacity in Cheshire, Wessex and East Yorkshire. Appropriate, novel business models and market structures will be needed to encourage construction of the large number of additional caverns that will be needed, the report says.

Sir Chris observes that, although nuclear, hydro and other sources are likely to play a role, Britain could in principle be powered solely by wind power and solar, supported by hydrogen, and some small-scale storage provided, for example, by batteries, that can respond rapidly and to stabilize the grid. While the cost of electricity would be higher than in the last decade, we anticipate it would be much lower than in 2022, he adds.


Related News

View more

Which of the cleaner states imports dirty electricity?

Hourly Electricity Emissions Tracking maps grid balancing areas, embodied emissions, and imports/exports, revealing carbon intensity shifts across PJM, ERCOT, and California ISO, and clarifying renewable energy versus coal impacts on health and climate.


Key Points

An hourly method tracing generation, flows, and embodied emissions to quantify carbon intensity across US balancing areas.

✅ Hourly traces of imports/exports and generation mix

✅ Consumption-based carbon intensity by balancing area

✅ Policy insights for renewables, coal, health costs


In the United States, electricity generation accounts for nearly 30% of our carbon emissions. Some states have responded to that by setting aggressive renewable energy standards; others are hoping to see coal propped up even as its economics get worse. Complicating matters further is the fact that many regional grids are integrated, and as America goes electric the stakes grow, meaning power generated in one location may be exported and used in a different state entirely.

Tracking these electricity exports is critical for understanding how to lower our national carbon emissions. In addition, power from a dirty source like coal has health and environment impacts where it's produced, and the costs of these aren't always paid by the parties using the electricity. Unfortunately, getting reliable figures on how electricity is produced and where it's used is challenging, even for consumers trying to find where their electricity comes from in the first place, leaving some of the best estimates with a time resolution of only a month.

Now, three Stanford researchers—Jacques A. de Chalendar, John Taggart, and Sally M. Benson—have greatly improved on that standard, and they have managed to track power generation and use on an hourly basis. The researchers found that, of the 66 grid balancing areas within the United States, only three have carbon emissions equivalent to our national average, and they have found that imports and exports of electricity have both seasonal and daily changes. de Chalendar et al. discovered that the net results can be substantial, with imported electricity increasing California's emissions/power by 20%.

Hour by hour
To figure out the US energy trading landscape, the researchers obtained 2016 data for grid features called balancing areas. The continental US has 66 of these, providing much better spatial resolution on the data than the larger grid subdivisions. This doesn't cover everything—several balancing areas in Canada and Mexico are tied in to the US grid—and some of these balancing areas are much larger than others. The PJM grid, serving Pennsylvania, New Jersey, and Maryland, for example, is more than twice as large as Texas' ERCOT, in a state that produces and consumes the most electricity in the US.

Despite these limitations, it's possible to get hourly figures on how much electricity was generated, what was used to produce it, and whether it was used locally or exported to another balancing area. Information on the generating sources allowed the researchers to attach an emissions figure to each unit of electricity produced. Coal, for example, produces double the emissions of natural gas, which in turn produces more than an order of magnitude more carbon dioxide than the manufacturing of solar, wind, or hydro facilities. These figures were turned into what the authors call "embodied emissions" that can be traced to where they're eventually used.

Similar figures were also generated for sulfur dioxide and nitrogen oxides. Released by the burning of fossil fuels, these can both influence the global climate and produce local health problems.

Huge variation
The results were striking. "The consumption-based carbon intensity of electricity varies by almost an order of magnitude across the different regions in the US electricity system," the authors conclude. The low is the Bonneville Power grid region, which is largely supplied by hydropower; it has typical emissions below 100kg of carbon dioxide per megawatt-hour. The highest emissions come in the Ohio Valley Electric region, where emissions clear 900kg/MW-hr. Only three regional grids match the overall grid emissions intensity, although that includes the very large PJM (where capacity auction payouts recently fell), ERCOT, and Southern Co balancing areas.

Most of the low-emissions power that's exported comes from the Pacific Northwest's abundant hydropower, while the Rocky Mountains area exports electricity with the highest associated emissions. That leads to some striking asymmetries. Local generation in the hydro-rich Idaho Power Company has embodied emissions of only 71kg/MW-hr, while its imports, coming primarily from Rocky Mountain states, have a carbon content of 625kg/MW-hr.

The reliance on hydropower also makes the asymmetry seasonal. Local generation is highest in the spring as snow melts, but imports become a larger source outside this time of year. As solar and wind can also have pronounced seasonal shifts, similar changes will likely be seen as these become larger contributors to many of these regional grids. Similar things occur daily, as both demand and solar production (and, to a lesser extent, wind) have distinct daily profiles.

The Golden State
California's CISO provides another instructive case. Imports represent less than 30% of its total electric use in 2016, yet California electricity imports provided 40% of its embodied emissions. Some of these, however, come internally from California, provided by the Los Angeles Department of Water and Power. The state itself, however, has only had limited tracking of imported emissions, lumping many of its sources as "other," and has been exporting its energy policies to Western states in ways that shape regional markets.

Overall, the 2016 inventory provides a narrow picture of the US grid, as plenty of trends are rapidly changing our country's emissions profile, including the rise of renewables and the widespread adoption of efficiency measures and other utility trends in 2017 that continue to evolve. The method developed here can, however, allow for annual updates, providing us with a much better picture of trends. That could be quite valuable to track things like how the rapid rise in solar power is altering the daily production of clean power.

More significantly, it provides a basis for more informed policymaking. States that wish to promote low-emissions power can use the information here to either alter the source of their imports or to encourage the sites where they're produced to adopt more renewable power. And those states that are exporting electricity produced primarily through fossil fuels could ensure that the locations where the power is used pay a price that includes the health costs of its production.


Related News

View more

Sign Up for Electricity Forum’s Newsletter

Stay informed with our FREE Newsletter — get the latest news, breakthrough technologies, and expert insights, delivered straight to your inbox.

Electricity Today T&D Magazine Subscribe for FREE

Stay informed with the latest T&D policies and technologies.
  • Timely insights from industry experts
  • Practical solutions T&D engineers
  • Free access to every issue

Live Online & In-person Group Training

Advantages To Instructor-Led Training – Instructor-Led Course, Customized Training, Multiple Locations, Economical, CEU Credits, Course Discounts.

Request For Quotation

Whether you would prefer Live Online or In-Person instruction, our electrical training courses can be tailored to meet your company's specific requirements and delivered to your employees in one location or at various locations.