Power Producers Oppose Legislation Helping Millstone Nuclear Plant


Protective Relay Training - Basic

Our customized live online or in‑person group training can be delivered to your staff at your location.

  • Live Online
  • 12 hours Instructor-led
  • Group Training Available
Regular Price:
$699
Coupon Price:
$599
Reserve Your Seat Today

Millstone Nuclear Legislation faces opposition from Calpine, Dynegy, NRG, and EPSA, as Connecticut debates market access, ratepayer impacts, renewable and low-carbon procurement, and Dominion transparency amid low natural gas and power prices.


Key Points

A Connecticut plan to expand Millstone's market access while balancing ratepayer costs, competition and low carbon goals.

✅ Guarantees market access via low-carbon procurement process

✅ Raises concerns over rates, competition, and transparency

✅ Positions nuclear alongside renewables in Connecticut policy


Power producers are set to announce Tuesday their opposition to legislation that would guarantee markets for the Millstone nuclear plant, calling it special treatment for one energy source in Connecticut.

Legislation has yet to be drafted, but it could follow a measure that failed last year, proposing to boost Millstone's access to electricity markets amid a broader market overhaul in Connecticut that lawmakers are weighing.

Calpine Corp., Dynegy, NRG Energy and the Electric Power Supply Association say state assistance to Millstone could drive up energy costs for businesses and residents, echoing arguments that in deregulated electricity markets subsidies are unnecessary and distortive, the companies and trade association say the legislature should require Dominion Resources Inc., Millstone's parent company, to make public its financial records to prove it needs a change in state law.

"This legislation would carve out a significant part of the market in the region for one company under different terms than anything we could hope for," said John E. Shelk, president and chief executive officer of the Electric Power Supply Association.

Thomas F. Farrell II, chief executive officer of Dominion, told investor analysts on a conference call to discuss fourth-quarter earnings last week that power prices have been "under some pressure."

Referring to the possibility of favorable legislation, Dominion is "hopeful that things will improve there," he said.

Shelk said Farrell's comment is an admission that "this is all about the drag Millstone is having on the corporate parent."

"The Connecticut legislature has proposed a competitive process to reduce retail electric rates, and amid debates like ACORE's FERC filing on subsidy proposals state energy officials would determine whether it is in ratepayers' best interests," Dominion spokesman Kevin Hennessy said.

Several nuclear plants around the country, unable to compete with low natural gas prices, have shut, even as New England weighs transmission proposals like the Maine-Quebec transmission line to access lower-carbon power options.

"There was a trend and a very distressing trend," Reed, D-Branford, said at a public hearing last month.

The plan that failed last year would have allowed nuclear energy to participate in a competitive purchase of renewable or low-carbon electric power, including contentious imports such as the Northern Pass hydropower project that has stirred debate, in a process administered by the state. If Millstone were to be selected, it would be guaranteed a market as natural gas prices decline.

Dan Weekley, vice president of corporate affairs at Dominion, rejected a proposal that the company's financial records be opened for public inspection, saying any information would be irrelevant.

"What is in the customers' and the ultimate ratepayers' best interests?" he asked at the public hearing. "What is the best price for consumers?"

AARP Connecticut said it also will oppose Millstone legislation. A legislative proposal could reclassify power generated by the plant as renewable fuel, allowing Dominion to undercut the cost of other renewable fuels and receive a higher price for its power, AARP said.

Related News

Several Milestones Reached at Nuclear Power Projects Around the World

Nuclear Power Construction Milestones spotlight EPR builds, Hualong One steam generators, APR-1400 grid integration, and VVER startups, with hot functional testing, hydrostatic checks, and commissioning advancing toward fuel loading and commercial operation.


Key Points

Key reactor project steps, from testing and grid readiness to startup, marking progress toward safe commercial operation.

✅ EPR units advance through cold and hot functional testing

✅ Hualong One installs 365-ton steam generators at Fuqing 5

✅ APR-1400 and VVER projects progress toward grid connection


The world’s nuclear power industry has been busy in the new year, with several construction projects, including U.S. reactor builds, reaching key milestones as 2018 began.


EPR Units Making Progress

Four EPR nuclear units are under construction in three countries: Olkiluoto 3 in Finland began construction in August 2005, Flamanville 3 in France began construction in December 2007, and Taishan 1 and 2 in China began construction in November 2009. Each of the new units is behind schedule and over budget, but recent progress may signal an end to some of the construction difficulties.

EDF reported that cold functional tests were completed at Flamanville 3 on January 6. The main purpose of the testing was to confirm the integrity of primary systems, and verify that components important to reactor safety were properly installed and ready to operate. More than 500 welds were inspected while pressure was held greater than 240 bar (3,480 psi) during the hydrostatic testing, which was conducted under the supervision of the French Nuclear Safety Authority.

With cold testing successfully completed, EDF can now begin preparing for hot functional tests, which verify equipment performance under normal operating temperatures and pressures. Hot testing is expected to begin in July, with fuel loading and reactor startup possible by year end. The company also reported that the total cost for the unit is projected to be €10.5 billion (in 2015 Euros, excluding interim interest).

Olkiluoto 3 began hot functional testing in December. Teollisuuden Voima Oyj—owner and operator of the site—expects the unit to produce its first power by the end of this year, with commercial operation now slated to begin in May 2019.

Although work on Taishan 1 began years after Olkiluoto 3 and Flamanville 3, it is the furthest along of the EPR units. Reports surfaced on January 2 that China General Nuclear (CGN) had completed hot functional testing on Taishan 1, and that the company expects the unit to be the first EPR to startup. CGN said Taishan 1 would begin commercial operation later this year, with Taishan 2 following in 2019.


Hualong One Steam Generators Installed

Another Chinese project reached a notable milestone on January 8. China National Nuclear Corp. announced the third of three steam generators had been installed at the Hualong One demonstration project, which is being constructed as Unit 5 at the Fuqing nuclear power plant.

The Hualong One pressurized water reactor unit, also known as the HPR 1000, is a domestically developed design, part of China’s nuclear program, based on a French predecessor. It has a 1,090 MW capacity. The steam generators reportedly weigh 365 metric tons and stand more than 21 meters tall. The first steam generator was installed at Fuqing 5 on November 10, with the second placed on Christmas Eve.


Barakah Switchyard Energized

In the United Arab Emirates, more progress has been made on the four South Korean–designed APR-1400 units under construction at the Barakah nuclear power plant. On January 4, Emirates Nuclear Energy Corp. (ENEC) announced that the switchyard for Units 3 and 4 had been energized and connected to the power grid, a crucial step in Abu Dhabi toward completion. Unit 2’s main power transformer, excitation transformer, and auxiliary power transformer were also energized in preparation for hot functional testing on that unit.

“These milestones are a result of our extensive collaboration with our Prime Contractor and Joint Venture partner, the Korea Electric Power Corporation (KEPCO),” ENEC CEO Mohamed Al Hammadi said in a press release. “Working together and benefitting from the experience gained when conducting the same work on Unit 1, the teams continue to make significant progress while continuing to implement the highest international standards of safety, security and quality.”

In 2017, ENEC and KEPCO achieved several construction milestones including installation and concrete pouring for the reactor containment building liner dome section on Unit 3, and installation of the reactor containment liner plate rings, reactor vessel, steam generators, and condenser on Unit 4.

Construction began on the four units (Figure 1) in July 2012, May 2013, September 2014, and September 2015, respectively. Unit 1 is currently undergoing commissioning and testing activities while awaiting regulatory review and receipt of the unit’s operating license from the Federal Authority for Nuclear Regulation, before achieving 100% power in a later phase. According to ENEC, Unit 2 is 90% complete, Unit 3 is 79% complete, and Unit 4 is 60% complete.


VVER Units Power Up

On December 29, Russia’s latest reactor to commence operation—Rostov 4 near the city of Volgodonsk—reached criticality, as other projects like Leningrad II-1 advance across the fleet, and was operated at its minimum controlled reactor power (MCRP). Criticality is a term used in the nuclear industry to indicate that each fission event in the reactor is releasing a sufficient number of neutrons to sustain an ongoing series of reactions, which means the neutron population is constant and the chain reaction is stable.

“The transfer to the MCRP allows [specialists] to carry out all necessary physical experiments in the critical condition of [the] reactor unit (RU) to prove its design criteria,” Aleksey Deriy, vice president of Russian projects for ASE Engineering Co., said in a press release. “Upon the results of the experiments the specialists will decide on the RU powerup.”

Rostov 4 is a VVER-1000 reactor with a capacity of 1,000 MW. The site is home to three other VVER units: Unit 1 began commercial operation in 2001, Unit 2 in 2010, and Unit 3 in 2015.


Related News

View more

Electricity sales in the U.S. actually dropped over the past 7 years

US Electricity Sales Decline amid population growth and GDP gains, as DOE links reduced per capita consumption to energy efficiency, warmer winters, appliances, and bulbs, while hotter summers and rising AC demand may offset savings.


Key Points

US electricity sales fell 3% since 2010 despite population and GDP growth, driven by efficiency gains and warmer winters.

✅ DOE links drops to efficiency and warmer winters

✅ Per capita residential use fell about 7% since 2010

✅ Rising AC demand may offset winter heating savings


Since 2010, the United States has grown by 17 million people, and the gross domestic product (GDP) has increased by $3.6 trillion. Yet in that same time span, electricity sales in the United States actually declined by 3%, according to data released by the U.S. Department of Energy (DOE), even as electricity prices rose at a 41-year pace nationwide.

The U.S. decline in electricity sales is remarkable given that the U.S. population increased by 5.8% in that same time span. This means that per capita electricity use fell even more than that; indeed, the Department of Energy pegs residential electricity sales per capita as having declined by 7%, even as inflation-adjusted residential bills rose 5% in 2022 nationwide.

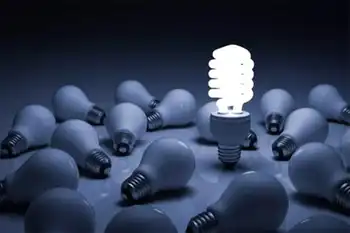
There are likely multiple reasons for this decline in electricity sales. Department of Energy analysts suggest that, at least in part, it is due to increased adoption of energy-efficient appliances and bulbs, like compact fluorescents. Indeed, the DOE notes that there is a correlation between consumer spending on “energy efficiency” and a reduction in per capita electricity sales, while utilities invest more in delivery infrastructure to modernize the grid.

Yet the DOE also notes that states with a greater increase in warm weather days had a corresponding decrease in electricity sales, as milder weather can reduce power demand across years. In southern states, the effect was most dramatic: for instance, from 2010 to 2016, Florida had a 56% decrease in cold weather days that would require heating and as a result, saw a 9% decrease in per capita electricity sales.

The moral is that warm winters save on electricity. But if global temperatures continue to rise, and summers become hotter, too, this decrease in winter heating spending may be offset by the increased need to run air conditioning in the summer, and given how electricity and natural gas prices interact, overall energy costs could shift. Indeed, it takes far more energy to cool a room than it does to heat it, for reasons related to the basic laws of thermodynamics. 


Related News

View more

How Synchrophasors are Bringing the Grid into the 21st Century

Synchrophasors deliver PMU-based, real-time monitoring for the smart grid, helping NYISO prevent blackouts, cut costs, and integrate renewables, with DOE-backed deployments boosting reliability, situational awareness, and data sharing across regional partners.


Key Points

Synchrophasors, or PMUs, are grid sensors that measure synced voltage, current, and frequency to enhance reliability.

✅ Real-time grid visibility and situational awareness

✅ Early fault detection to prevent cascading outages

✅ Supports renewable integration and lowers operating costs


Have you ever heard of a synchrophasor? It may sound like a word out of science fiction, but these mailbox-sized devices are already changing the electrical grid as we know it.

The grid was born over a century ago, at a time when our needs were simpler and our demand much lower. More complex needs are putting a heavy strain on the aging infrastructure, which is why we need to innovate and update our grid with investments in a smarter electricity infrastructure so it’s ready for the demands of today.

That’s where synchrophasors come in.

A synchrophasor is a sophisticated monitoring device that can measure the instantaneous voltage, current and frequency at specific locations on the grid. This gives operators a near-real-time picture of what is happening on the system, including insights into power grid vulnerabilities that allow them to make decisions to prevent power outages.

Just yesterday I attended the dedication of the New York Independent System Operator's smart grid control center, a $75 million project that will use these devices to locate grid problems at an early stage and share these data with their regional partners. This should mean fewer blackouts for the State of New York. I would like to congratulate NYISO for being a technology leader.

And not only will these synchrophasors help prevent outages, but they also save money. By providing more accurate and timely data on system limits, synchrophasors make the grid more reliable and efficient, thereby reducing planning and operations costs and addressing grid modernization affordability concerns for utilities.

The Department has worked with utilities across the country to increase the number of synchrophasors five-fold -- from less than 200 in 2009 to over 1,700 today. And this is just a part of our commitment to making a smarter, more resilient grid a reality, reinforced by grid improvement funding from DOE.

In September 2013, the US Department of Energy announced up to $9 million in funding to facilitate rapid response to unusual grid conditions. As a result, utilities will be able to better detect and head off potential blackouts, while improving day-to-day grid reliability and helping with the integration of solar into the grid and other clean renewable sources.

If you’d like to learn more about our investments in the smart grid and how they are improving our electrical infrastructure, please visit the Office of Electricity Delivery and Energy Reliability’s www.smartgrid.gov.

Patricia Hoffman is Assistant Secretary, Office of Electricity Delivery & Energy Reliability


Related News

View more

UK Energy Industry Divided Over Free Electricity Debate

UK Free Electricity Debate weighs soaring energy prices against market regulation, renewables, and social equity, examining price caps, funding via windfall taxes, grid investment, and consumer protection in the UK's evolving energy policy landscape.


Key Points

A policy dispute over free power, balancing consumer relief with market stability, renewables, and investment.

✅ Pros: relief for households; boosts efficiency and green adoption.

✅ Cons: risks to market signals, quality, and grid investment.

✅ Policy options: price caps, windfall taxes, targeted subsidies.


In recent months, the debate over free electricity in the UK has intensified, revealing a divide within the energy sector. With soaring energy prices and economic pressures impacting consumers, the discussion around providing free electricity has gained traction. However, the idea has sparked significant controversy among industry stakeholders, each with their own perspectives on the feasibility and implications of such a move.

The Context of Rising Energy Costs

The push for free electricity is rooted in the UK’s ongoing energy crisis, exacerbated by geopolitical tensions, supply chain disruptions, and the lingering effects of the COVID-19 pandemic. As energy prices reached unprecedented levels, households faced the harsh reality of skyrocketing bills, prompting calls for government intervention to alleviate financial burdens.

Supporters of free electricity argue that it could serve as a vital lifeline for struggling families and businesses. The proposal suggests that by providing a certain amount of electricity for free, the government could help mitigate the effects of rising costs while encouraging energy conservation and efficiency.

Industry Perspectives

However, the notion of free electricity has not been universally embraced within the energy sector. Some industry leaders express concerns about the financial viability of such a scheme. They argue that providing free electricity could undermine the market dynamics that incentivize investment in infrastructure and renewable energy, in a market already exposed to natural gas price volatility today. Critics warn that if energy companies are forced to absorb costs, it could lead to diminished service quality and investment in necessary advancements.

Additionally, there are worries about how free electricity could be funded. Proponents suggest that a tax on energy companies could generate the necessary revenue, but opponents question whether this would stifle innovation and competition. The fear is that placing additional financial burdens on energy providers could ultimately lead to higher prices in the long run.

Renewable Energy and Sustainability

Another aspect of the debate centers around the UK’s commitment to transitioning to renewable energy sources. Supporters of free electricity emphasize that such a policy could encourage more widespread adoption of green technologies by making energy more accessible. They argue that by removing the financial barriers associated with energy costs, households would be more inclined to invest in solar panels, heat pumps, and other sustainable solutions.

On the other hand, skeptics contend that the focus should remain on ensuring a stable and reliable energy supply as the UK moves toward its climate goals. They caution against implementing policies that might disrupt the balance of the energy market, potentially hindering the necessary investments in renewable infrastructure.

Government's Role

As discussions unfold, the government’s role in this debate is crucial. Policymakers must navigate the complex landscape of energy regulation, market dynamics, and consumer needs. The government has already introduced measures aimed at assisting vulnerable households, such as energy price caps and direct financial support. However, the question remains whether these initiatives go far enough in addressing the root causes of the energy crisis.

In this context, the government faces pressure from both consumers demanding relief and industry leaders advocating for market stability, including proposals to end the link between gas and electricity prices to curb price volatility. The challenge lies in finding a middle ground that balances immediate support for households with long-term sustainability and investment in the energy sector.

Future Implications

The ongoing debate about free electricity in the UK underscores broader themes related to energy policy, market regulation, and social equity, with rising electricity prices abroad offering context for comparison. As the country navigates its energy transition, the decisions made today will have far-reaching implications for both consumers and the industry.

If the government chooses to pursue a model that includes free electricity, it will need to carefully consider how to implement such a system without jeopardizing the market. Transparency, stakeholder engagement, and thorough impact assessments will be essential to ensure that any new policies are sustainable and equitable.

Conversely, if the concept of free electricity is ultimately rejected, the focus will likely shift back to addressing energy costs through other means, such as enhancing energy efficiency programs or increasing support for vulnerable populations.

The divide within the UK’s energy industry regarding free electricity highlights the complexities of balancing consumer needs with market stability. As the energy crisis continues to unfold, the conversations surrounding this issue will remain at the forefront of public discourse. Ultimately, finding a solution that addresses the immediate challenges while promoting a sustainable energy future will be key to navigating this critical juncture in the UK’s energy landscape.


Related News

View more

California just made more clean energy than it needed

CAISO Net Negative Emissions signal moments when greenhouse gas intensity of serving ISO demand drops below zero, driven by high renewable generation, low load, strong solar exports, and imports accounting in the California grid.


Key Points

Moments when CAISO's CO2 to serve demand is below zero, driven by renewables, exports, and import accounting.

✅ Calculated using imports and exports to serve ISO demand

✅ Occur during high solar output, low weekend load

✅ Coincide with curtailment and record renewable penetration


We’re a long way from the land of milk and honey, but on Easter Sunday – for about an hour – we got a taste.

On Sunday, at 1:55 PM Pacific Time the California Independent Systems Operator (CAISO) reported that greenhouse gas emissions necessary to serve its demand (~80% of California’s electricity demand on an annual basis), was measured at a rate -16 metric tons of CO2 per hour. Five minutes later, the value was -2 mTCO2/h, before it crept back up to 40 mTCO2/h at 2:05 PM PST. At 2:10 PST though it fell back to -86 mTCO2/h and stayed negative until 3:05 PM PST, even as global CO2 emissions flatlined in 2019 according to the IEA.

This information was brought to the attention of pv magazine via tweet from eagle eye Jon Pa after CAISO’s site first noted the negative values:

The region was still generating CO2 though, as natural gas, biogas, biomass, geothermal and even coal plants were running and pumping out emissions, even as potent greenhouse gases declined in the US under control efforts. CAISO’s Greenhouse Gas Emission Tracking Methodology, December 28, 2016 (pdf) notes the below calculations to create the value what it terms, “Total GHG emissions to serve ISO demand”:

Of importance to note is that to get to the net negative value, CAISO considered all electricity imports and exports, a reminder that climate policy shapes grid operations across North America. And as can be noted in the image below the CO2 intensity of imports during the day rapidly declined as the sun came up, first going negative around 9:05 AM PST, and mostly staying so until just before 6 PM PST.

During this same weekend, other records were noted (reiterating that we’re in record setting season and as the state pursues its 100% carbon-free mandate now in law) such as a new electricity export record of greater than 2 GW and total renewable electricity as part of total demand at greater than 70%.

At the peak negative moment of 2:15 PM PST, -112 mTCO2/h seen below, the total amount of clean instantaneous generation being used in the power grid region was 17 GW, a far cry from heat-driven reliability strains like rolling blackout warnings that arise during extreme demand, with renewables giving 76% of the total, hydro 14%, nuclear 13% and imports of -12% countering the CO2 coming from just over 1.4 GW of gas generation.

Also of importance are a few layers of nuance in the electricity demand charts. First off we’re in the shoulder seasons  of California – nice cool weather before the warmth of summer drives air conditioning demand. Additional the weekend electricity demand is always lower, as well, Easter Sunday might have had an affect, whereas in colder regions Calgary’s electricity use can soar during frigid snaps.

Lastly to note was the amount of electricity from solar and wind generation being curtailed. And while the Sunday numbers weren’t available yet, the below image noted Saturday with 10 GWh in total being curtailed (pdf) – peaking at over 3.2 GW of instantaneous mostly solar power even as solar is now the cheapest electricity according to the IEA, in the hours of 2 and 3 PM PST. On an annualized basis, less than 2% of total potential solar electricity was curtailed in 2018.


Related News

View more

Why Is Georgia Importing So Much Electricity?

Georgia Electricity Imports October 2017 surged as hydropower output fell and thermal power plants underperformed; ESCO balanced demand via low-cost imports, mainly from Azerbaijan, amid rising tariffs, kWh consumption growth, and a widening generation-consumption gap.


Key Points

They mark a record import surge due to costly local generation, lower hydropower, ESCO balancing costs, and rising demand.

✅ Imports rose 832% YoY to 157 mln kWh, mainly from Azerbaijan

✅ TPP output fell despite capacity; only low-tariff plants ran

✅ Balancing price 13.8 tetri/kWh signaled costly domestic PPAs


In October 2017, Georgian power plants generated 828 mln. KWh of electricity, marginally up (+0.79%) compared to September. Following the traditional seasonal pattern and amid European concerns over dispatchable power shortages affecting markets, the share of electricity produced by renewable sources declined to 71% of total generation (87% in September), while thermal power generation’s share increased, accounting for 29% of total generation (compared to 13% in September). When we compare last October’s total generation with the total generation of October 2016, however, we observe an 8.7% decrease in total generation (in October 2016, total generation was 907 mln. kWh). The overall decline in generation with respect to the previous year is due to a simultaneous decline in both thermal power and hydro power generation. 

Consumption of electricity on the local market in the same period was 949 mln. kWh (+7% compared to October 2016, and +3% with respect to September 2017), and reflected global trends such as India's electricity growth in recent years. The gap between consumption and generation increased to 121 mln. kWh (15% of the amount generated in October), up from 100 mln. kWh in September. Even more importantly, the situation was radically different with respect to the prior year, when generation exceeded consumption.

The import figure for October was by far the highest from the last 12 years (since ESCO was established), occurring as Ukraine electricity exports resumed regionally, highlighting wider cross-border dynamics. In October 2017, Georgia imported 157 mln. kWh of electricity (for 5.2 ¢/kWh – 13 tetri/kWh). This constituted an 832% increase compared to October 2016, and is about 50% larger than the second largest import figure (104.2 mln. kWh in October 2014). Most of the October 2017 imports (99.6%) came from Azerbaijan, with the remaining 0.04% coming from Russia.

The main question that comes to mind when observing these statistics is: why did Georgia import so much? One might argue that this is just the result of a bad year for hydropower generation and increased demand. This argument, however, is not fully convincing. While it is true that hydropower generation declined and demand increased, the country’s excess demand could have been easily satisfied by its existing thermal power plants, even as imported coal volumes rose in regional markets. Instead of increasing, however, the electricity coming from thermal power plants declined as well. Therefore, that cannot be the reason, and another must be found. The first that comes to mind is that importing electricity may have been cheaper than buying it from local TPPs, or from other generators selling electricity to ESCO under power purchase agreements (PPAs). We can test the first part of this hypothesis by comparing the average price of imported electricity to the price ceiling on the tariff that TPPs can charge for the electricity they sell. Looking at the trade statistics from Geostat, the average price for imported electricity in October 2017 remained stable with respect to the same month of the previous year, at 5.2 ¢ (13 tetri) per kWh. Only two thermal power plants (Gardabani and Mtkvari) had a price ceiling below 13 tetri per kWh. Observing the electricity balance of Georgia, we see that indeed more than 98% of the electricity generated by TPPs in October 2017 was generated by those two power plants.

What about other potential sources of electricity amid Central Asia's power shortages at the time? To answer this question, we can use the information derived from the weighted average price of balancing electricity. Why balancing electricity? Because it allows us to reconstruct the costs the market operator (ESCO) faced during the month of October to make sure demand and supply were balanced, and it allows us to gain an insight about the price of electricity sold through PPAs.

ESCO reports that the weighted average price of balancing electricity in October 2017 was 13.8 tetri/kWh, (25% higher than in October 2016, when it was below the average weighted cost of imports – 11 vs. 13 – and when the quantity of imported electricity was substantially smaller). Knowing that in October 2017, 61% of balancing electricity came from imports, while 39% came from hydropower and wind power plants selling electricity to ESCO under their PPAs, we can deduce that in this case, internal generation was (on average) also substantially more expensive than imports. Therefore, the high cost of internally generated electricity, rather than the technical impossibility of generating enough electricity to satisfy electricity demand, indeed appears to be one the main reasons why electricity imports spiked in October 2017.


Related News

View more

Sign Up for Electricity Forum’s Newsletter

Stay informed with our FREE Newsletter — get the latest news, breakthrough technologies, and expert insights, delivered straight to your inbox.

Electricity Today T&D Magazine Subscribe for FREE

Stay informed with the latest T&D policies and technologies.
  • Timely insights from industry experts
  • Practical solutions T&D engineers
  • Free access to every issue

Live Online & In-person Group Training

Advantages To Instructor-Led Training – Instructor-Led Course, Customized Training, Multiple Locations, Economical, CEU Credits, Course Discounts.

Request For Quotation

Whether you would prefer Live Online or In-Person instruction, our electrical training courses can be tailored to meet your company's specific requirements and delivered to your employees in one location or at various locations.