NFPA 70E Training
Our customized live online or in‑person group training can be delivered to your staff at your location.

- Live Online
- 6 hours Instructor-led
- Group Training Available
Regular Price:
$199
Coupon Price:
$149
Developing countries are intensifying the pressure on Australia and other wealthy nations to promise to cut greenhouse emissions by at least 25 per cent by 2020 at talks in Poland this month.
They say that unless rich countries make this commitment, developing countries will not be able to make the cuts needed to clinch an international climate change deal.
The international push for a tough Australian regime comes as cabinet's climate change subcommittee met for the second time, with the Rudd Government struggling to finalize its emissions trading scheme and hose down domestic business concerns about its impact on top of the deepening global economic crisis.
South African Environment Minister Marthinus van Schalkwyk said that "Japan, Russia, Australia and Canada have avoided putting their numbers on the table for too long. They now need to come forward with credible and ambitious mid-term targets within the 25 per cent to 40per cent range for 2020.... Without such an unambiguous commitment, it will be very difficult to engage developing countries in a credible way to make their deviation below baseline substantial."
In its submission to the negotiations in Poznan, China called on developed countries to make cuts of at least 25 per cent.
Climate Institute chief executive John Connor seized on the comments as proof that "there is no point in Australia turning up in Poznan without a commitment to cut domestic emissions by at least 25 per cent".
But Australian electricity suppliers and business groups say that 25 per cent is not achievable, insisting the Government should announce cuts of between 5 and 15per cent of 2000 levels by 2020 when it unveils the final scheme on December 15.
"When we modelled a 20 per cent cut, it resulted in the closure of about 25 per cent of Australia's coal-fired power stations in the next decade; we think a 25per cent cut would be almost impossible to achieve," said Electricity Supply Association of Australia chief executive Brad Page.
The Department of Climate Change has spent the past weeks negotiating with individual businesses and companies about what compensation they could be offered, either in the form of getting emission permits for free, or of direct grants from the Government's proposed Climate Change Adjustment Fund.
The Government has already indicated it favours a "soft start" to its scheme, modelling cuts of between 5 and 15 per cent, but its adviser Ross Garnaut said a 25per cent cut could be possible in the "unlikely" event of a quick and ambitious global deal.
Related News
Macron: France, Germany to provide each other with gas, electricity, to weather crisis
France-Germany Energy Solidarity underscores EU energy crisis cooperation: gas supply swaps, electricity imports, price cap…
View more
Electric shock: China power demand drops as coronavirus shutters plants
China Industrial Power Demand 2020 highlights COVID-19 disruption to electricity consumption as factory output stalls;…
View more

By Land and Sea, Clean Electricity Needs to Lead the Way
Martha's Vineyard 100% Renewable Energy advances electrification across EVs, heat pumps, distributed solar, offshore wind,…
View more

Growing pot sucks up electricity and pumps out an astounding amount of carbon dioxide — it doesn't have to
Sustainable Cannabis Cultivation leverages greenhouse design, renewable energy, automation, and water recapture to cut electricity…
View more

New Hampshire rejects Quebec-Massachusetts transmission proposal
Northern Pass Project faces rejection by New Hampshire regulators, halting Hydro-Quebec clean energy transmission lines…
View more
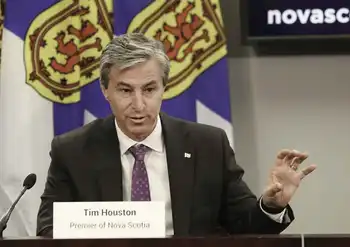
Nova Scotia Premier calls on regulators to reject 14% electricity rate hike agreement
Nova Scotia Power Rate Increase Settlement faces UARB scrutiny as regulators weigh electricity rates, fuel…
View more
Sign Up for Electricity Forum’s Newsletter
Stay informed with our FREE Newsletter — get the latest news, breakthrough technologies, and expert insights, delivered straight to your inbox.
Electricity Today T&D Magazine Subscribe for FREE

Stay informed with the latest T&D policies and technologies.
- Timely insights from industry experts
- Practical solutions T&D engineers
- Free access to every issue

