CSA Z462 Arc Flash Training – Electrical Safety Compliance Course
Our customized live online or in‑person group training can be delivered to your staff at your location.

- Live Online
- 6 hours Instructor-led
- Group Training Available
Regular Price:
$249
Coupon Price:
$199
Saudi Arabia's oil minister slammed biofuels, saying they did not protect the environment or help supply security, but added solar power had to be considered one of the best clean energy sources.
"Let's be realistic, ethanol and biofuels will not contribute to the protection of the global environment by reducing (carbon dioxide) emissions, they will not increase energy security, nor will they reduce dependency on fossil fuels to any appreciable degree," Ali al-Naimi told an oil conference.
"Biofuels are not the solution," he added.
The rise in biofuel use was largely due to government subsidies, high import taxes and financial favoritism vis-a-vis others, he added.
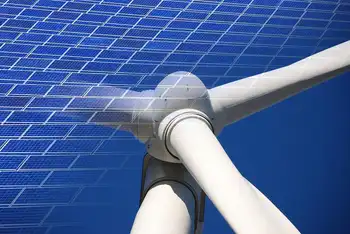
"That's why we have to look beyond biofuels... and concentrate instead on truly renewable sources of energy," he said, adding that solar power was perhaps the best clean energy source available in all parts of the world.
"It is abundant, clean and available to all," he said.
"There is a great chance to expand its usage to all parts of the world especially in developing countries and to all economic sectors and activities including power generation, manufacturing and so on," Naimi said.
What was needed, he said, was to expand the use of solar energy and to make solar cells more effective to make the transmission of solar power more cost effective.
"For our part we are giving that sort of energy special attention," he added.
Related News
Energy authority clears TEPCO to restart Niigata nuclear plant
TEPCO Kashiwazaki-Kariwa restart plan clears NRA fitness review, anchored by a seven-point safety code, Niigata…
View more
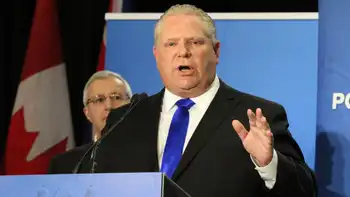
PC Leader Doug Ford vows to fire Hydro One CEO, board if elected
Doug Ford's Hydro One firing vow targets CEO pay, the utility's board, and privatization, amid…
View more

Washington State Ferries' Hybrid-Electric Upgrade
Washington State Hybrid-Electric Ferries advance green maritime transit with battery-diesel propulsion, lower emissions, and fleet…
View more
Trump's Proposal to Control Ukraine's Nuclear Plants Sparks Controversy
US Control of Ukraine Nuclear Plants sparks debate over ZNPP, Zaporizhzhia, sovereignty, safety, ownership, and…
View more
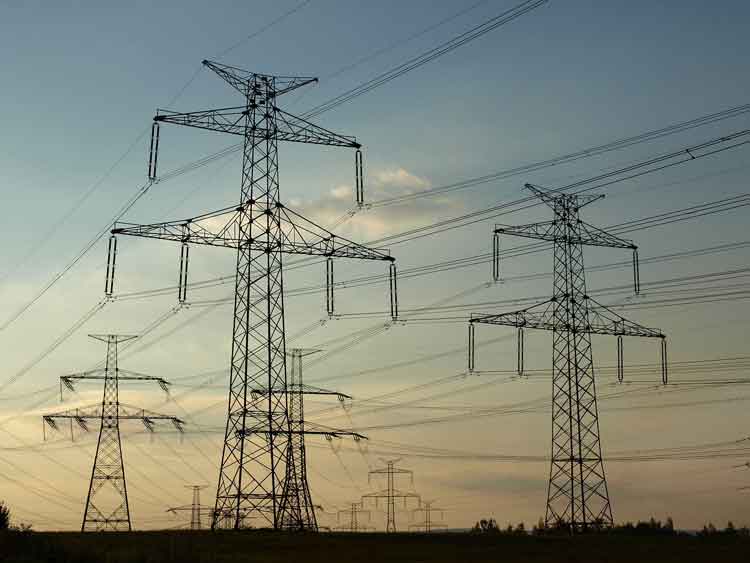
Europe's Renewables Are Crowding Out Gas as Coal Phase-Out Slows
EU Renewable Energy Shift is cutting gas dependence as wind and solar expand, reshaping Europe's…
View more
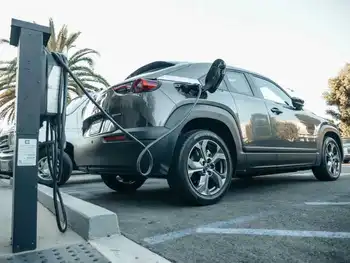
New Texas will bill electric vehicle drivers an extra $200 a year
Texas EV Registration Fee adds a $200 annual charge under Senate Bill 505, offsetting lost…
View more
Sign Up for Electricity Forum’s Newsletter
Stay informed with our FREE Newsletter — get the latest news, breakthrough technologies, and expert insights, delivered straight to your inbox.
Electricity Today T&D Magazine Subscribe for FREE

Stay informed with the latest T&D policies and technologies.
- Timely insights from industry experts
- Practical solutions T&D engineers
- Free access to every issue

