NFPA 70E Training
Our customized live online or in‑person group training can be delivered to your staff at your location.

- Live Online
- 6 hours Instructor-led
- Group Training Available
Regular Price:
$199
Coupon Price:
$149
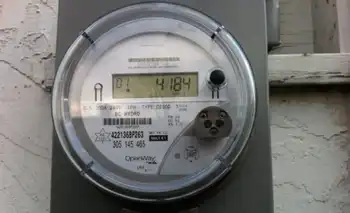
Skyworks Smart Grid Solutions power remote meter reading, AMI, and smart meters with high-performance RF front-end and analog modules, enabling utilities and energy management providers to boost reliability, demand response, and cost efficiency.
Main Details
Skyworks Smart Grid Solutions enable AMI and smart meters with RF and analog modules for reliable wireless operation.
- Partnerships with Itron, Landis+Gyr, Sensus, Badger Meter, ESCO
- RF front-end and linear products for AMI and smart meters
- Enables remote meter reading and grid reliability improvements
- Gartner: 150M smart meters in five years; $2B semis by 2012
- Early global upgrade to wireless energy management tech
Skyworks Solutions, Inc., an innovator of high reliability analog and mixed signal semiconductors enabling a broad range of end markets, announced that it is partnering with several of the energy industry's top solution providers to meet the growing worldwide demand for smart water, gas and electric meter readers.
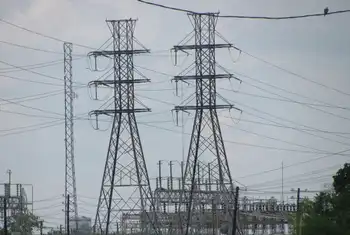
These strategic partnerships are enabling Skyworks to develop and ramp low-cost solutions for remote meter reading applications and smart grid technologies. Smart grids deliver power and energy from suppliers to consumers using smart grid technology across utilities, reducing utility and consumer costs while increasing system reliability. Governments and utilities are actively promoting smart grids to address energy independence, global warming and emergency resilience issues.
Skyworks' customers include Badger Meter, ESCO Technologies, Itron, Landis + Gyr Group, and Sensus. Each of these key energy management providers leverage Skyworks' front-end modules and linear products for their next-generation meters and advanced metering infrastructure (AMI) solutions, as meter deals continue to energize utilities across the sector.
"Skyworks is pleased to be collaborating with the principal players in the advanced metering market," said Liam K. Griffin, senior vice president, sales and marketing for Skyworks. "The energy management space has tremendous potential with several catalysts driving demand for smart meters and grid modernization initiatives. The adoption of wireless technology provides a compelling benefit to metering suppliers and utilities, and we are in the early stages of this global upgrade cycle. We are excited to deliver a suite of customized solutions in support of this rapidly growing market and look forward to enabling our customers' continued success with Skyworks' high performance analog technology."
Gartner expects more than 150 million smart meters to be installed worldwide in the next five years, with approximately 50 percent in North America - creating a cumulative semiconductor business of $2 billion by 2012. In the same December 2008 report, Gartner added that by 2012, consumers will be able to use personal communication devices, such as cellular phones, remotely to control the power consumption of electronics in their homes.
Related News
Related News

Seven small UK energy suppliers must pay renewables fees or risk losing licence
Ofgem Renewables Obligations drive supplier payments for renewables fees, feed-in tariffs, and renewable generation, with…
View more

TVA faces federal scrutiny over climate goals, electricity rates
TVA Rates and Renewable Energy Scrutiny spotlights electricity rates, distributed energy resources, solar and wind…
View more

Almost 500-mile-long lightning bolt crossed three US states
Longest Lightning Flash Record confirmed by WMO: a 477.2-mile megaflash spanning Mississippi, Louisiana, and Texas,…
View more
Electricity complaints filed by Texans reach three-year high, report says
Texas Electricity Complaints surged to a three-year high, highlighting Public Utility Commission data on billing…
View more
B.C. Commercial electricity consumption plummets during COVID-19 pandemic
BC Hydro COVID-19 Relief Fund enables small businesses to waive electricity bills for commercial properties…
View more

New Mexico Governor to Sign 100% Clean Electricity Bill ‘As Quickly As Possible’
New Mexico Energy Transition Act advances zero-carbon electricity, mandating public utilities deliver carbon-free electricity by…
View more
Sign Up for Electricity Forum’s Newsletter
Stay informed with our FREE Newsletter — get the latest news, breakthrough technologies, and expert insights, delivered straight to your inbox.
Electricity Today T&D Magazine Subscribe for FREE

Stay informed with the latest T&D policies and technologies.
- Timely insights from industry experts
- Practical solutions T&D engineers
- Free access to every issue
