Substation Relay Protection Training
Our customized live online or in‑person group training can be delivered to your staff at your location.

- Live Online
- 12 hours Instructor-led
- Group Training Available
Regular Price:
$699
Coupon Price:
$599
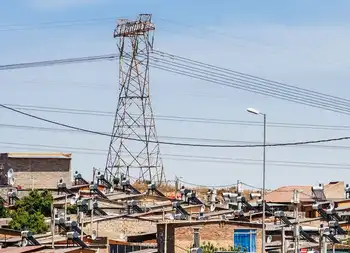
Smart Grid Technologies are driving market growth through transmission upgrades, substation and distribution automation, smart meters, and grid IT, boosting reliability and capacity while cutting energy losses and enabling advanced metering infrastructure.
The Latest Developments
Smart grid technologies use hardware and IT to modernize networks, boosting reliability and efficiency and cutting losses.
- Market rises from $33B (2012) to $73B (2020); $494B cumulative.
- 832 million smart meters deployed between 2011 and 2020.
- Utilities pursue AMI, transmission upgrades, and automation.
- Improves reliability, capacity, and reduces energy losses.
The creation of the smart grid remains a colossal undertaking. Many complex smart grid programs are underway, but the scale of what remains to be done is enormous.
The challenges ahead translate into strong growth for vendors of smart grid technologies – transmission upgrades, automation of substations and distribution, smart grid IT, and smart meters. According to a new report from Pike Research, entitled, “Smart Grid Technologies”, and a smart grid study indicating broader economic impacts, the market for smart grid technologies will grow from $33 billion annually in 2012 to $73 billion by the end of 2020, totaling $494 billion in cumulative revenue over that period.
“The overlay of modern smart grid technologies onto existing grids promises numerous benefits to utilities, including increased reliability and capacity, reduced energy losses and efforts to reduce power theft across networks, and deferring or eliminating the need for new generation resources,” says senior research analyst Bob Lockhart. “These benefits reach far beyond the business of any particular utility to underlie economic growth, social well-being, and the shift to energy sources, including a transition for renewables that are less damaging to the environment.”
There is no single “smart grid solution” or green grid approach that will work for all utilities, according to the report. Utilities are likely to take individual approaches to smart grids, some starting with smart metering while others begin with transmission upgrades.
However, the number of smart meter deployments estimated at a total of 832 million smart meters during the 2011-2020 timeframe, including 212 million by 2014 worldwide, implies that quite a few utilities have yet to set out on an advanced metering infrastructure course but are likely to do so over the coming seven years.
Related News
Related News
BC residents split on going nuclear for electricity generation: survey
BC Energy Debate: Nuclear Power and LNG divides British Columbia, as a new survey weighs…
View more
US Electricity Market Reforms could save Consumers $7bn
PJM and MISO Electricity-Market Reforms promise consumer savings by enabling renewables, wind, solar, and storage…
View more
South Africa's Eskom could buy less power from wind farms during lockdown
Eskom Wind Power Curtailment reflects South Africa's lockdown-driven drop in electricity demand, prompting grid-balancing measures…
View more
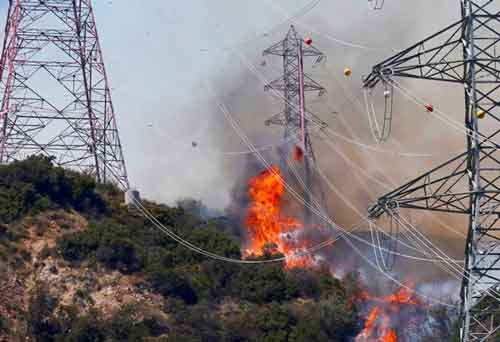
Southern California Edison Faces Lawsuits Over Role in California Wildfires
SCE Wildfire Lawsuits allege utility equipment and power lines sparked deadly Los Angeles blazes; investigations,…
View more

Victims of California's mega-fire will sue electricity company
PG&E Wildfire Lawsuit alleges utility negligence, inadequate infrastructure maintenance, and faulty transmission lines, as victims…
View more

Electrification Of Vehicles Prompts BC Hydro's First Call For Power In 15 Years
BC Hydro Clean Power Call 2024 seeks utility-scale renewable energy, including wind and solar, to…
View more
Sign Up for Electricity Forum’s Newsletter
Stay informed with our FREE Newsletter — get the latest news, breakthrough technologies, and expert insights, delivered straight to your inbox.
Electricity Today T&D Magazine Subscribe for FREE

Stay informed with the latest T&D policies and technologies.
- Timely insights from industry experts
- Practical solutions T&D engineers
- Free access to every issue

