Protective Relay Training - Basic
Our customized live online or in‑person group training can be delivered to your staff at your location.

- Live Online
- 12 hours Instructor-led
- Group Training Available
Regular Price:
$699
Coupon Price:
$599
Tracy Aviary is harvesting rays to light up their Australian lorikeets, tropical flamingos and the stars of the bird show.
Photovoltaic solar collectors now grace the roof of the lorikeets' winter digs, a new building at the aviary that has the sanctuary's only south-facing rooftop with airspace unobstructed by trees. The collectors are creating enough electricity for the nearby flamingo winter house and the backstage area for performing birds.
Getting a $50,000 grant to pay for the system was "a long shot," said architect Angela Dean, who wrote the proposal for a Rocky Mountain Power renewable energy grant.
"The exchange was education," Dean said.
That means letting the public know that solar power can be captured just about anywhere and put to use in a variety of settings - homes, offices, even big birdhouses, said Rocky Mountain Power spokesman Jeff Hymas.
Solar energy engineer Ken Gardner designed the system to be grid-tied: The solar energy comes in as direct current to an inverter which converts the electricity to alternating current that goes into the utility grid.
When there's not enough sun power to run the lights, Rocky Mountain Power provides. When the sun is bright and the system is creating more than enough electricity for the aviary's use, the utility buys it. The books are balanced at the end of each billing period.
"It's better to (under-produce) a little, because the power company doesn't pay that much" - about 3 cents per kilowatt-hour, Gardner said.
Gardner estimated the 30-panel, 450-square-foot array of collectors will produce up to 1,000 kilowatt-hours of electricity per month. Each day, the system yields about 30 kwh and avoids 50 pounds of greenhouse gas emissions. The flamingo winter house and the bird show enclosure also get solar energy because they are tied to the same electricity breaker as the lorikeet house.
Tim Brown, Tracy Aviary executive director, said the aviary's annual electricity use is between 17,000 and 18,000 kwh per year - so the system is a significant contribution to the aviary's overall power needs.
Some birds native to warmer climes can retreat to little houses with heat lamps when it's cold, but the rainbow-colored, nectar-eating lorikeets need full winter shelter. Their winter house has gas heat that warms the floors. The solar energy powers the lights for the birds and humans using the three restrooms also in the building, said Tracy Aviary spokeswoman Julie Brown.
The $50,000 grant to Tracy Aviary is one of five the electric utility is paying for out of its Blue Sky wind-power funds, and the second to come online since the awards were announced last year. A second round of renewable energy grants will be announced in August.
In Utah, more than 20,000 residential and business customers buy Blue Sky, which purchases wind power from generators in Washington, Oregon and Wyoming.
As the customer base has grown in Utah, so has interest in seeing some of that money fund renewable projects here, Hymas said.
Related News
'Net Zero' Emissions Targets Not Possible Without Multiple New Nuclear Power Stations, Say Industry Leaders
UK Nuclear Power Expansion is vital for low-carbon baseload, energy security, and Net Zero, complementing…
View more
NT Power Penalized $75,000 for Delayed Disconnection Notices
NT Power OEB Compliance Penalty highlights a $75,000 fine for improper disconnection notices, 14-day rule…
View more
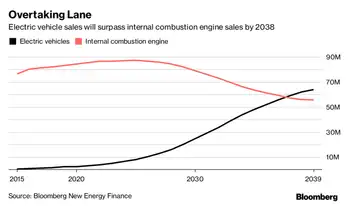
Canada's Ambitious Electric Vehicle Goals
Canada 2035 Gasoline Car Ban accelerates EV adoption, zero-emission transport, and climate action, with charging…
View more
APS asks customers to conserve energy after recent blackouts in California
Arizona Energy Conservation Alert urges APS and TEP customers to curb usage during a heatwave,…
View more
Parked Electric Cars Earn $1,530 From Europe's Power Grids
Vehicle-to-Grid Revenue helps EV owners earn income via V2G, demand response, and ancillary services by…
View more
Calgary electricity retailer urges government to scrap overhaul of power market
Alberta Capacity Market Overhaul faces scrutiny over electricity costs, reliability targets, investor certainty, and AESO…
View more
Sign Up for Electricity Forum’s Newsletter
Stay informed with our FREE Newsletter — get the latest news, breakthrough technologies, and expert insights, delivered straight to your inbox.
Electricity Today T&D Magazine Subscribe for FREE

Stay informed with the latest T&D policies and technologies.
- Timely insights from industry experts
- Practical solutions T&D engineers
- Free access to every issue

