NFPA 70E Training
Our customized live online or in‑person group training can be delivered to your staff at your location.

- Live Online
- 6 hours Instructor-led
- Group Training Available
Regular Price:
$199
Coupon Price:
$149
VANCOUVER
—
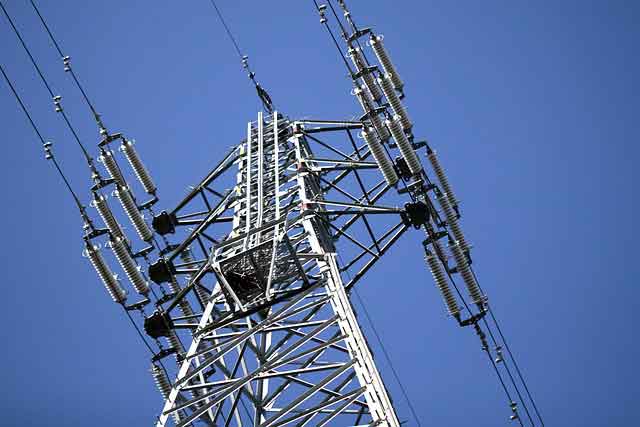
Nithi Mountain Wind Project delivers 200 MW of renewable wind power in British Columbia under a BC Hydro electricity purchase deal, producing 600 GWh yearly, led by Stellat'en First Nation and Innergex.
What's Happening
A 200 MW wind farm in British Columbia producing 600 GWh yearly, co-owned by Stellat'en First Nation and Innergex.
30-year BC Hydro take-or-pay PPA, CPI-indexed
200 MW capacity, ~600 GWh per year for ~60,000 homes
51% Stellat'en First Nation; operations targeted for 2030
In December 2024, a significant development unfolded in British Columbia's renewable energy sector, where the clean-energy regulatory process continues to evolve, as Stellat'en First Nation and Innergex Renewable Energy Inc. announced the signing of a 30-year electricity purchase agreement with BC Hydro. This agreement pertains to the Nithi Mountain Wind Project, a 200 MW initiative poised to enhance the province's clean energy capacity.
Project Overview
The Nithi Mountain Wind Project is a collaborative venture between Stellat'en First Nation, which holds a 51% stake, and Innergex Renewable Energy Inc., which holds a 49% stake. Located in the Bulkley-Nechako region of British Columbia, the project is expected to generate approximately 600 GWh of renewable electricity annually, comparable to other large-scale projects like the 280 MW wind farm in Alberta now online, sufficient to power around 60,000 homes. The wind farm is scheduled to commence commercial operations in 2030.
Economic and Community Impact
This partnership is anticipated to create approximately 150 job opportunities during the development, construction, and operational phases, thereby supporting local economic growth and workforce development, and aligns with recent federal green electricity procurement efforts that signal broader market support. The long-term electricity purchase agreement with BC Hydro is structured as a 30-year take-or-pay contract, indexed to a predefined percentage of the Consumer Price Index (CPI), ensuring financial stability and protection against inflation.
Environmental and Cultural Considerations
The Nithi Mountain Wind Project is being developed in close collaboration with First Nations in the area, guided by collaborative land-use planning. The project integrates cultural preservation, environmental stewardship, and economic empowerment for Indigenous communities in the Bulkley-Nechako region, while other solutions such as tidal energy for remote communities are also advancing across Canada. The project is committed to minimizing environmental impact by avoiding sensitive cultural and ecological resources and integrating sustainability at every stage, with remediation practices to restore the land, preserve cultural values, and enhance biodiversity and wildlife habitats if decommissioned.
Broader Implications
This agreement underscores a growing trend of collaboration between Indigenous communities, exemplified by the Ermineskin First Nation project emerging nationwide, and renewable energy developers in Canada. Such partnerships are instrumental in advancing sustainable energy projects that respect Indigenous rights and contribute to the nation's clean energy objectives, as renewable power developers find that diversified energy sources strengthen project outcomes. The Nithi Mountain Wind Project exemplifies how integrating traditional knowledge with modern renewable energy technologies can lead to mutually beneficial outcomes for both Indigenous communities and the broader society.
In summary, the Nithi Mountain Wind Project represents a significant step forward in British Columbia's renewable energy landscape, highlighting the importance of collaboration between Indigenous communities and renewable energy developers. The project promises substantial economic, environmental, and cultural benefits, setting a precedent for future partnerships in the clean energy sector, as large-scale storage acquisitions like Centrica's battery project illustrate complementary pathways to unlock wind potential.
Related News
Related News

Manitoba looking to raise electricity rates 2.5 per cent each year for 3 years
Manitoba Hydro Rate Increase sets electricity rates up 2.5% annually for three years via Bill…
View more
Investigation underway to determine cause of Atlanta Airport blackout
Atlanta Airport Power Outage disrupts Hartsfield-Jackson as an underground fire cripples switchgear redundancy, canceling flights…
View more
U.S. Grid overseer issues warning on Coronavirus
NERC COVID-19 Grid Security Alert urges utilities to update business continuity plans, assess supply chain…
View more
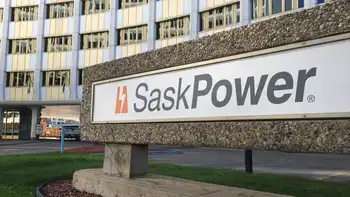
Sask. Party pledges 10% rebate on SaskPower electricity bills
SaskPower 10% Electricity Rebate promises one-year bill relief for households, farms, businesses, hospitals, schools, and…
View more

With New Distributed Energy Rebate, Illinois Could Challenge New York in Utility Innovation
Illinois NextGrid redefines utility, customer, and provider roles with grid modernization, DER valuation, upfront rebates,…
View more
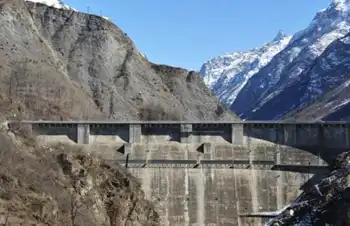
China to build 525-MW hydropower station on Yangtze tributary
Baima Hydropower Station advances China renewable energy on the Wujiang River, a Yangtze tributary in…
View more
Sign Up for Electricity Forum’s Newsletter
Stay informed with our FREE Newsletter — get the latest news, breakthrough technologies, and expert insights, delivered straight to your inbox.
Electricity Today T&D Magazine Subscribe for FREE

Stay informed with the latest T&D policies and technologies.
- Timely insights from industry experts
- Practical solutions T&D engineers
- Free access to every issue
