Summerland solar power project will provide electricity


summerside electric

Substation Relay Protection Training

Our customized live online or in‑person group training can be delivered to your staff at your location.

  • Live Online
  • 12 hours Instructor-led
  • Group Training Available
Regular Price:
$699
Coupon Price:
$599
Reserve Your Seat Today

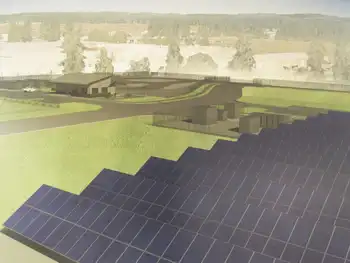
Summerland Solar+Storage Project brings renewable energy to a municipal utility with photovoltaic panels and battery storage, generating 1,200 megawatts from 3,200 panels on Cartwright Mountain to boost grid resilience and local clean power.


Key Points

A municipal solar PV and battery system enabling Summerland Power to self-generate electricity on Cartwright Mountain.
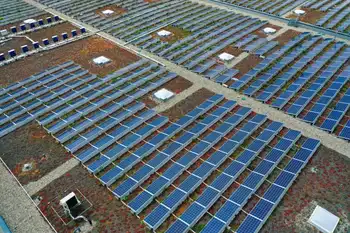
✅ 3,200 panels, 20-year batteries, 35-year panel lifespan

✅ Estimated $7M cost, $6M in grants, utility reserve funding

✅ Site near grid lines; 2-year timeline with 18-month lead


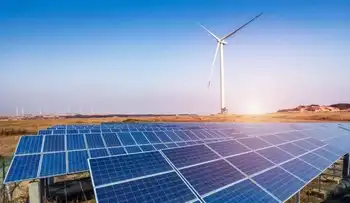
A proposed solar energy project, to be constructed on municipally-owned property on Cartwright Mountain, will allow Summerland Power to produce some of its own electricity, similar to how Summerside's wind power supplies a large share locally.

On Monday evening, municipal staff described the Solar+Storage project, aligning with insights from renewable power developers that combining resources yields better projects.

The project will include around 3,200 solar panels and storage batteries, giving Summerland Power the ability to generate 1,200 megawatts of electrical power.

This is the amount of energy used by 100 homes over the course of a year.

The solar panels have an estimated life expectancy of 35 years, while the batteries have a life expectancy of 20 years.

“It’s a really big step for a small utility like ours,” said Tami Rothery, sustainability/alternative energy coordinator for Summerland. “We’re looking forward to moving towards a bright, sunny energy future.”

She said the price of solar panels has been dropping, with lower-cost solar contracts reported in Alberta, and the quality and efficiency of the panels has increased in recent years.

The total cost of the project is around $7 million, with $6 million to come from grant funding and the remainder to come from the municipality’s electrical utility reserve fund, while policy changes such as Nova Scotia's solar charge delay illustrate evolving market conditions.

The site, a former public works yard and storage area, was selected from 108 parcels of land considered by the municipality.

She said the site, vacant since the 1970s, is close to main electrical lines and will not be highly visible once the panels are in place, much like unobtrusive rooftop solar arrays in urban settings.

Access to the site is restricted, resulting in natural security to the solar installation.

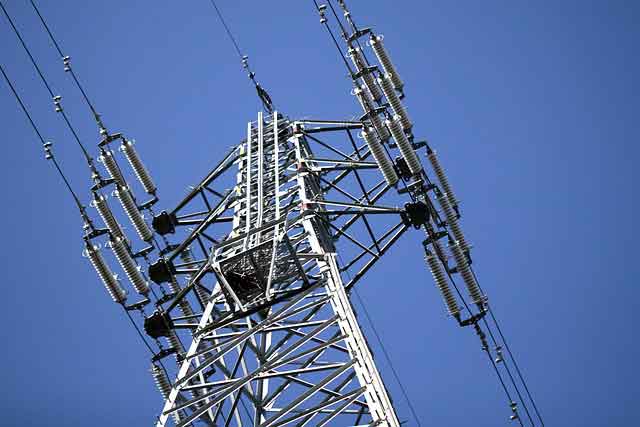
Jeremy Storvold, general manager of Summerland’s electrical utility, said the site is 2.5 kilometres from the Prairie Valley electrical substation and close to the existing public works yard.

However, some in the audience on Monday questioned the location of the proposed solar installation, suggesting the site would be better suited for affordable housing in the community.

The timeline for the project calls for roughly two years before the work will be completed, since there is an 18-month lead time in order to receive good quality solar panels, reflecting the surge in Alberta's solar growth that is straining supply chains.


Related News

Related News

Hungary's Quiet Alliance with Russia in Europe's Energy Landscape

Hungary's Russian Energy Dependence underscores EU tensions, as TurkStream gas flows, discounted imports, and pipeline reliance challenge sanctions, energy security, diversification, and decoupling goals amid Ukraine war pressures and bloc unity concerns.


Key Points

It is Hungary's reliance on Russian gas and oil via TurkStream, complicating EU sanctions and energy independence.

✅ 85% gas, 60% oil imports from Russia via TurkStream pipelines.

✅ Discounted contracts seldom cut bills; security cited by Budapest.

✅ EU decoupling targets hampered; sanctions leverage and unity erode.


Hungary's energy policies have positioned it as a notable outlier within the European Union, particularly in the context of the ongoing geopolitical tensions stemming from Russia's invasion of Ukraine. While the EU has been actively working to reduce its dependence on Russian energy sources through an EU $300 billion plan to dump Russian energy, Hungary has maintained and even strengthened its energy ties with Moscow, raising concerns about EU unity and the effectiveness of sanctions.

Strategic Energy Dependence

Hungary's energy infrastructure is heavily reliant on Russian supplies. Approximately 85% of Hungary's natural gas and more than 60% of its oil imports originate from Russia. This dependence is facilitated through pipelines such as TurkStream, which delivers Russian gas to Hungary via Turkey and the Balkans amid Europe's energy nightmare over price volatility and security. In 2025, Hungary's gas imports through TurkStream are projected to reach 8 billion cubic meters, a significant increase from previous years. These imports are often secured at discounted rates, although such savings may not always be passed on to Hungarian consumers.

Political and Economic Considerations

Prime Minister Viktor Orbán has been a vocal critic of EU sanctions against Russia and has consistently blocked EU initiatives aimed at providing military aid to Ukraine, even as Ukraine leans on power imports to keep the lights on. His government argues that Russia's military capabilities make it an unyielding adversary and that a ceasefire would only solidify its territorial gains. Orbán's stance has led to Hungary's isolation within the EU on matters related to the conflict in Ukraine.

Economically, Hungary's reliance on Russian energy has been justified by the government as a means to maintain low energy prices for consumers and ensure energy security. However, critics argue that this strategy undermines EU efforts to achieve energy independence and reduces the bloc's leverage over Russia amid a global energy war marked by price hikes and instability.

EU's Response and Challenges

The European Union has set ambitious goals to reduce its reliance on Russian energy, aiming to halt imports of Russian natural gas by the end of 2027 and prohibit new contracts starting in 2025 while exploring gas price cap strategies to contain market volatility. However, Hungary's continued imports of Russian energy complicate these efforts. The TurkStream pipeline, in particular, has become a focal point in discussions about the EU's energy strategy, as it enables ongoing Russian gas exports to Europe despite the bloc's broader decoupling initiatives.

Hungary's actions have raised concerns among other EU member states about the effectiveness of the sanctions regime and the potential for other countries to exploit similar loopholes. There are calls for stricter policies, including banning spot gas purchases and enforcing traceability of gas origins, and consideration of emergency measures to limit electricity prices to ensure genuine energy independence and reduce overreliance on external suppliers.

Hungary's steadfast energy relationship with Russia presents a significant challenge to the European Union's collective efforts to reduce dependence on Russian energy sources. While Hungary argues that its energy strategy is in the national interest, it risks undermining EU solidarity and the bloc's broader geopolitical objectives. As the EU continues to navigate its energy transition and response to the ongoing conflict in Ukraine, including energy ceasefire violations reported by both sides, Hungary's position will remain a critical point of contention within the union.


Related News

View more

Ottawa sets out to protect its hydro heritage

Ottawa Hydro Substation Heritage Designation highlights Hydro Ottawa's 1920s architecture, Art Deco facades, and municipal utility history, protecting key voltage-reduction sites in Glebe, Carling-Merivale, Holland, King Edward, and Old Ottawa South.


Key Points

A city plan to protect Hydro Ottawa's 1920s substations for architecture, utility role, and civic electrical heritage.

✅ Protects five operating voltage-reduction sites citywide

✅ Recognizes Art Deco and early 20th century utility architecture

✅ Allows emergency demolition to ensure grid safety


The city of Ottawa is looking to designate five hydro substations built nearly a century ago as heritage structures, a move intended to protect the architectural history of Ottawa's earliest forays into the electricity business, even as Ottawa electricity consumption has shifted in recent years.

All five buildings are still used by Hydro Ottawa to reduce the voltage coming from transmission lines before the electricity is transmitted to homes and businesses, and when severe weather causes outages, Sudbury Hydro crews work to reconnect service across communities.

Electricity came to Ottawa in 1882 when two carbon lamps were installed on LeBreton Flats, heritage planner Anne Fitzpatrick told the city's built heritage subcommittee on Tuesday. It became a lucrative business, and soon a privately owned monopoly that drew public scrutiny similar to debates over retroactive charges in neighboring jurisdictions.

In 1905, city council held a special meeting to buy the electrical company, which led to a dramatic drop in electricity rates for residents, a contrast with recent discussions about peak hydro rates for self-isolating customers.

The substations are now owned by Hydro Ottawa, which agreed to the heritage designations on the condition it not be prevented from emergency demolitions if it needs to address incidents such as damaging storms in Ontario while it works to "preserve public safety and the continuity of critical hydro electrical services."

Built in 1922, the substation at the intersection of Glebe and Bronson avenues was the first to be built by the new municipal electrical department, long before modern battery storage projects became commonplace on Ontario's grid.

The largest of the substations being protected dates back to 1929 and is found at the corner of Carling Avenue and Merivale Road. It was built to accommodate a growing population in areas west of downtown including Hintonburg and Mechanicsville.

The substation on Holland Avenue near the Queensway is different from the others because it was built in 1924 to serve the Ottawa Electric Railway Company. The streetcar company operated from 1891 to 1959, and urban electrical infrastructure can face failures such as the Hydro-Québec manhole fire that left thousands without power.

This substation on King Edward Avenue was built in 1931 and designed by architect William Beattie, who also designed York Street Public School in Lowertown and the substation on Carling Avenue. 

The last substation to be built in a 'bold and decorative style' is at 39 Riverdale Ave. in Old Ottawa South, according to city staff. It was designed in an Art Deco style by prominent architect J. Albert Ewart, who was also behind the Civic Hospital and nearby Southminster Church on Bank Street.


Related News

View more

Wind and solar make more electricity than nuclear for first time in UK

UK Renewables Surpass Nuclear Milestone as wind farms and solar panels outpace atomic output, cutting greenhouse gas emissions. BEIS data show low-carbon power generation rising while onshore wind subsidies and auction timelines face policy debate.


Key Points

It is the quarter when UK wind and solar generated more electricity than nuclear, signaling cleaner, low-carbon growth.

✅ BEIS reports wind and solar at 18.33 TWh vs nuclear 16.69 TWh

✅ Energy sector emissions fell 8% as coal use dropped

✅ Calls grow to reopen onshore wind support via CFD auctions


Wind farms and solar panels, with wind leading the power mix during key periods, produced more electricity than the UK’s eight nuclear power stations for the first time at the end of last year, official figures show.

Britain’s greenhouse gas emissions also continued to fall, dropping 3% in 2017, as coal use fell and the use of renewables climbed, though low-carbon generation stalled in 2019 according to later data.

Energy experienced the biggest drop in emissions of any UK sector, of 8%, while pollution from transport and businesses stayed flat.

Energy industry chiefs said the figures showed that the government should rethink its ban on onshore wind subsidies, a move that ministers have hinted could happen soon.

Lawrence Slade, chief executive of the big six lobby group Energy UK, said: “We need to keep up the pace ... by ensuring that the lowest cost renewables are no longer excluded from the market.”

Across the whole year, low-carbon sources of power – wind, solar, biomass and nuclear – provided a record 50.4% of electricity, up from 45.7% in 2016, when wind beat coal for the first time.

But in the fourth quarter of 2017, high wind speeds, new renewables installations and lower nuclear output saw wind and solar becoming the second biggest source of power for the first time.

Wind and solar generated 18.33 terawatt hours (TWh), with nuclear on 16.69TWh, and the UK later set a new record for wind power during 2019, the figures published by the Department for Business, Energy and Industrial Strategy show.

But renewables still have a long way to go to catch up with gas, the UK’s top source of electricity at 36.12TWh, which saw its share of generation fall slightly, though at times wind became the main source as capacity expanded.

Greenpeace said the figures showed the government should capitalise on its lead in renewables and “stop wasting time and money propping up nuclear power”.

Horizon Nuclear Power, a subsidiary of the Japanese conglomerate Hitachi, is in talks with Whitehall officials for a financial support package from the government, which it says it needs by midsummer.

By contrast, large-scale solar and onshore wind projects are not eligible for support, after the Conservative government cut subsidies in 2015.

However the energy minister, Claire Perry, recently told House Magazine that “we will have another auction that brings forward wind and solar, we just haven’t yet said when”.


Related News

View more

Price Spikes in Ireland Fuel Concerns Over Dispatachable Power Shortages in Europe

ISEM Price Volatility reflects Ireland-Northern Ireland grid balancing pressures, driven by dispatchable power shortages, day-ahead market dynamics, renewable shortfalls, and interconnector constraints, affecting intraday trading, operational reserves, and cross-border electricity flows.


Key Points

ISEM price volatility is Irish power price swings from grid balancing stress and limited dispatchable capacity.

✅ One-off spike linked to plant outage and low renewables

✅ Day-ahead market settling; intraday trading integration pending

✅ Interconnectors and reserves vital to manage adequacy


Irish grid-balancing prices soared to €3,774 ($4,284) per megawatt-hour last month amid growing concerns over dispatchable power capacity across Europe.

The price spike, triggered by an alert regarding generation losses, came only four months after Ireland and Northern Ireland launched an Integrated Single Electricity Market (ISEM) designed to make trading more competitive and improve power distribution across the island.

Evie Doherty, senior consultant for Ireland at Cornwall Insight, a U.K.-based energy consultancy, said significant price volatility was to be expected while ISEM is still settling down, aligning with broader 2019 grid edge trends seen across markets.

When the U.K. introduced a single market for Great Britain, called British Electricity Trading and Transmission Arrangements, in 2005, it took at least six months for volatility to subside, Doherty said.

In the case of ISEM, “it will take more time to ascertain the exact drivers behind the high prices,” she said. “We are being told that the day-ahead market is functioning as expected, but it will take time to really be able to draw conclusions on efficiency.”

Ireland and Northern Ireland have been operating with a single market “very successfully” since 2007, said Doherty. Although each jurisdiction has its own regulatory authority, they make joint decisions regarding the single market.

ISEM, launched in October 2018, was designed to help include Ireland and Northern Ireland day-ahead electricity prices in a market pricing system called the European Union Pan-European Hybrid Electricity Market Integration Algorithm.

In time, ISEM should also allow the Irish grids to participate in European intraday markets, and recent examples like Ukraine's grid connection underline the pace of integration efforts across Europe. At present, they are only able to do so with Great Britain. “The idea was to...integrate energy use and create more efficient flows between jurisdictions,” Doherty said.

EirGrid, the Irish transmission system operator, has reported that flows on its interconnector with Northern Ireland are more efficient than before, she said.

The price spike happened when the System Operator for Northern Ireland issued an alert for an unplanned plant outage at a time of low renewable output and constraints on the north-south tie-line with Ireland, according to a Cornwall Insight analysis.


Not an isolated event

Although it appears to have been a one-off event, there are increasing worries that a shortage of dispatchable power could lead to similar situations elsewhere across Europe, as seen in Nordic grid constraints recently.

Last month, newspaper Frankfurter Allgemeine Zeitung (FAZ) reported that German industrial concerns had been forced to curtail more than a gigawatt of power consumption to maintain operational reserves on the grid in December, after renewable production fell short of expectations and harsh weather impacts strained systems elsewhere.

Paul-Frederik Bach, a Danish energy consultant, has collected data showing that this was not an isolated incident. The FAZ report said German aluminum smelters had been forced to cut back on energy use 78 times in 2018, he noted.

Energy availability was also a concern last year in Belgium, where six out of seven nuclear reactors had been closed for maintenance. The closures forced Belgium to import 23 percent of its electricity from neighboring countries, Bach reported.

In a separate note, Bach revealed that 11 European countries that were net importers of energy had boosted their imports by 26 percent between 2017 and 2018. It is important to note that electricity imports do not necessarily imply a shortage of power, he stated.

However, it is also true that many European grid operators are girding themselves for a future in which dispatchable power is scarcer than today.

EirGrid, for example, expects dispatchable generation and interconnection capacity to drop from 10.6 gigawatts in 2018 to 9 gigawatts in 2027.

The Swedish transmission system operator Svenska Kraftnät, meanwhile, is forecasting winter peak power deficits could rise from 400 megawatts currently to 2.5 gigawatts in 2020-21.

Research conducted by the European Network of Transmission System Operators for Electricity, suggests power adequacy will fall across most of Europe up to 2025, although perhaps not to a critical degree.

The continent’s ability to deal with the problem will be helped by having more efficient trading systems, Bach told GTM. That means developments such as ISEM could be a step in the right direction, despite initial price volatility.

In the long run, however, Europe will need to make sure market improvements are accompanied by investments in HVDC technology and interconnectors and reserve capacity. “Somewhere there must be a production of electricity, even when there is no wind,” said Bach. 


Related News

View more

UK low-carbon electricity generation stalls in 2019

UK low-carbon electricity 2019 saw stalled growth as renewables rose slightly, wind expanded, nuclear output fell, coal hit record lows, and net-zero targets demand faster deployment to cut CO2 intensity below 100gCO2/kWh.


Key Points

Low-carbon sources supplied 54% of UK power in 2019, up just 1TWh; wind grew, nuclear fell, and coal dropped to 2%.

✅ Wind up 8TWh; nuclear down 9TWh amid outages

✅ Fossil fuels 43% of generation; coal at 2%

✅ Net-zero needs 15TWh per year added to 2030


The amount of electricity generated by low-carbon sources in the UK stalled in 2019, Carbon Brief analysis shows.

Low-carbon electricity output from wind, solar, nuclear, hydro and biomass rose by just 1 terawatt hour (TWh, less than 1%) in 2019. It represents the smallest annual increase in a decade, where annual growth averaged 9TWh. This growth will need to double in the 2020s to meet UK climate targets while replacing old nuclear plants as they retire.

Some 54% of UK electricity generation in 2019 came from low-carbon sources, including 37% from renewables and 20% from wind alone, underscoring wind's leading role in the power mix during key periods. A record-low 43% was from fossil fuels, with 41% from gas and just 2% from coal, also a record low. In 2010, fossil fuels generated 75% of the total.

Carbon Brief’s analysis of UK electricity generation in 2019 is based on figures from BM Reports and the Department for Business, Energy and Industrial Strategy (BEIS). See the methodology at the end for more on how the analysis was conducted.

The numbers differ from those published earlier in January by National Grid, which were for electricity supplied in Great Britain only (England, Wales and Scotland, but excluding Northern Ireland), including via imports from other countries.

Low-carbon low
In 2019, the UK became the first major economy to target net-zero greenhouse gas emissions by 2050, increasing the ambition of its legally binding Climate Change Act.

To date, the country has cut its emissions by around two-fifths since 1990, with almost all of its recent progress coming from the electricity sector.

Emissions from electricity generation have fallen rapidly in the decade since 2010 as coal power has been almost phased out and even gas output has declined. Fossil fuels have been displaced by falling demand and by renewables, such as wind, solar and biomass.

But Carbon Brief’s annual analysis of UK electricity generation shows progress stalled in 2019, with the output from low-carbon sources barely increasing compared to a year earlier.

The chart below shows low-carbon generation in each year since 2010 (grey bars) and the estimated level in 2019 (red). The pale grey bars show the estimated future output of existing low-carbon sources after old nuclear plants retire and the pale red bars show the amount of new generation needed to keep electricity sector emissions to less than 100 grammes of CO2 per kilowatt hour (gCO2/kWh), the UK’s nominal target for the sector.

 Annual electricity generation in the UK by fuel, terawatt hours, 2010-2019. Top panel: fuel by fuel. Bottom panel: cumulative total generation from all sources. Source: BEIS energy trends, BM Reports and Carbon Brief analysis. Chart by Carbon Brief using Highcharts.
As the chart shows, the UK will require significantly more low-carbon electricity over the next decade as part of meeting its legally binding climate goals.

The nominal 100gCO2/kWh target for 2030 was set in the context of the UK’s less ambitious goal of cutting emissions to 80% below 1990 levels by 2050. Now that the country is aiming to cut emissions to net-zero by 2050, that 100gCO2/kWh indicator is likely to be the bare minimum.

Even so, it would require a rapid step up in the pace of low-carbon expansion, compared to the increases seen over the past decade. On average, low-carbon generation has risen by 9TWh each year in the decade since 2010 – including a rise of just 1TWh in 2019.

Given scheduled nuclear retirements and rising demand expected by the Committee on Climate Change (CCC) – with some electrification of transport and heating – low-carbon generation would need to increase by 15TWh each year until 2030, just to meet the benchmark of 100gCO2/kWh.

For context, the 3.2 gigawatt (GW) Hinkley C new nuclear plant being built in Somerset will generate around 25TWh once completed around 2026. The world’s largest offshore windfarm, the 1.2GW Hornsea One scheme off the Yorkshire coast, will generate around 5TWh each year.

The new Conservative government is targeting 40GW of offshore wind by 2030, up from today’s figure of around 8GW. If policies are put in place to meet this goal, then it could keep power sector emissions below 100gCO2/kWh, depending on the actual performance of the windfarms built.

However, new onshore wind and solar, further new nuclear or other low-carbon generation, such as gas with carbon capture and storage (CCS), is likely to be needed if demand is higher than expected, or if the 100gCO2/kWh benchmark is too weak in the context of net-zero by 2050.

The CCC says it is “likely” to “reflect the need for more rapid deployment” of low-carbon towards net-zero emissions in its advice on the sixth UK carbon budget for 2033-2037, due in September.

Trading places
Looking more closely at UK electricity generation in 2019, Carbon Brief’s analysis shows why there was so little growth for low-carbon sources compared to the previous year.

There was another increase for wind power in 2019 (up 8TWh, 14%), with record wind generation as several large new windfarms were completed including the 1.2GW Hornsea One project in October and the 0.6GW Beatrice offshore windfarm in Q2 of 2019. But this was offset by a decline for nuclear (down 9TWh, 14%), due to ongoing outages for reactors at Hunterston in Scotland and Dungeness in Kent.

(Analysis of data held by trade organisation RenewableUK suggests some 0.6GW of onshore wind capacity also started operating in 2019, including the 0.2GW Dorenell scheme in Moray, Scotland.)

As a result of these movements, the UK’s windfarms overtook nuclear for the first time ever in 2019, becoming the country’s second-largest source of electricity generation, and earlier, wind and solar together surpassed nuclear in the UK as momentum built. This is shown in the figure below, with wind (green line, top panel) trading places with nuclear (purple) and gas (dark blue) down around 25% since 2010 but remaining the single-largest source.

 Annual electricity generation in the UK by fuel, terawatt hours, 2010-2019. Top panel: fuel by fuel. Bottom panel: cumulative total generation from all sources. Source: BEIS energy trends, BM Reports and Carbon Brief analysis. Chart by Carbon Brief using Highcharts.
The UK’s currently suspended nuclear plants are due to return to service in January and March, according to operator EDF, the French state-backed utility firm. However, as noted above, most of the UK’s nuclear fleet is set to retire during the 2020s, with only Sizewell B in Suffolk due to still be operating by 2030. Hunterston is scheduled to retire by 2023 and Dungeness by 2028.

Set against these losses, the UK has a pipeline of offshore windfarms, secured via “contracts for difference” with the government, at a series of auctions. The most recent auction, in September 2019, saw prices below £40 per megawatt hour – similar to current wholesale electricity prices.

However, the capacity contracted so far is not sufficient to meet the government’s target of 40GW by 2030, meaning further auctions – or some other policy mechanism – will be required.

Coal zero
As well as the switch between wind and nuclear, 2019 also saw coal fall below solar for the first time across a full year, echoing the 2016 moment when wind outgenerated coal across the UK, after it suffered another 60% reduction in electricity output. Just six coal plants remain in the UK, with Aberthaw B in Wales and Fiddlers Ferry in Cheshire closing in March.

Coal accounted for just 2% of UK generation in 2019, a record-low coal share since centralised electricity supplies started to operate in 1882. The fuel met 40% of UK needs as recently as 2012, but has plummeted thanks to falling demand, rising renewables, cheaper gas and higher CO2 prices.

The reduction in average coal generation hides the fact that the fuel is now often not required at all to meet the UK’s electricity needs. The chart below shows the number of days each year when coal output was zero in 2019 (red line) and the two previous years (blue).

 Cumulative number of days when UK electricity generation from renewable sources has been higher than that from fossil fuels. Source: BEIS energy trends, BM Reports and Carbon Brief analysis. Chart by Carbon Brief using Highcharts.
The 83 days in 2019 with zero coal generation amount to nearly a quarter of the year and include the record-breaking 18-day stretch without the fuel.

Great Britain has been running for a record TWO WEEKS without using coal to generate electricity – the first time this has happened since 1882.

The country’s grid has been coal-free for 45% of hours in 2019 so far.https://www.carbonbrief.org/countdown-to-2025-tracking-the-uk-coal-phase-out …

Coal generation was set for significant reductions around the world in 2019 – including a 20% reduction for the EU as a whole – according to analysis published by Carbon Brief in November.

Notably, overall UK electricity generation fell by another 9TWh in 2019 (3%), bringing the total decline to 58TWh since 2010. This is equivalent to more than twice the output from the Hinkley C scheme being built in Somerset. As Carbon Brief explained last year, falling demand has had a similar impact on electricity-sector CO2 emissions as the increase in output from renewables.

This is illustrated by the fact that the 9TWh reduction in overall generation translated into a 9TWh (6%) cut in fossil-fuel generation during 2019, with coal falling by 10TWh and gas rising marginally.

Increasingly renewable
As fossil-fuel output and overall generation have declined, the UK’s renewable sources of electricity have continued to increase. Their output has risen nearly five-fold in the past decade and their share of the UK total has increased from 7% in 2010 to 37% in 2019.

As a result, the UK’s increasingly renewable grid is seeing more minutes, hours and days during which the likes of wind, solar and biomass collectively outpace all fossil fuels put together, and on some days wind is the main source as well.

The chart below shows the number of days during each year when renewables generated more electricity than fossil fuels in 2019 (red line) and each of the previous four years (blue lines). In total, nearly two-fifths of days in 2019 crossed this threshold.

 Cumulative number of days when the UK has not generated any electricity from coal. Source: BEIS energy trends, BM Reports and Carbon Brief analysis. Chart by Carbon Brief using Highcharts.
There were also four months in 2019 when renewables generated more of the UK’s electricity than fossil fuels: March, August, September and December. The first ever such month came in September 2018 and more are certain to follow.

National Grid, which manages Great Britain’s high-voltage electricity transmission network, is aiming to be able to run the system without fossil fuels by 2025, at least for short periods. At present, it sometimes has to ask windfarm operators to switch off and gas plants to start running in order to keep the electricity grid stable.

Note that biomass accounted for 11% of UK electricity generation in 2019, nearly a third of the total from all renewables. Some two-thirds of the biomass output is from “plant biomass”, primarily wood pellets burnt at Lynemouth in Northumberland and the Drax plant in Yorkshire. The remainder was from an array of smaller sites based on landfill gas, sewage gas or anaerobic digestion.

The CCC says the UK should “move away” from large-scale biomass power plants, once existing subsidy contracts for Drax and Lynemouth expire in 2027.

Using biomass to generate electricity is not zero-carbon and in some circumstances could lead to higher emissions than from fossil fuels. Moreover, there are more valuable uses for the world’s limited supply of biomass feedstock, the CCC says, including carbon sequestration and hard-to-abate sectors with few alternatives.

Methodology
The figures in the article are from Carbon Brief analysis of data from BEIS Energy Trends chapter 5 and chapter 6, as well as from BM Reports. The figures from BM Reports are for electricity supplied to the grid in Great Britain only and are adjusted to include Northern Ireland.

In Carbon Brief’s analysis, the BM Reports numbers are also adjusted to account for electricity used by power plants on site and for generation by plants not connected to the high-voltage national grid. This includes many onshore windfarms, as well as industrial gas combined heat and power plants and those burning landfill gas, waste or sewage gas.

By design, the Carbon Brief analysis is intended to align as closely as possible to the official government figures on electricity generated in the UK, reported in BEIS Energy Trends table 5.1.

Briefly, the raw data for each fuel is in most cases adjusted with a multiplier, derived from the ratio between the reported BEIS numbers and unadjusted figures for previous quarters.

Carbon Brief’s method of analysis has been verified against published BEIS figures using “hindcasting”. This shows the estimates for total electricity generation from fossil fuels or renewables to have been within ±3% of the BEIS number in each quarter since Q4 2017. (Data before then is not sufficient to carry out the Carbon Brief analysis.)

For example, in the second quarter of 2019, a Carbon Brief hindcast estimates gas generation at 33.1TWh, whereas the published BEIS figure was 34.0TWh. Similarly, it produces an estimate of 27.4TWh for renewables, against a BEIS figure of 27.1TWh.

National Grid recently shared its own analysis for electricity in Great Britain during 2019 via its energy dashboard, which differs from Carbon Brief’s figures.


Related News

View more

Electric shock: China power demand drops as coronavirus shutters plants

China Industrial Power Demand 2020 highlights COVID-19 disruption to electricity consumption as factory output stalls; IHS Markit estimates losses equal to Chile's usage, impacting thermal coal, LNG, and Hubei's industrial load.


Key Points

An analysis of COVID-19's hit to China's electricity use, cutting industry demand and fuel needs for coal and LNG.

✅ 73 billion kWh loss equals Chile's annual power use

✅ Cuts translate to 30m tonnes coal or 9m tonnes LNG

✅ Hubei peak load 21 percent below plan amid shutdowns


China’s industrial power demand in 2020 may decline by as much as 73 billion kilowatt hours (kWh), according to IHS Markit, as the outbreak of the coronavirus has curtailed factory output and prevented some workers from returning to their jobs.

FILE PHOTO: Smoke is seen from a cooling tower of a China Energy ultra-low emission coal-fired power plant during a media tour, in Sanhe, Hebei province, China July 18, 2019. REUTERS/Shivani Singh
The cut represents about 1.5% of industrial power consumption in China. But, as the country is the world’s biggest electricity consumer and analyses of China's electricity appetite routinely underscore its scale, the loss is equal to the power used in the whole of Chile and it illustrates the scope of the disruption caused by the outbreak.

The reduction is the energy equivalent of about 30 million tonnes of thermal coal, at a time when China aims to reduce coal power production, or about 9 million tonnes of liquefied natural gas (LNG), IHS said. The coal figure is more than China’s average monthly imports last year while the LNG figure is a little more than one month of imports, based on customs data.

China has tried to curtail the spread of the coronavirus that has killed more than 1,400 and infected over 60,000 by extending the Lunar New Year holiday for an extra week and encouraging people to work from home, measures that contributed to a global dip in electricity demand as well.

Last year, industrial users consumed 4.85 trillion kWh electricity, accounting for 67% of the country’s total, even as India's electricity demand showed sharp declines in the region.

Xizhou Zhou, the global head of power and Renewables at IHS Markit, said that in a severe case where the epidemic goes on past March, China’s economic growth will be only 4.2% during 2020, down from an initial forecast of 5.8%, while power consumption will climb by only 3.1%, down from 4.1% initially, even as power cuts and blackouts raise concerns.

“The main uncertainty is still how fast the virus will be brought under control,” said Zhou, adding that the impact on the power sector will be relatively modest from a full-year picture in 2020, even though China's electric power woes are already clouding solar markets.

In Hubei province, the epicenter of the virus outbreak, the peak power load at the end of January was 21% less than planned, mirroring how Japan's power demand was hit during the outbreak, data from Wood Mackenzie showed.

Industrial operating rates point to a firm reduction in power consumption in China.

Utilization rates at plastic processors are between 30% and 60% and the low levels are expected to last for another two week, according to ICIS China.

Weaving machines at textile plants are operating at below 10% of capacity, the lowest in five years, ICIS data showed. China is the world’s biggest textile and garment exporter.


Related News

View more

Sign Up for Electricity Forum’s Newsletter

Stay informed with our FREE Newsletter — get the latest news, breakthrough technologies, and expert insights, delivered straight to your inbox.

Electricity Today T&D Magazine Subscribe for FREE

Stay informed with the latest T&D policies and technologies.
  • Timely insights from industry experts
  • Practical solutions T&D engineers
  • Free access to every issue

Download the 2025 Electrical Training Catalog

Explore 50+ live, expert-led electrical training courses –

  • Interactive
  • Flexible
  • CEU-cerified