CSA Z463 Electrical Maintenance -
Our customized live online or in‑person group training can be delivered to your staff at your location.

- Live Online
- 6 hours Instructor-led
- Group Training Available
Regular Price:
$249
Coupon Price:
$199
Sunrise Solar Corp. addresses “solar myths” that often arise in shareholder questions relating to the role of solar power in America’s future energy plans.
Myth 1: Solar electricity cannot provide a significant part of America's electricity needs.
Fact: The solar energy resource in a 100 square mile area of Nevada could supply ALL of the electricity needs of the United States, even while using today's modestly efficient solar cell technology. Of course a more logical plan is to use sites in all 50 states to generate America's electricity needs. Solar systems covering America's 5 million acres of abandoned industrial sites alone could produce 90% of our power needs.
Myth 2: Solar energy can solve our problems right now!
Fact: The solar industry does not currently have the capacity to meet all current demands. High demand is expected to continue for many years to come, which will provide strong growth prospects for solar companies.
Myth 3: Solar is a cottage industry appealing only to smaller markets.
Fact: Over the past several years the solar industry has achieved 30% annual growth. It is a multi-billion dollar industry that is growing rapidly and could reach $15 billion annually within the next 5 years. Current projections suggest that within the next 20 years more than 300,000 Americans will have solar related jobs.
Myth 4: Solar is too expensive to compete with the "big boys" of power generation.
Fact: The cost of making a solar cell capable of producing one watt of electricity has fallen from approximately $50 twenty years ago, to under $3 today. In some markets the cost of solar power is now under $0.11 per kwh, which is competitive with traditional power generations methods. It is expected that the return on investment for new solar modules will be less than 24 months, resulting in 20 or more years of clean, near-zero cost energy.
Related News

UK windfarms generate record amount of electricity during Storm Malik
UK Wind Power Record as Storm Malik boosts renewable electricity, with National Grid reporting 19,500…
View more

Iran eyes transmitting electricity to Europe as region’s power hub
Iran Electricity Grid Synchronization enables regional interconnection, cross-border transmission, and Caspian-Europe energy corridors, linking Iraq,…
View more

Duke Energy installing high-tech meters for customers
Duke Energy Smart Meters enable remote meter reading, daily energy usage data, and two-way outage…
View more
Modular nuclear reactors a 'long shot' worth studying, says Yukon gov't
Yukon SMR Feasibility Study examines small modular reactors as low-emissions nuclear power for Yukon's grid…
View more
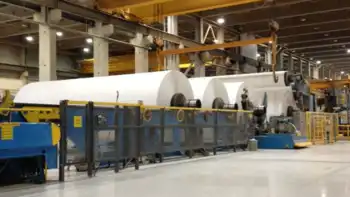
Nova Scotia's last paper mill seeks new discount electricity rate
Nova Scotia Power Active Demand Control Tariff lets the utility direct Port Hawkesbury Paper load,…
View more
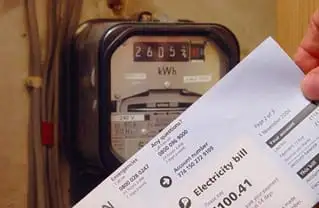
During this Pandemic, Save Money - How To Better Understand Your Electricity Bill
Commercial Electric Tariffs explain utility rate structures, peak demand charges, kWh vs kW pricing, time-of-use…
View more
Sign Up for Electricity Forum’s Newsletter
Stay informed with our FREE Newsletter — get the latest news, breakthrough technologies, and expert insights, delivered straight to your inbox.
Electricity Today T&D Magazine Subscribe for FREE

Stay informed with the latest T&D policies and technologies.
- Timely insights from industry experts
- Practical solutions T&D engineers
- Free access to every issue
