CSA Z463 Electrical Maintenance -
Our customized live online or in‑person group training can be delivered to your staff at your location.

- Live Online
- 6 hours Instructor-led
- Group Training Available
Regular Price:
$249
Coupon Price:
$199
Officials at American Electric Power Co. say they know the cause of a fire that led to a shutdown of one of two reactors at the Donald C. Cook Nuclear Plant in southwestern Michigan.
The utility says the fire in Unit 1 of the plant in Berrien County's Lake Township began when turbine vibrations caused a generator to leak hydrogen that ignited.
The Columbus, Ohio-based utility says fire damage is minimal but the vibrations more seriously damaged turbines, bearing supports and some steam piping.
An imbalance from the loss of turbine rotor blades probably caused the vibrations.
It will take one to three weeks to complete turbine inspections, then officials will have a better idea of when they can restart the reactor.
Related News
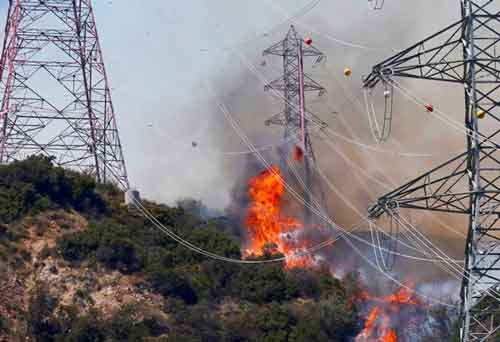
Southern California Edison Faces Lawsuits Over Role in California Wildfires
SCE Wildfire Lawsuits allege utility equipment and power lines sparked deadly Los Angeles blazes; investigations,…
View more
UK Emergency energy plan not going ahead
National Grid Demand Flexibility Service helps stabilise the UK grid during tight supply, offering discounts…
View more

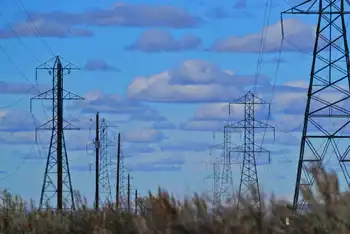
Calgary's electricity use soars in frigid February, Enmax says
Calgary Winter Energy Usage Surge highlights soaring electricity demand, added megawatt-hours, and grid reliability challenges…
View more
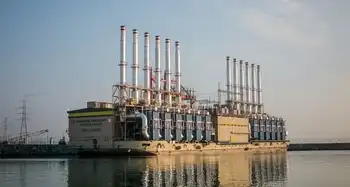
Turkish powership to generate electricity from LNG in Senegal
Karpowership LNG powership in Senegal will supply 15% of the grid, a 235 MW floating…
View more
Ontario utilities team up to warn customers about ongoing scams
Ontario Utility Scam Alert: protect against phishing, spoofed calls, texts, and emails, disconnection threats, and…
View more
Germany launches second wind-solar tender
Germany's Joint Onshore Wind and Solar Tender invites 200 MW bids in an EEG auction,…
View more
Sign Up for Electricity Forum’s Newsletter
Stay informed with our FREE Newsletter — get the latest news, breakthrough technologies, and expert insights, delivered straight to your inbox.
Electricity Today T&D Magazine Subscribe for FREE

Stay informed with the latest T&D policies and technologies.
- Timely insights from industry experts
- Practical solutions T&D engineers
- Free access to every issue

