Higher price of electric cars a concern for more than half of UK consumers


uk ev

NFPA 70e Training

Our customized live online or in‑person group training can be delivered to your staff at your location.

  • Live Online
  • 6 hours Instructor-led
  • Group Training Available
Regular Price:
$199
Coupon Price:
$149
Reserve Your Seat Today

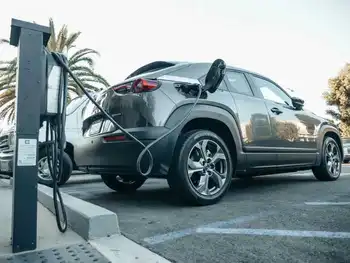
UK EV Affordability pressures electric car demand as EV prices outpace petrol models; subsidies, battery electric vehicles, plug-in hybrids, and charging infrastructure investment shape uptake, CO2 targets, and total cost of ownership.


Key Points

UK EV Affordability captures pricing, policy, and infrastructure factors driving electric car demand and adoption.

✅ Higher upfront EV prices dampen consumer demand.

✅ Broader subsidies and PHEV incentives debated.

✅ Massive charging point rollout needed by 2035.


Expensive prices for electric cars could hold back the UK’s transition from fossil fuel vehicles, the industry has warned, amid signs that demand for electric vehicles (EVs) is waning, despite a recent surge in inquiries during a fuel supply crisis.

The premium paid for electric cars is a concern for more than half of UK consumers, according to a poll conducted on behalf of the Society of Motor Manufacturers and Traders (SMMT), the UK car industry lobby group, and Brexit-related tariffs risk higher costs for new models.

Despite government subsidies, battery electric cars are still more expensive than those burning petrol or diesel, but carmakers are scrambling to ramp up production and sales as the age of electric cars accelerates across markets in order to meet the new restrictions on emissions that came in this year.

Sales of new battery electric cars have almost tripled to 39,000 in the year to July, but there are signs that demand is falling back even as some analysts predict that drivers will go electric within a decade in the UK. Data from online marketplace Auto Trader show that the average asking price for electric cars fell 5.2% in the year to August.

Ian Plummer, Auto Trader’s commercial director, said the higher “upfront retail price of EVs is somewhat off-putting” for consumers, despite the potential savings from their cheaper running costs.

Mike Hawes, the SMMT’s chief executive, said: “Until these vehicles are as affordable to buy and as easy to own and operate as conventional cars, we risk the UK being in the slow lane, undermining industry investment and holding back progress.”

The SMMT has been calling for the UK government to broaden the subsidies offered to buyers of new electric cars to include plug-in hybrid vehicles, while fairer vehicle taxes are being demanded by EV drivers to support adoption. The withdrawal of subsidies from plug-in hybrids last year prompted a furious reaction from the industry, which argues the controversial technology, which combines an internal combustion engine with a battery, is a crucial stepping stone for consumers.

However, environmental groups argue that the best way to accelerate consumer take-up of electric cars is to bring forward bans on internal combustion engines. The government is committed to banning polluting carbon dioxide-emitting engines by 2040, but is considering moving that forward to 2035 or even as early as 2032.

Both the industry and environmental groups are united in calling for a dramatic increase in investment in charging points to make it more attractive for consumers around the country to switch to electric cars, with industry figures saying the UK must be ready for a surge in EV uptake.

The UK will require as many as 1.7m on-street electric car charging points by the end of the decade, and a further 1.1m by 2035, in order to allow for a zero-emissions car fleet, while experts ask whether the grid can cope with rising demand, according to analysis by the SMMT and consultancy Frost and Sullivan. That would equate to more than 500 new charge points per day over 15 years.

Related News

Canada must commit to 100 per cent clean electricity

Canada Green Investment Gap highlights lagging EV and clean energy funding as peers surge. With a green recovery budget pending, sustainable finance, green bonds, EV charging, hydrogen, and carbon capture are pivotal to decarbonization.


Key Points

Canada lags peers in EV and clean energy investment, urging faster budget and policy action to cut emissions.

✅ Per capita climate spend trails US and EU benchmarks

✅ EVs, hydrogen, charging need scaled funding now

✅ Strengthen sustainable finance, green bonds, disclosure


Canada is being outpaced on the international stage when it comes to green investments in electric vehicles and green energy solutions, environmental groups say.

The federal government has an opportunity to change course in about three weeks, when the Liberals table their first budget in over two years, the International Institute for Sustainable Development (IISD) argued in a new analysis endorsed by nine other climate action, ecology and conservation organizations.

“Canada’s international peers are ramping up commitments for green recovery, including significant investments from many European countries,” states the analysis, “Investing for Tomorrow, Today,” published March 29.

“To keep up with our global peers, sufficient investments and strengthened regulations, including EV sales regulations, must work in tandem to rapidly decarbonize all sectors of the Canadian economy.”

Deputy Prime Minister and Finance Minister Chrystia Freeland confirmed last week that the federal budget will be tabled April 19. The Liberals are expected to propose between $70 billion and $100 billion in fiscal stimulus to jolt the economy out of its pandemic doldrums.

The government teased a coming economic “green transformation” late last year when Freeland released the fall economic statement, promising to examine federal green bonds, border carbon adjustments and a sustainable finance market, with tweaks like tightening the climate-risk disclosure obligations of corporations.

The government has also proposed a wide range of green measures in its new climate plan released in December — which the think tank called the “most ambitious” in Canada’s history — including energy retrofit programs, boosting hydrogen and other alternative fuels, and rolling out carbon capture technology in a grid where 18% of electricity still came from fossil fuels in 2019.

But the possible “three-year stimulus package to jumpstart our recovery” mentioned in the fall economic statement came with the caveat that the COVID-19 virus would have to be “under control.” While vaccines are being administered, Canada is currently dealing with a rise of highly transmissible variants of the virus.

Freeland spoke with United States Vice-President Kamala Harris on March 25, highlighting potential Canada-U.S. collaboration on EVs alongside the “need to support entrepreneurs, small businesses, young people, low-wage and racialized workers, the care economy, and women” in the context of an economic recovery.

Biden is contemplating a climate recovery plan that could exceed US$2 trillion as Canada looks to capitalize on the U.S. auto pivot to EVs to spur domestic industry. Per capita, that is over 8 times what Canada has announced so far for climate-related spending in the wake of the pandemic, according to a new analysis from green groups.
U.S. President Joe Biden is contemplating a climate and clean energy recovery plan that could “exceed US$2 trillion,” White House officials told reporters this month. “Per capita, that is over eight times what Canada has announced so far for climate-related spending in the wake of the pandemic,” the IISD-led analysis stated.

Biden’s election platform commitment of $508 billion over 10 years in clean energy was also seen as “significantly higher per capita than Canada’s recent commitments.”

Since October 2020, Canada has announced $36 billion in new climate-focused funding, a 2035 EV mandate and other measures, the groups found. By comparison, they noted, a political agreement in Europe proposed that a minimum of 37 per cent of investments in each national recovery plan should support climate action. France and Germany have also committed tens of billions of dollars to support clean hydrogen.

As for electric vehicles (EVs), the United Kingdom has committed $4.9 billion, while Germany has put up $7.5 billion to expand EV adoption and charging infrastructure and sweeten incentive programs for prospective buyers, complementing Canada’s ambitious EV goals announced domestically. The U.K. has also committed $3.5 billion for bike lanes and other active transportation, the groups noted.

Canada announced $400 million over five years this month for a new network of bike lanes, paths, trails and bridges, the first federal fund dedicated to active transportation.


Related News

View more

What to know about DOE's hydrogen hubs

U.S. Clean Hydrogen Hubs aim to scale production, storage, transport, and use as DOE and the Biden administration fund regional projects under the infrastructure law, blending green and blue hydrogen, carbon capture, renewables, and pipelines.


Key Points

Federally funded regional projects to make, move, and use low-carbon hydrogen via green, blue, and pink routes.

✅ $7B DOE funding via infrastructure law

✅ Mix of green, blue, pink hydrogen pathways

✅ Targets 10M metric tons annually by 2030


New details are emerging about the Biden administration’s landmark plans to build out a U.S. clean hydrogen industry.

On Friday, the Department of Energy named the seven winners of $7 billion in federal funds to establish regional hydrogen hubs. The hubs — funded through the infrastructure law — are part of the administration’s efforts to jump-start an industry it sees as key to achieving climate goals like the goal of 100 percent clean electricity by 2035 set by the administration. The aim is to demonstrate everything from the production and storage of hydrogen to its transport and consumption.

“All across the country, from coast to coast, in the heartland, we’re building a clean energy future here in America, not somewhere else,” President Joe Biden said while announcing the hubs in Philadelphia.

From 79 initial proposals, DOE chose the following: the Mid-Atlantic Hydrogen Hub, Appalachian Hydrogen Hub, California Hydrogen Hub, Gulf Coast Hydrogen Hub, Heartland Hydrogen Hub, Midwest Hydrogen Hub and Pacific Northwest Hydrogen Hub.

Many of the winning proposals are backed by state government leaders and industry partners, and by Southeast cities that have ramped up clean energy purchases in recent years as well. The Midwest hub, for example, is a coalition of Illinois, Indiana and Michigan — supported by politicians like Illinois Gov. J.B. Pritzker (D), as well as such companies as Air Liquide, Ameren Illinois and Atlas Agro. The mid-Atlantic hub is supported by Democratic members of Congress representing the region, including Delaware Sens. Chris Coons and Tom Carper and Rep. Lisa Blunt Rochester.

The administration hopes the hubs will produce 10 million metric tons of “clean” hydrogen annually by 2030. But much about the projects remains unknown — including how trends like cheap batteries for solar could affect clean power supply — and dependent on negotiations with DOE.


A win for ‘blue’ hydrogen?
Nearly all hydrogen created in the U.S. today is extracted from natural gas through steam methane reformation. The emissions-intensive process produces what is known as “grey” hydrogen — or “blue” hydrogen when combined with carbon capture and storage.

Four recipients — the Appalachian, Gulf Coast, Heartland and Midwest hydrogen hubs — include blue hydrogen in their plans, though the infrastructure law only mandated one.

That has drawn the ire of environmentalists, who argue blue hydrogen is not emissions-free, partly because of the potential for methane leaks during the production process.

“This is worse than expected,” Clean Energy Group President Seth Mullendore said after the recipients were announced Friday. “The fact that more than half the hubs will be using fossil gas is outrageous.”

Critics have also pointed out that many of the industry partners backing the hub projects include oil and gas companies. The coalitions are a mix of private-sector groups — often including renewable energy developers — and government stakeholders. Proposals have also looped in universities, utilities, environmental groups, community organizations, labor unions and tribal nations, among others.

“The massive build out of hydrogen infrastructure is little more than an industry ploy to rebrand fracked gas,” said Food & Water Watch Policy Director Jim Walsh in a statement Friday. “In a moment when every political decision that we make must reject fossil expansion, the Biden administration is going in the opposite direction.”

The White House has emphasized that roughly two-thirds of the $7 billion pot is “associated” with the production of “green” hydrogen, which uses electricity from renewable sources. Two of the chosen proposals — in California and the Pacific Northwest — are making green hydrogen their focus, reflecting advances such as offshore green hydrogen being pursued by industry leaders, while three other hubs plan to include green hydrogen alongside hydrogen made with natural gas (blue) or nuclear energy (pink).

Many hubs plan to use several methods for hydrogen production, and globally, projects like Brazil's green hydrogen plant highlight the scale of investment, but the exact mix may change depending on which projects make it through the DOE negotiations process. The Midwest hub, for example, told E&E News it’s pursuing an “all-of-the-above” strategy and has projects for green, blue and “pink” hydrogen. The mid-Atlantic hub in southeastern Pennsylvania, Delaware and New Jersey will also generate hydrogen with nuclear reactors.

Energy Secretary Jennifer Granholm has described clean hydrogen as a fresh business opportunity, especially for the natural gas industry, which has supported the concept of sending hydrogen to market through its pipeline network. Lawmakers like Sen. Joe Manchin (D-W.Va.) — who said the Appalachian hub will make West Virginia the “new epicenter of hydrogen” — have pushed for continuing to use natural gas to make hydrogen in his state.

“Natural gas utilities are committed to exploring all options for emissions reduction as demonstrated by the 39 hydrogen pilot projects already underway and are eager to participate in a number of the hubs,” said American Gas Association President and CEO Karen Harbert in a statement Friday.

Green hydrogen also has faced criticism. Some groups argue that the renewable resources needed to produce green hydrogen are limited, even with sources such as wind, solar and hydropower technology, so funding should be reserved for applications that cannot be easily electrified, mostly industrial processes. There also is uncertainty about how the Treasury Department will handle hydrogen made from grid electricity — which can include power from fossil fuel plants — in its upcoming guidance on the first-ever tax credit for clean hydrogen production.

“Even the cleanest forms of hydrogen present serious problems,” Walsh said. “As groundwater sources are drying up across the country, there is no reason to waste precious drinking water resources on hydrogen when there are cheaper, cleaner energy sources that can facilitate a real transition off fossil fuels.”

But Angelina Galiteva, CEO of the hub in drought-prone California, said hydrogen will enable the state “to increase renewable penetration to reach all corners of the economy,” noting parallel initiatives such as Dubai's solar hydrogen plans that illustrate the potential.

“Transitioning to renewable clean hydrogen will pose significantly less stress on water resources than remaining on the current fossil path,” she said.


Related News

View more

World Bank helps developing countries wind spurt

World Bank Offshore Wind Investment drives renewables and clean energy in developing countries, funding floating turbines and shallow-water foundations to replace fossil fuels, expand grids, and scale climate finance across Latin America, Africa, and Asia.


Key Points

A World Bank program funding offshore wind to speed clean power, cut fossil fuels, and expand grids in emerging markets.

✅ US$80bn to 565 onshore wind projects since 1995

✅ Pilot funds offshore wind in Asia, Africa, Latin America

✅ Floating turbines and shallow-water foundations enable deep resources


Europe and the United States now accept onshore wind power as the cheapest way to generate electricity, and U.S. lessons from the U.K. are informing policy discussions. But this novel technology still needs subsidising before some developing countries will embrace it. Enter the World Bank.

A total of US$80 billion in subsidies from the Bank has gone over 25 years to 565 developing world onshore wind projects, to persuade governments to invest in renewables rather than rely on fossil fuels.

Central and Latin American countries have received the lions share of this investment, but the Asia Pacific region and Eastern Europe have also seen dozens of Bank-funded developments. Now the fastest-growing market is in Africa and the Middle East, where West African hydropower support can complement variable wind resources.

But while continuing to campaign for more onshore wind farms, the World Bank in 2019 started encouraging target countries to embrace offshore wind as well. This uses two approaches: turbines in shallow water, which are fixed to the seabed, and also a newer technology, involving floating turbines anchored by cables at greater depth.

The extraordinary potential for offshore wind, which is being commercially developed very fast in Europe, including the UK's offshore expansion, China and the U.S. offshore wind sector today as well, is now seen by the Bank as important for countries like Vietnam which could harness enough offshore wind power to provide all its electricity needs.

Other countries it has identified with enormous potential for offshore wind include Brazil, Indonesia, India, the Philippines, South Africa and Sri Lanka, all of them countries that need to keep building more power stations to connect every citizen to the national grid.

The Bank began investing in wind power in 1995, with its spending reaching billions of dollars annually in 2011. The biggest single recipient has been Brazil, receiving US$24.2 bn up to the end of 2018, 30 per cent of the total the Bank has invested worldwide.

Many private companies have partnered with the Bank to build the wind farms. The biggest single beneficiary is Enel, the Italian energy giant, which has received US$6.1 bn to complete projects in Brazil, Mexico, South Africa, Romania, Morocco, Bulgaria, Peru, and Russia.

Among the countries now benefitting from the Banks continuing onshore wind programme are Egypt, Morocco, Senegal, Jordan, Vietnam, Thailand, Indonesia and the Philippines.

Offshore wind now costs less than nuclear power, and global costs have fallen enough to compete in most countries with fossil fuels. Currently the fastest-growing industry in the world, it continued to grow despite Covid-19 across most markets.

Persistent coal demand

Particularly in Asia, some countries are continuing to burn large quantities of coal and are considering investing in yet more fossil fuel generation unless they can be persuaded that renewables are a better option, with an offshore wind $1 trillion outlook underscoring the scale.

Last year the World Bank began a pilot scheme to explore funding investment in offshore wind in these countries. Launching the scheme Riccardo Puliti, a senior director at the Bank, said: Offshore wind is a clean, reliable and secure source of energy with massive potential to transform the energy mix in countries that have great wind resources.

We have seen it work in Europe we can now make use of global experience to scale up offshore wind projects in emerging markets.

Using data from the Global Wind Atlas, the Bank calculated that developing countries with shallow waters like India, Turkey and Sri Lanka had huge potential with fixed turbines, while others the Philippines and South Africa, for example would need floating foundations to reach greater depths, up to 1,000 metres.

For countries like Vietnam, with a mix of shallow and deep water, wind power could solve their entire electricity needs. In theory offshore wind power could produce ten times the amount of electricity that the country currently gets from all its current power stations, the Bank says.


Related News

View more

BC's Kootenay Region makes electric cars a priority

Accelerate Kootenays EV charging stations expand along Highway 3, adding DC fast charging and Level 2 plugs to cut range anxiety for electric vehicles in B.C., linking communities like Castlegar, Greenwood, and the Alberta border.


Key Points

A regional network of DC fast and Level 2 chargers along B.C.'s Highway 3 to reduce range anxiety and boost EV adoption.

✅ 13 DC fast chargers plus 40 Level 2 stations across key hubs

✅ 20-minute charging stops reduce range anxiety on Highway 3

✅ Backed by BC Hydro, FortisBC, and regional districts


The Kootenays are B.C.'s electric powerhouse, and as part of B.C.'s EV push the region is making significant advances to put electric cars on the road.

The region's dams generate more than half of the province's electricity needs, but some say residents in the region have not taken to electric cars, for instance.

Trish Dehnel is a spokesperson for Accelerate Kootenays, a multi-million dollar coalition involving the regional districts of East Kootenay, Central Kootenay and Kootenay Boundary, along with a number of corporate partners including Fortis B.C. and BC Hydro.

She says one of the major problems in the region — in addition to the mountainous terrain and winter driving conditions — is "range anxiety."

That's when you're not sure your electric vehicle will be able to make it to your destination without running out of power, she explained.

Now, Accelerate Kootenays is hoping a set of new electric charging stations, part of the B.C. Electric Highway project expanding along Highway 3, will make a difference.


No more 'range anxiety'

The expansion includes 40 Level 2 stations and 13 DC Quick Charging stations, mirroring BC Hydro's expansion across southern B.C. strategically located within the region to give people more opportunities to charge up along their travel routes, Dehnel said.

"We will have DC fast-charging stations in all of the major communities along Highway 3 from Greenwood to the Alberta border. You will be able to stop at a fast-charging station and, thanks to faster EV charging technology, charge your vehicle within 20 minutes," she said.

Castlegar car salesman Terry Klapper — who sells the 2017 Chevy Bolt electric vehicle — says it's a great step for the region as sites like Nelson's new fast-charging station come online.

"I guarantee that you'll be seeing electric cars around the Kootenays," he said.

"The interest the public has shown … [I mean] as soon as people found out we had these Bolts on the lot, we've had people coming in every single day to take a look at them and say when can I finally purchase it."

The charging stations are set to open by the end of next year.


Related News

View more

Solar produced 4.7% of U.S. electricity in 2022, generation up 25%

US Solar Electricity Generation 2022 rose to a 4.7% share, with 202,256 GWh, per EIA Electric Power Monthly; driven by PV capacity additions despite import constraints, alongside renewables trends in wind, nuclear, and hydroelectric output.


Key Points

The share and output of US solar PV in 2022: 4.7% of electricity and 202,256 GWh, as reported by the EIA.

✅ Solar PV reached 4.7% of US power; 202,256 GWh generated in 2022.

✅ Monthly share varied from about 3% in Jan to just over 6% in Apr.

✅ Wind was 10.1%; wind+solar hit slightly over 20% in April.


In 2022, solar photovoltaics made up 4.7% of U.S. electricity generation, an increase of almost 21% over the 2021 total when solar produced 3.9% of US electricity and about 3% in 2020 according to long-term outlooks. Total solar generation was up 25%, breaking through 200,000 GWh for the year.

The record deployment volumes of 2020 when renewables became the second-most U.S. electricity source and 2021 are the main factors behind this increase. If it were not for ongoing solar panel import difficulties and general inflation, solar’s contribution to electricity generation might have reached 5% in 2022. The data was released by the Department of Energy’s Energy Information Administration (EIA) in their Electric Power Monthly. This release includes data from December 2022, as well as the rest of the data from 2022.

Solar as a percentage of monthly electricity generation ranged from a low of almost 3% in January, to just over 6% in April. April’s production marked a new monthly record for solar generation in the US and coincided with a renewables share record that month.

Total generation of solar electricity peaked in July, at 21,708 GWh. Over the course of the year, solar production reached  202,256 GWh, and total U.S. electricity generation reached 4,303,980 GWh, a year in which renewables surpassed coal in the power mix overall. Total US electricity generation increased by 3.5% over the 4,157,467 GWh produced in 2021.

In 2022, wind energy contributed 10.1% of the total electricity generated in the United States. Wind and solar together produced 14.8% of U.S. electricity in 2022, growing from the 13% recorded in 2021. In April, when solar power peaked at just over 6%, wind and solar power together reached a peak of slightly over 20%, as a wind-and-solar milestone versus nuclear was noted that month, a new monthly record for the two energy sources.

In total, emissions free energy sources such as wind, solar photovoltaic and thermal, nuclear, hydroelectric, and geothermal, accounted for 37.9% of the total electricity generated in the U.S., while renewables provided about 25.5% share of the mix during the year. This value is barely higher than 2020’s 37.7% – but represents a return to growth after 2021 saw a decrease in emission free electricity to 37%.

Nuclear power was the most significant contributor to emission free electricity, making up a bit more than 45% of the total emissions free electricity. Wind energy ranked second at 26%, followed by hydroelectricity at 15%, and solar photovoltaic at 12%, confirming solar as the #3 renewable in the U.S. mix.

Emissions free electricity is a different summation than the EIA’s ‘Renewable Energy’ category. The Renewable Energy category also includes:

  • Wood and Wood-Derived Fuels
  • Landfill Gas
  • Biogenic Municipal Solid Waste
  • Other Waste Biomass

Nuclear produced 17.9% of the total U.S. electricity, a value that has generally stayed flat over the years. However, since nuclear facilities are being retired faster than new facilities are coming online, nuclear production has fallen in the past two years. After multiple long delays, we will probably see reactor three of the Vogtle nuclear facility come online in 2023. Reactor four is officially scheduled to come online later this year.

Hydroelectric production also declined in 2022, due to drought conditions in the southwestern United States. With rain and snow storms in California and the southwest, hydroelectricity generation may rebound in 2023.


Related News

View more

Is residential solar worth it?

Home Solar Cost vs Utility Bills compares electricity rates, ROI, incentives, and battery storage, explaining payback, financing, and grid fees while highlighting long-term savings, rate volatility, and backup power resilience for homeowners.


Key Points

Compares home solar pricing and financing to utility rates, outlining savings, incentives, ROI, and backup power value.

✅ Average retail rates rose 59% in 20 years; volatility persists

✅ Typical 7.15 kW system costs $18,950 before incentives

✅ Federal ITC and state rebates improve ROI and payback


When shopping for a home solar system, sometimes the quoted price can leave you wondering why someone would move forward with something that seems so expensive. 

When compared with the status quo, electricity delivered from the utility, the price may not seem so high after all. First, pv magazine will examine the status quo, and how much you can expect to pay for power if you don’t get solar panels. Then, we will examine the average cost of solar arrays today and introduce incentives that boost home solar value.

The cost of doing nothing

Generally, early adopters have financially benefited from going solar by securing price certainty and stemming the impact of steadily increasing utility-bill costs, particularly for energy-insecure households who pay more for electricity.

End-use residential electric customers pay an average of $0.138/kWh in the United States, according to the Energy Information Administration (EIA). In California, that rate is $0.256/kWh, it averages $0.246/kWh across New England, $0.126/kWh in the South Atlantic region, and $0.124/kWh in the Mountain West region.

EIA reports that the average home uses 893 kWh per month, so based on the average retail rate of $0.138/kWh, that’s an electric bill of about $123 monthly, or $229 monthly in California.

Over the last 20 years, EIA data show that retail electricity prices have increased 59% across the United States, with evidence indicating that renewables are not making electricity more expensive, suggesting other factors have driven costs higher, or 2.95% each year.

This means based on historical rates, the average US homeowner can expect to pay $39,460 over the next 20 years on electricity bills. On average, Californians could pay $73,465 over 20 years.

Recent global events show just how unstable prices can be for commodities, and energy is no exception here, with solar panel sales doubling in the UK as homeowners look to cut soaring bills. What will your utility bill cost in 20 years?

These estimated bills also assume that energy use in the home is constant over 20 years, but as the United States electrifies its homes, adds more devices, and adopts electric vehicles, it is fair to expect that many homeowners will use more electricity going forward.

Another factor that may exacerbate rate raising is the upgrade of the national transmission grid. The infrastructure that delivers power to our homes is aging and in need of critical upgrades, and it is estimated that a staggering $500 billion will be spent on transmission buildout by 2035. This half-trillion-dollar cost gets passed down to homeowners in the form of raised utility bill rates.

The benefit of backup power may increase as time goes on as well. Power outages are on the rise across the United States, and recent assessments of the risk of power outages underscore that outages related to severe weather events have doubled in the last 20 years. Climate change-fueled storms are expected to continue to rise, so the role of battery backup in providing reliable energy may increase significantly.

The truth is, we don’t know how much power will cost in 20 years. Though it has increased 59% across the nation in the last 20 years, there is no way to be certain what it will cost going forward. That is where solar has a benefit over the status quo. By purchasing solar, you are securing price certainty going forward, making it easier to budget and plan for the future.

So how do these costs compare to going solar?

Cost of solar

As a general trend, prices for solar have fallen. In 2010, it cost about $40,000 to install a residential solar system, and since then, prices have fallen by as much as 70%, and about 37% in the last five years. However, prices have increased slightly in 2022 due to shipping costs, materials costs, and possible tariffs being placed on imported solar goods, and these pressures aren’t expected to be alleviated in the near-term.

When comparing quotes, the best metric for an apples-to-apples comparison is the cost per watt. Price benchmarking by the National Renewable Energy Laboratory shows the average cost per watt for the nation was $2.65/W DC in 2021, and the average system size was 7.15 kW. So, an average system would cost about $18,950. With 12.5 kWh of battery energy storage, the average cost was $4.26/W, representing an average price tag of $30,460 with batteries included.

The prices above do not include any incentives. Currently, the federal government applies a 26% investment tax credit to the system, bringing down system costs for those who qualify to $14,023 without batteries, and $22,540 with batteries. Compared to the potential $39,460 in utility bills, buying a solar system outright in cash appears to show a clear financial benefit.

Many homeowners will need financing to buy a solar system. Shorter terms can achieve rates as low as 2.99% or less, but financing for a 20-year solar loan typically lands between 5% to 8% or more. Based on 20-year, 7% annual percentage rate terms, a $14,000 system would total about $26,000 in loan payments over 20 years, and the system with batteries included would total about $42,000 in loan payments.

Often when you adopt solar, the utility will still charge you a grid access fee even if your system produces 100% of your needs. These vary from utility to utility but are often around $10 a month. Over 20 years, that equates to about $2,400 that you’ll still need to pay to the utility, plus any costs for energy you use beyond what your system provides.

Based on these average figures, a homeowner could expect to see as much as $12,000 in savings with a 20-year financed system. Homeowners in regions whose retail energy price exceeds the national average could see savings in multiples of that figure.

Though in this example batteries appear to be marginally more expensive than the status quo over a 20-year term, they improve the home by adding the crucial service of backup power, and as battery costs continue to fall they are increasingly being approved to participate in grid services, potentially unlocking additional revenue streams for homeowners.

Another thing to note is most solar systems are warranted for 25 years rather than the 20 used in the status quo example. A panel can last a good 35 years, and though it will begin to produce less in old age, any power produced by a panel you own is money back in your pocket.

Incentives and home value

Many states have additional incentives to boost the value of solar, too, and federal proposals to increase solar generation tenfold could remake the U.S. electricity system. Checking the Database of State Incentives for Renewables (DSIRE) will show the incentives available in your state, and a solar representative should be able to walk you through these benefits when you receive a quote. State incentives change frequently and vary widely, and in some cases are quite rich, offering thousands of dollars in additional benefits.

Another factor to consider is home value. A study by Zillow found that solar arrays increase a home value by 4.1% on average. For a $375,000 home, that’s an increase of $15,375 in value. In most states home solar is exempt from property taxes, making it a great way to boost value without paying taxes for it.

Bottom line

We’ve shared a lot of data on national averages and the potential cost of power going forward, but is solar for you? In the past, early adopters have been rewarded for going solar, and celebrate when they see $0 electric bills paid to the utility company.

Each home is different, each utility is different, and each homeowner has different needs, so evaluating whether solar is right for your home will take a little time and analysis. Representatives from solar companies will walk you through this analysis, and it’s generally a good rule of thumb to get at least three quotes for comparison.

A great resource for starting your research is the Solar Calculator developed by informational site SolarReviews. The calculator offers a quote and savings estimate based on local rates and incentives available to your area. The website also features reviews of installers, equipment, and more.

Some people will save tens of thousands of dollars in the long run with solar, while others may witness more modest savings. Solar will also provide the home clean, local energy, and U.S. solar generation is projected to reach 20% by 2050 as capacity expands, making an impact both on mitigating climate change and in supporting local jobs.

One indisputable benefit of solar is that it will offer greater clarity into what your electricity bills will cost over the next couple of decades, rather than leaving you exposed to whatever rates the utility company decides to charge in the future.


Related News

View more

Sign Up for Electricity Forum’s Newsletter

Stay informed with our FREE Newsletter — get the latest news, breakthrough technologies, and expert insights, delivered straight to your inbox.

Electricity Today T&D Magazine Subscribe for FREE

Stay informed with the latest T&D policies and technologies.
  • Timely insights from industry experts
  • Practical solutions T&D engineers
  • Free access to every issue

Live Online & In-person Group Training

Advantages To Instructor-Led Training – Instructor-Led Course, Customized Training, Multiple Locations, Economical, CEU Credits, Course Discounts.

Request For Quotation

Whether you would prefer Live Online or In-Person instruction, our electrical training courses can be tailored to meet your company's specific requirements and delivered to your employees in one location or at various locations.