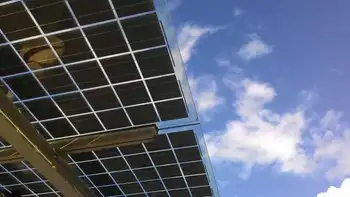
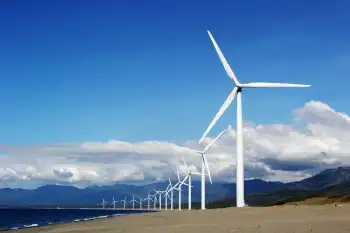
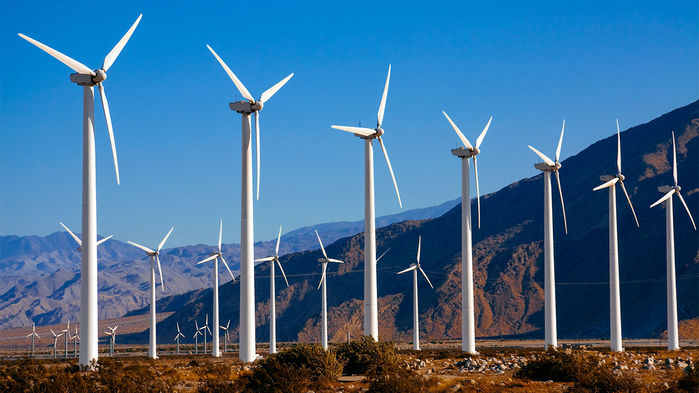
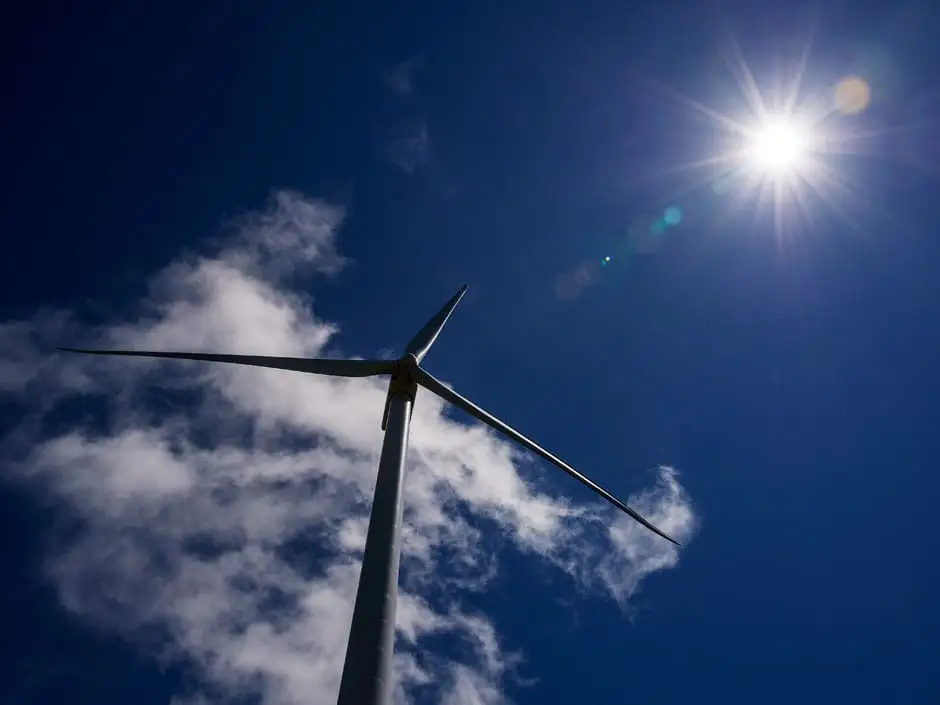
25.5% Of US Electricity Coming From Renewable Energy


usa renewable energy increases

CSA Z462 Arc Flash Training - Electrical Safety Essentials

Our customized live online or in‑person group training can be delivered to your staff at your location.

  • Live Online
  • 6 hours Instructor-led
  • Group Training Available
Regular Price:
$249
Coupon Price:
$199
Reserve Your Seat Today

US Renewable Energy Growth drives the US electricity mix as wind, solar, and hydropower rise while coal, natural gas, and nuclear decline, boosting market share month over month and year over year across the grid.


Key Points

US Renewable Energy Growth tracks rising wind, solar, and hydro shares in the mix as coal, gas, and nuclear decline.

✅ Wind and solar surpass nuclear in April share

✅ Renewables reach 29.3% of US electricity in April

✅ Coal and natural gas shares trend lower since 2020


Electricity generated by renewable energy sources continues to grow month over month and year over year in the United States. In April 2022, the share of US electricity coming from renewable energy was up to 29.3%, surpassing a record April level reported previously in national data. That was up from 24.8% in April 2020 and 25.7% in April 2021.

Looking at the first four months of the year, renewables provided 25.5% of US electricity, and were the second-most U.S. source in 2020 as well, while the figure for January–April 2020 was 21.7% and the figure for January–April 2021 was 22.5%.

Coal power (20.2% of US electricity) was down year over year in this time period (from 22% in January–April 2021), even as renewables surpassed coal in 2022 nationwide, but is admittedly still a bit higher than it was in January–April 2020 (16.8%).

Electricity from natural gas is also down year over year, but only very slightly (34.7% for both years). Though, it has dropped significantly since January–April 2020 (39.6%).

Electricity from nuclear power continued to take a steady, step-by-step tumble.

Wind & Solar Power Growth Strong
As reported earlier, April was the first month that wind and solar power provided more electricity than nuclear across the United States. Wind and solar power provided 21% of US electricity, while nuclear power provided 17.8% of US electricity (coal, incidentally, also provided 17.8% of US electricity, but wind and solar had provided more electricity than coal in some previous months as well).

Wind and solar power’s combined market share for the first four months of the year was up from just 14.6% in 2020 and 18.4% in 2021.

Looking at their growth year over year, you can see strong and continuous expansion of solar-provided electricity and wind-provided electricity, amid favorable government plans that have supported deployment.

Solar grew from 2.9% in January–April 2020 to 3.6%in January–April 2021 to, eventually, 4.4% in January–April 2022, with solar's 2022 share rising to 4.7% for the full year. Wind rose from 9.2% to 10.3% to 12.2%.

Together, wind and solar were up from 12.1% in January–April 2020 to 13.9% in January–April 2021, reflecting a surge in wind power within the U.S. electricity mix over this period, to 16.7% January–April 2022.

Hydropower (6.5%) is holding approximately the same position as the same period in 2021 (6.5%), but it is down a significant chunk from April 2020 (8.2%).


Related News

Related News

'Consumer Reports' finds electric cars really do save money in the long run

Electric Vehicle Ownership Costs include lower maintenance, repair, and fuel expenses; Consumer Reports shows BEV and PHEV TCO beats ICE over 200,000 miles, with per-mile savings compounding through electricity prices and reduced service.


Key Points

Lifetime EV expenses, typically lower than ICE, due to cheaper electricity, reduced maintenance, and fewer repairs.

✅ BEV: $0.012/mi to 50k; $0.028/mi after; vs ICE up to $0.06/mi

✅ PHEV: $0.021/mi to 50k; $0.031/mi after; still below ICE

✅ Savings increase over 200k miles from fuel and service reductions


Electric vehicles are a relatively new technology, and the EV age is arriving ahead of schedule today. Even though we technically saw the first battery-powered vehicles more than 100 years ago, they haven’t really become viable transportation in the modern world until recently, and they are greener than ever in all 50 states as the grid improves.

As viable as they may now be, however, it still seems they’re unarguably more expensive than their conventional internal-combustion counterparts, prompting many to ask whether it’s time to buy an electric car today. Well, until now.

Lower maintenence costs and the lower price of electricity versus gasoline (see the typical cost to charge an electric vehicle in most regions) actually make electric cars much cheaper in the long run, despite their often higher purchase price, according to a new survey by Consumer Reports. The information was collected using annual reliability surveys conducted by CR in 2019 and 2020.

In the first 50,000 miles (80,500 km), battery electric vehicles cost just US$0.012 per mile for maintenence and repairs, while plug-in hybrid models bump that number up to USD$0.021. Compare these numbers to the typical USD$0.028 cost for internal combustion vehicles, and it becomes clear the more you drive, the more you will save, and across the U.S. plug-ins logged 19 billion electric miles in 2021 to prove the point. After 50,000 miles, the costs for BEV and PHEV vehicles is US$0.028 and US$0.031 respectively, while ICE vehicles jump to US$0.06 per mile.

To put it more practically, if you chose to buy a Model 3 instead of a BMW 330i, you’d see a total US$17,600 in savings over the lifetime of the vehicle, aligning with evidence that EVs are better for the planet and your budget as well, based on average driving. In the SUV sector, buying a Tesla Model Y instead of a Lexus crossover would save US$13,400 (provided the former’s roof doesn’t fly off) and buying a Nissan Leaf over a Honda Civic would save US$6,000 over the lifetime of the vehicles.

CR defines the vehicle’s “lifetime” as 200,000 miles (320,000 km). Ergo the final caveat: while it sounds like driving electric means big savings, you might only see those returns after quite a long period of ownership, though some forecasts suggest that within a decade adoption will be nearly universal for many drivers.


Related News

View more

Renewables Poised to Eclipse Coal in Global Power Generation by 2025

IEA Electricity 2024 Renewables Outlook projects renewable energy surpassing coal in global electricity generation by early 2025, with nuclear power rebounding, clean energy expansion, electrification, and grid upgrades cutting emissions and decarbonizing power systems.


Key Points

IEA forecast: renewables beat coal by 2025, nuclear rebounds, speeding cleaner power and deeper emissions cuts by 2026.

✅ Renewables surpass coal by 2025; nuclear output hits records by 2025-2026.

✅ Power demand grows 3.4% avg to 2026 via EVs, data centers, electrification.

✅ Gas displaces coal; grids need investment; drought and supply chains pose risks.


The International Energy Agency's latest Electricity 2024 report predicts that renewable energy sources will surpass coal in global electricity generation by early 2025, reaching over one-third of the world's total power output. Additionally, nuclear power is expected to achieve record production levels by 2025, recovering from recent downturns and reflecting low-carbon electricity lessons from the COVID-19 period.

By 2026, the report estimates that renewables and nuclear will jointly contribute to nearly half of the global power generation, up from less than 40 percent in 2023. This shift is crucial as the United Nations emphasizes the transition to clean energy, with Asia to use half of electricity by 2025 highlighting the scale of the challenge, as a key factor in limiting global warming to 1.5 degrees Celsius above preindustrial levels.

IEA Executive Director Fatih Birol highlighted the promising trends of renewables, led by affordable solar power and the resurgence of nuclear power, as key factors covering almost all demand growth over the next three years.

At the COP28 climate summit in Dubai, participants agreed on a plan for phasing out fossil fuels and committed to tripling renewable capacity by 2030. This shift in the electricity mix is expected to reduce emissions from the power sector, which is currently the largest source of carbon dioxide emissions worldwide.

Despite a modest 2.2 percent growth in global electricity demand in 2023, an acceleration to an average annual increase of 3.4 percent is projected from 2024 to 2026. This surge in electricity demand is driven by factors like home and business electrification, the proliferation of electric vehicles, and industrial expansion.

Significant growth in electricity usage from data centers worldwide is anticipated, potentially doubling between 2022 and 2026, as global power demand has surged above pre-pandemic levels. Regulatory updates and technological advancements are essential to manage this energy consumption increase effectively.

Emissions from the electricity sector are expected to decrease following a 1 percent rise in 2023, with a more than 2 percent reduction projected in 2024 and continued declines in subsequent years. This reduced carbon intensity in electricity generation will enhance the emissions savings from electrifying cars and appliances.

Natural gas-fired power is predicted to see a modest increase over the next three years, primarily replacing coal power. While Europe has witnessed sharp declines in gas power, EU wind and solar beat gas last year, growth in the United States, Asia, Africa, and the Middle East is expected due to available liquefied natural gas supplies.

By 2026, fossil fuels are forecasted to account for 54 percent of global generation, dropping below 60 percent for the first time in over five decades. The U.S. is anticipated to boost renewable generation by approximately 10 percent annually between 2024 and 2026, surpassing coal generation in 2024.

The report warns of potential risks to clean energy trends, including droughts impacting hydropower, extreme weather affecting electricity reliability, and supply chain interruptions threatening new renewable and nuclear projects, and a generation mix sensitive to policies and gas prices that could shift trajectories.

Keisuke Sadamori, IEA’s director of energy markets and security, underscores the need for continued investment in grid infrastructure to integrate incoming renewable energy and sustain the power sector's trajectory towards emissions reduction goals.


Related News

View more

YVR welcomes government funding for new Electric Vehicle Chargers

YVR EV Charging Infrastructure Funding backs new charging stations at Vancouver International Airport via ZEVIP and CleanBC Go Electric, supporting Net Zero 2030 with Level 2 and DC fast charging across Sea Island.


Key Points

A federal and provincial effort to expand EV charging at YVR, accelerating airport electrification toward Net Zero 2030.

✅ Up to 74 new EV charging outlets across Sea Island by 2025

✅ Funded through ZEVIP and CleanBC Go Electric programs

✅ Supports passengers, partners, and YVR fleet electrification


Vancouver International Airport (YVR) welcomes today’s announcement from the Government of Canada, which confirms new federal funding under Natural Resource Canada’s Zero Emission Vehicle Infrastructure Program (ZEVIP) and broader zero-emission vehicle incentives for essential infrastructure at the airport that will further enable YVR to achieve its climate targets.

This federal funding, combined with funding through the Government of British Columbia’s CleanBC Go Electric program, which includes EV charger rebates, will support the installation of up to 74 additional Electric Vehicle (EV) Charging outlets across Sea Island over the next three years. EV charging infrastructure is identified as a key priority in the airport’s Roadmap to Net Zero 2030. It is also an important part of its purpose in being a Gateway to the New Economy.

“We know that our passengers’ needs and expectations are changing as EV adaptation increases across our region and policies like the City’s EV-ready requirements take hold, we are always working hard to anticipate and exceed these expectations and provide world-class amenities at our airport,” said Tamara Vrooman, President & CEO, Vancouver Airport Authority.

This airport initiative is among 26 projects receiving $19 million under ZEVIP, which assists organizations as they adapt to the Government of Canada’s mandatory target for all new light-duty cars and passenger trucks to be zero-emission by 2035, and to provincial momentum such as B.C.'s EV charging expansion across the network.

“We are grateful to have found partners at all levels of government as we take bold action to become the world’s greenest airport. Not only will this critical funding support us as we work to the complete electrification of our airport operations, and as regional innovations like Harbour Air’s electric aircraft demonstrate what’s possible, but it will help us in our role supporting the mutual needs of our business partners related to climate action,” Vrooman continued.

These new EV Charging stations are planned to be installed by 2025, and will provide electricity to the YVR fleet, commercial and business partners’ vehicles, as well as passengers and the public, complementing BC Hydro’s expanding charging network in southern B.C. Currently, YVR provides 12 free electric vehicle charging stalls (Level Two) at its parking facilities, as well as one DC fast-charging stall.

This exciting announcement comes on the heels of the Province of BC’s Integrated Marketplace Initiative (IMI) pilot program in November 2022, a partnership between YVR and the Province of British Columbia to invest up to 11.5 million to develop made-in-BC clean-tech solutions for use at the airport, and related programs offering home and workplace charging rebates are accelerating adoption.


Related News

View more

Record numbers of solar panels were shipped in the United States during 2021

U.S. Solar Panel Shipments 2021 surged to 28.8 million kW of PV modules, tracking utility-scale and small-scale capacity additions, driven by imports from Asia, resilient demand, supply chain constraints, and declining prices.


Key Points

Record 28.8M kW PV modules shipped in 2021; 80% imports; growth in utility- and small-scale capacity with lower prices.

✅ 28.8M kW shipped, up from 21.8M kW in 2020 (record capacity)

✅ 80% of PV module shipments were imports, mainly from Asia

✅ Utility-scale +13.2 GW; small-scale +5.4 GW; residential led


U.S. shipments of solar photovoltaic (PV) modules (solar panels) rose to a record electricity-generating capacity of 28.8 million peak kilowatts (kW) in 2021, from 21.8 million peak kW in 2020, based on data from our Annual Photovoltaic Module Shipments Report. Continued demand for U.S. solar capacity drove this increase in solar panel shipments in 2021, as solar's share of U.S. electricity continued to rise.

U.S. solar panel shipments include imports, exports, and domestically produced and shipped panels. In 2021, about 80% of U.S. solar panel module shipments were imports, primarily from Asia, even as a proposed tenfold increase in solar aims to reshape the U.S. electricity system.

U.S. solar panel shipments closely track domestic solar capacity additions; differences between the two usually result from the lag time between shipment and installation, and long-term projections for solar's generation share provide additional context. We categorize solar capacity additions as either utility-scale (facilities with one megawatt of capacity or more) or small-scale (largely residential solar installations).

The United States added 13.2 gigawatts (GW) of utility-scale solar capacity in 2021, an annual record and 25% more than the 10.6 GW added in 2020, according to our Annual Electric Generator Report. Additions of utility-scale solar capacity reached a record high, reflecting strong growth in solar and storage despite project delays, supply chain constraints, and volatile pricing.

Small-scale solar capacity installations in the United States increased by 5.4 GW in 2021, up 23% from 2020 (4.4 GW), as solar PV and wind power continued to grow amid favorable government plans. Most of the small-scale solar capacity added in 2021 was installed on homes. Residential installations totaled more than 3.9 GW in 2021, compared with 2.9 GW in 2020.

The cost of solar panels has declined significantly since 2010. The average value (a proxy for price) of panel shipments has decreased from $1.96 per peak kW in 2010 to $0.34 per peak kW in 2021, as solar became the third-largest renewable source and markets scaled. Despite supply chain constraints and higher material costs in 2021, the average value of solar panels decreased 11% from 2020.

In 2021, the top five destination states for U.S. solar panel shipments were:

California (5.09 million peak kW)
Texas (4.31 million peak kW)
Florida (1.80 million peak kW)
Georgia (1.15 million peak kW)
Illinois (1.12 million peak kW)
These five states accounted for 46% of all U.S. shipments, and 2023 utility-scale project pipelines point to continued growth.


Related News

View more

Renewables Are Ready to Deliver a Renewable World - Time for Action for 100% Renewable Energy Globally

100% Renewable Energy Transition unites solar, wind, hydropower, geothermal, and bioenergy with storage, smart grids, and sector coupling, delivering decarbonization, energy security, and lower LCOE amid post-Fukushima policy shifts and climate resilience goals.


Key Points

It is a pathway using all renewables plus storage and grids to fully decarbonize power, heat, transport, and industry.

✅ Integrates solar, wind, hydro, geothermal, and bioenergy

✅ Uses storage, smart grids, and sector coupling for reliability

✅ Requires enabling policies, finance, and rapid deployment


Renewable energy organizations representing different spheres of the renewable energy community have gathered on the occasion of the tenth anniversary of the Great East Japan Earthquake and Fukushima nuclear accident to emphasize that renewable energies are not only available in abundance, with global renewable power on course to shatter more records, but ready to deliver a renewable world.

The combination of all renewable technologies, be it bioenergy, geothermal energy, hydropower, ocean energy, solar energy or wind power, in particular in combination with storage options, can satisfy all energy needs of mankind, be it for power, heating/cooling, transportation, or industrial processes.

Renewables have seen tremendous growth rates and cost reduction over the past two decades, but there are still many barriers that need to be addressed for a faster renewable energy deployment to eventually achieve global 100% renewable energy, as outlined in an on the road to 100% renewables initiative that charts the path. It is up to political decision-makers to create the legislative and regulatory conditions so that the renewable energy community can act as fast as needed.

Such rapid switch towards renewables is not only a must in light of nuclear risks and the growing threats of climate change, but also the necessary response to the current pandemic situation. And it will allow those hundreds of millions of humans in unserved areas to get for the first time ever access to modern energy services, as noted by a new IRENA report that details how renewables can decarbonise the energy sector and improve lives.

Speakers from the renewable energy community presented today in a joint webinar that a renewable future is a realistic vision, representing:

Energy Watch Group, Global100RE Platform, Global100RE Strategy Group, International Geothermal Association, ISEP Japan, REN Alliance, World Bioenergy Association, World Wind Energy Association.

Dr. Tetsunari Iida, Director of the Institute for Sustainable Energy Policies ISEP Japan:

Ten years ago, on 11 March 2021, the Great East Japan Earthquake and Fukushima Daiichi Nuclear Power Plant accident occurred. It is a "coincidence of global history" that it now coincides with the starting point of the 100% renewable energy initiative that is accelerating around the world.

The world has changed dramatically since 311. Germany, Italy, Switzerland, Taiwan, South Korea, China and many other countries were all shocked by 311 and shifted their focus from nuclear power to renewable energy, and in the U.S. clean energy industries are setting sights on market majority to accelerate this trend. The next ten years will be the decade in which this perception will rapidly become the "new reality". 311 was the "starting point" for a structural energy shift in world history.

Hans-Josef Fell, former MP, President of the Energy Watch Group and co-initiator of the Global100RE Strategy Group:

The disasters of Fukushima and Chernobyl are urging the entire world to quickly end the use of atomic energy, and many call for a fossil fuel lockdown to catalyze a climate revolution alongside the transition. Contrary to what is often claimed, nuclear energy cannot make a contribution to climate protection, but only creates immense problems with toxic radioactivity emissions, nuclear waste, atomic bomb material and the dangers of a nuclear catastrophe. In contrast, 100% renewable energies until 2030 can help achieve climate protection and a simultaneous nuclear phase-out, according to a recently published statement by a world-leading group of energy researchers from the USA, EU and Australia.

Their research suggests that a 100% renewable energy supply, including storage systems, can provide full energy security for all of mankind by 2030 and will even be cheaper than the existing nuclear and fossil energy supply, and with over 30% of global electricity already from renewables, momentum is strong. The only requirement for implementation is the right decisions taken by decision makers both in governments and industry. All technical and economic prerequisites for a disruptive conversion of the global energy supply to 100% renewable energies are already in place.

Hon. Peter Rae AO, President of WWEA and Honorary Chairman of the REN Alliance:

40 years ago, the idea of developing nuclear power appealed to me as a non-polluting method of generating electricity. So I studied it. How to deal with waste and how to ensure it would not create a danger to life. Along came Chernobyl and other accidents. Storage of waste was leaving dangerous hiding places while some waste was alleged to be dumped at sea. I became more and more concerned. There were demonstrations that the existing methods were dangerous and required very strict construction and operational tolerances - up went the cost. Long delays and huge cost increases. I had visited nuclear power stations and talked to expert proponents in UK, France, US, Taiwan and Australia, and debates such as New Zealand's electricity future reflect similar concerns. The more I did the more certain I became that it was not the way to go. Then Fukushima put the dangers and cost beyond doubt.

Let's get on with the rollover to renewables.

Dr. Marit Brommer, Executive Director of the International Geothermal Association IGA:

The IGA is proud to work with all renewable energy associations to continuously provide a unified voice to a cleaner energy future. The Geothermal sector is proven to be a partner of choice for many locations in the world serving baseload power and clean heat to customers. We are particularly interested in the increased attention system integration gets, which underpins the importance of all renewables coming together at events such as the webinar organised by the WWEA.

Christian Rakos, President of the World Bioenergy Association:

The IPCC has emphasized the important role of sustainable bioenergy for climate protection. Recent advances in technology allow us to use feedstock from forestry, wood processing and agricultural production in an efficient and clean way. Today, bioenergy already contributes 12 - 13% to global final energy demand. Importantly, contribution from bioenergy is more than 5 times as much as nuclear energy worldwide. Together with other renewable energy technologies such as solar, wind, geothermal and hydropower, bioenergy can increase the contribution in a substantial way to meet the energy demands of all end use sectors and meet the international energy and climate goals.

Stefan Gsanger, Secretary General of the World Wind Energy Association and Co-chair of the Global100RE Platform:

The switch to a renewable energy future requires new political and economic thinking: from centralised structures with few large actors towards decentralised, participatory models with millions of communities and citizens playing an active role, not only as consumers but also as producers of energy. To make this new paradigm the predominant energy paradigm is the true challenge of the energy transformation which we as the world community are facing. If we manage this shift well and on time, billions of people across the globe, in industrialised and developing countries alike, will benefit and will face a bright future.


Related News

View more

Wind power grows despite Covid-19

Global Wind Power Growth will hit record installations, buoying renewable energy, offshore wind, onshore capacity, and economic recovery, as GWEC forecasts resilient post-Covid markets led by China and the US with strong investment and jobs.


Key Points

Global Wind Power Growth is the forecast rise in capacity driving renewable energy, jobs, and lower emissions.

✅ 71.3 GW installed in 2020; only 6% below pre-Covid forecast

✅ 348 GW added by 2024; nearly 1,000 GW total capacity

✅ Offshore wind resilient; 6.5 GW in 2020, China-led


Wind power will continue to show record growth, as renewables set to shatter records over the next five years despite the impacts of the Covid-19 crisis, and will make a crucial contribution to economic recovery... According to the latest market outlook by GWEC Market Intelligence, 71.3GW of wind power capacity is expected to be installed in 2020, which is only a 6% reduction from pre-Covid forecasts. This is a significant increase from original predictions that expected wind power installations to be reduced by up to 20 per cent due to the pandemic, demonstrating the resilience of the wind power industry across the globe.

From 2020 to 2024, the cumulative global wind energy market will grow at a compound annual rate of 8.5% and installing 348GW of new capacity, bringing total global wind power capacity to nearly 1,000GW by the end of 2024, which is an increase of 54% for total wind power installations compared to 2019. While some project completion dates have been pushed into 2021 due to the pandemic, next year is expected to be a record year for the wind industry with 78GW of new wind capacity forecasted to be installed in 2021. Over 50% of the onshore wind capacity added between 2020 to 2024 will be installed in China and the US, where U.S. solar and wind growth is supported by favourable government plans, led by installation rushes to meet subsidy deadlines.

The offshore wind sector has been largely shielded from the impacts of the Covid-19 crisis, GWEC Market Intelligence has indeed increased its forecast for offshore wind by 5 per cent to 6.5 GW of new installations in 2020, another record year for the industry, as offshore wind's $1 trillion outlook comes into focus, led by the installation rush in China. Up until 2024, over 48GW of new offshore wind capacity is expected to be installed, with another 157GW forecasted to be installed from 2025 to 2030 across key markets such as offshore wind in the UK and Asia.

“While the Covid-19 crisis has impacted every industry across the world, wind power has continued to grow and thrive. This is no surprise given the cost competitiveness of wind energy and the need to rapidly reproduce carbon emissions. Fossil fuel industries face market fluctuations and require bailouts to stay afloat, while wind turbines across the world have continued to spin and provide affordable, clean energy to citizens everywhere," says Ben Backwell, CEO of GWEC.

“Thanks to the localised nature of wind power supply chains and project construction, the sector has continued to generate billions in local investment and thousands of jobs to support economic recovery. However, in order to tap into the full potential of wind power to drive a green recovery, governments must ensure that energy markets and policies allow a continued ramp up in investment in wind and other renewables, and avoid unintended effects such as the Solar ITC extension impact on the US wind market, while disincentivising investment in expensive and declining fossil fuel industries," he says.

Biggest markets

China and the US will continue to be the two main markets driving growth over the next few years, with U.S. wind power surges underscoring the momentum. "We have increased or maintained our forecasts for onshore wind in regions such as Latin America, North America, Africa, and the Middle East over the next five years, with only minor decreases in Asia Pacific and Europe. However, these reductions are not necessarily a direct impact of Covid-19, but also a symptom of pre-existing regulatory issues, such as protracted permitting procedures, which are slowing down installations. In particular, offshore wind has demonstrated its resilience by exceeding our pre-pandemic forecasts for 2020, and will be an important source of growth in the decade ahead," Feng Zhao, strategy director at GWEC.

“We have seen a series of carbon neutrality commitments by major economies such as China, Japan and South Korea over the past few weeks. Since wind power is a key technology for decarbonisation, building on the evolution in 2016, these targets will increase the forecast for wind power over the next few decades. However, the right enabling regulatory and policy frameworks must be in place to accelerate renewable energy growth to meet these targets. China, the world’s largest wind power market and largest carbon emitter, has pledged to go carbon-neutral by 2060. To have a chance at achieving this target, we need to be installing 50GW of wind power per year in China from now until 2025, and then 60GW from 2026 onwards. It is crucial that governments firm up carbon neutrality targets with tangible actions to drive wind and other renewable energy growth at the levels needed to achieve these aims”, he says.


Related News

View more

Sign Up for Electricity Forum’s Newsletter

Stay informed with our FREE Newsletter — get the latest news, breakthrough technologies, and expert insights, delivered straight to your inbox.

Electricity Today T&D Magazine Subscribe for FREE

Stay informed with the latest T&D policies and technologies.
  • Timely insights from industry experts
  • Practical solutions T&D engineers
  • Free access to every issue

Live Online & In-person Group Training

Advantages To Instructor-Led Training – Instructor-Led Course, Customized Training, Multiple Locations, Economical, CEU Credits, Course Discounts.

Request For Quotation

Whether you would prefer Live Online or In-Person instruction, our electrical training courses can be tailored to meet your company's specific requirements and delivered to your employees in one location or at various locations.