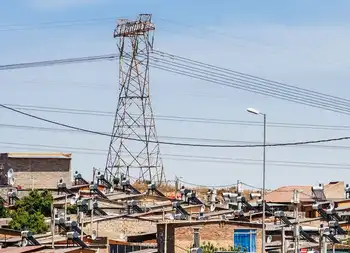
Hearing on Wise plant draws 350

By Knight Ridder Tribune


NFPA 70b Training - Electrical Maintenance

Our customized live online or in‑person group training can be delivered to your staff at your location.

  • Live Online
  • 12 hours Instructor-led
  • Group Training Available
Regular Price:
$599
Coupon Price:
$499
Reserve Your Seat Today
About 350 people packed a western Henrico County meeting room last night to sound off on a proposed Southwest Virginia power plant that is becoming a hot issue across the state.

Dominion Virginia Power wants to build the $1.8 billion plant near St. Paul in Wise County. It would burn coal and wood products. Sen. Phillip P. Puckett, D-Russell, said the plant would provide jobs and revenue for the economically troubled area.

"This is a project that is welcomed by the people of Wise County," said Puckett, one of about a half-dozen legislators to speak for the plant. But Joshua Tulkin, deputy director of the Chesapeake Climate Action Network, an environmental group, noted that the plant each year would release 5.3 million tons of carbon dioxide, considered a cause of global warming.

This would come as Virginia, under Gov. Timothy M. Kaine, is exploring ways to reduce carbon emissions. "How can we try to decrease carbon dioxide while increasing it?"

Tulkin asked. About 115 people signed up to speak at the state Department of Environmental Quality hearing at the Richmond Marriott West. The session came after two nights of hearings in Wise. Many speakers were from central and Northern Virginia.

Gerald E. Connolly, chairman of the Fairfax County Board of Supervisors, opposed the plant in a statement read by a representative. Connolly said his region's serious smog problem could be worsened by emissions drifting northeast from the plant.

"There are practical alternatives to exacerbating global warming and impairing the health of Fairfax County residents," Connolly said. He suggested better use of conservation and wind energy.

Pam Faggert, a Dominion Virginia Power vice president, said emissions from the plant would fall within pollution limits designed to protect the most sensitive people. "The (plant) will be a state-of-the-art facility" with the latest pollution controls, Faggert said.

Under a draft state permit, the plant could release up to 10,310 tons per year of pollutants, including sulfur dioxide, carbon monoxide, nitrogen oxides and soot.

The pollutants are linked to human health problems and to environmental ills such as haze. But, like Faggert, state officials say proposed limits would protect the public and the environment. Carbon-dioxide releases are not regulated. The plant would produce up to 585 megawatts of power, enough to serve 146,000 new homes.

Dominion Virginia Power hopes to have the plant running by 2012 to help meet an anticipated 4,000-megawatt increase in demand from Virginia customers over the next decade. The plant would employ about 75 workers and create about 350 mining jobs, Dominion Virginia Power says. Nearly 1,000 people would be employed during construction.

Related News

Oil crash only a foretaste of what awaits energy industry

Oil and Gas Profitability Decline reflects shale-driven oversupply, OPEC-Russia dynamics, LNG exports, renewables growth, and weak demand, signaling compressed margins for producers, stressed petrodollar budgets, and shifting energy markets post-Covid.


Key Points

A sustained squeeze on hydrocarbon margins from agile shale supply, weaker OPEC leverage, and expanding renewables.

✅ Shale responsiveness caps prices and erodes industry rents

✅ OPEC-Russia cuts face limited impact versus US supply

✅ Renewables and EVs slow long-term oil and gas demand


The oil-price crash of March 2020 will probably not last long. As in 2014, when the oil price dropped below $50 from $110 in a few weeks, this one will trigger a temporary collapse of the US shale industry. Unless the coronavirus outbreak causes Armageddon, cheap oil will also support policymakers’ efforts to help the global economy.

But there will be at least one important and lasting difference this time round — and it has major market and geopolitical implications.

The oil price crash is a foretaste of where the whole energy sector was going anyway — and that is down.

It may not look that way at first. Saudi Arabia will soon realise, as it did in 2015, that its lethal decision to pump more oil is not only killing US shale but its public finances as well. Riyadh will soon knock on Moscow’s door again. Once American shale supplies collapse, Russia will resume co-operation with Saudi Arabia.

With the world economy recovering from the Covid-19 crisis by then, and with electricity demand during COVID-19 shifting, moderate supply cuts by both countries will accelerate oil market recovery. In time, US shale producers will return too.

Yet this inevitable bounceback should not distract from two fundamental factors that were already remaking oil and gas markets. First, the shale revolution has fundamentally eroded industry profitability. Second, the renewables’ revolution will continue to depress growth in demand.

The combined result has put the profitability of the entire global hydrocarbon industry under pressure. That means fewer petrodollars to support oil-producing countries’ national budgets, including Canada's oil sector exposures. It also means less profitable oil companies, which traditionally make up a large segment of stock markets, an important component of so many western pension funds.

Start with the first factor to see why this is so. Historically, the geological advantages that made oil from countries such as Saudi Arabia so cheap to produce were unique. Because oil and gas were produced at costs far below the market price, the excess profits, or “rent”, enjoyed by the industry were very large.

Furthermore, collusion among low-cost producers has been a winning strategy. The loss of market share through output cuts was more than compensated by immediately higher prices. It was the raison d’être of Opec.

The US shale revolution changed all this, exposing the limits of U.S. energy dominance narratives. A large oil-producing region emerged with a remarkable ability to respond quickly to price changes and shrink its costs over time. Cutting back cheap Opec oil now only increases US supplies, with little effect on world prices.

That is why Russia refused to cut production this month. Even if its cuts did boost world prices — doubtful given the coronavirus outbreak’s huge shock to demand — that would slow the shrinkage of US shale that Moscow wants.

Shale has affected the natural gas industry even more. Exports of US liquefied natural gas now put an effective ceiling on global prices, and debates over a clean electricity push have intensified when gas prices spike.

On top of all this, there is also the renewables’ revolution, though a green revolution has not been guaranteed in the near term. Around the world, wind and solar have become ever-cheaper options to generate electricity. Storage costs have also dropped and network management improved. Even in the US, renewables are displacing coal and gas. Electrification of vehicle fleets will damp demand further, as U.S. electricity, gas, and EVs face evolving pressures.

Eliminating fossil fuel consumption completely would require sustained and costly government intervention, and reliability challenges such as coal and nuclear disruptions add to the complexity. That is far from certain. Meanwhile, though, market forces are depressing the sector’s usual profitability.

The end of oil and gas is not immediately around the corner. Still, the end of hydrocarbons as a lucrative industry is a distinct possibility. We are seeing that in dramatic form in the current oil price crash. But this collapse is merely a message from the future.


Related News

View more

Is a Resurgence of Nuclear Energy Possible in Germany?

Germany Nuclear Phase-Out reflects a decisive energy policy shift, retiring reactors as firms shun new builds amid high costs, radioactive waste challenges, climate goals, insurance gaps, and debate over small modular reactors and subsidies.


Key Points

Germany's policy to end nuclear plants and block new builds, emphasizing safety, waste, climate goals, and viability.

✅ Driven by safety risks, waste storage limits, and insurance gaps

✅ High capital costs and subsidies make new reactors uneconomic

✅ Political debate persists; SMRs raise cost and proliferation concerns


A year has passed since Germany deactivated its last three nuclear power plants, marking a significant shift in its energy policy.

Nuclear fission once heralded as the future of energy in Germany during the 1960s, was initially embraced with minimal concern for the potential risks of nuclear accidents. As Heinz Smital from Greenpeace recalls, the early optimism was partly driven by national interest in nuclear weapon technology rather than energy companies' initiatives.

Jochen Flasbarth, State Secretary in the Ministry of Development, reflects on that era, noting Germany's strong, almost naive, belief in technology. Germany, particularly the Ruhr region, grappled with smog-filled skies at that time due to heavy industrialization and coal-fired power plants. Nuclear energy presented a "clean" alternative at the time.

This sentiment was also prevalent in East Germany, where the first commercial nuclear power plant came online in 1961. In total, 37 nuclear reactors were activated across Germany, reflecting a widespread confidence in nuclear technology.

However, the 1970s saw a shift in attitudes. Environmental activists protested the construction of new power plants, symbolizing a generational rift. The 1979 Three Mile Island incident in the US, followed by the catastrophic Chornobyl disaster in 1986, further eroded public trust in nuclear energy.

The Chornobyl accident, in particular, significantly dampened Germany's nuclear ambitions, according to Smital. Post-Chernobyl, plans for additional nuclear power plants in Germany, once numbering 60, drastically declined.

The emergence of the Green Party in 1980, rooted in anti-nuclear sentiment, and its subsequent rise to political prominence further influenced Germany's energy policy. The Greens, joining forces with the Social Democrats in 1998, initiated a move away from nuclear energy, facing opposition from the Christian Democrats (CDU) and Christian Social Union (CSU).

However, the Fukushima disaster in 2011 prompted a policy reversal from CDU and CSU under Chancellor Angela Merkel, leading to Germany's eventual nuclear phase-out in March 2023, after briefly extending nuclear power amid the energy crisis.

Recently, the CDU and CSU have revised their stance once more, signaling a potential U-turn on the nuclear phaseout, advocating for new nuclear reactors and the reactivation of the last shut-down plants, citing climate protection and rising fossil fuel costs. CDU leader Friedrich Merz has lamented the shutdown as a "black day for Germany." However, these suggestions have garnered little enthusiasm from German energy companies.

Steffi Lemke, the Federal Environment Minister, isn't surprised by the companies' reluctance, noting their longstanding opposition to nuclear power, which she argues would do little to solve the gas issue in Germany, due to its high-risk nature and the long-term challenge of radioactive waste management.

Globally, 412 reactors are operational across 32 countries, even as Europe is losing nuclear power during an energy crunch, with the total number remaining relatively stable over the years. While countries like China, France, and the UK plan new constructions, there's a growing interest in small, modern reactors, which Smital of Greenpeace views with skepticism, noting their potential military applications.

In Germany, the unresolved issue of nuclear waste storage looms large. With temporary storage facilities near power plants proving inadequate for long-term needs, the search for permanent sites faces resistance from local communities and poses financial and logistical challenges.

Environment Minister Lemke underscores the economic impracticality of nuclear energy in Germany, citing prohibitive costs and the necessity of substantial subsidies and insurance exemptions.

As things stand, the resurgence of nuclear power in Germany appears unlikely, with economic factors playing a decisive role in its future.


Related News

View more

Three New Solar Electricity Facilities in Alberta Contracted At Lower Cost than Natural Gas

Alberta Solar Energy Contracts secure low-cost photovoltaic PPAs for government operations, delivering renewable electricity at 4.8 cents/kWh, beating natural gas LCOE, enhancing summer grid efficiency across Hays, Tilley, and Jenner with Canadian Solar.


Key Points

Low-cost PV power agreements meeting 55% of Alberta government electricity demand via new Canadian Solar facilities.

✅ Price: 4.8 cents/kWh CAD, under gas-fired generation LCOE.

✅ Sites: Hays, Tilley, Jenner; 50% equity with Conklin Métis Local #193.

✅ Supplies 55% of provincial government electricity demand.


Three new solar electricity facilities to be built in south eastern Alberta (Canada) amid Alberta's solar growth have been selected through a competitive process to supply the Government of Alberta with 55 per cent of their annual electricity needs. The facilities will be built near Hays, Tilley, and Jenner, by Canadian Solar with Conklin Métis Local #193 as 50-percent equity owners.

The Government of Alberta's operations have been powered 100 per cent with wind power since 2007. Upon the expiration of some of these contracts, they have been renewed to switch from wind to solar energy. The average contract pricing will be $0.048 per kilowatt hour (3.6 cents/kWh USD), which is less than the average historical wholesale power pool price paid to natural gas-fired electricity in the province in years 2008 - 2018.

"The conversation about solar energy has long been fixated on its price competitiveness with fossil fuels," said John Gorman, CanSIA President & CEO. "Today's announcement demonstrates that low cost solar energy has arrived as a mainstream option in Alberta, even as demand for solar lags in Canada according to federal assessments. The conversation should next focus on how to optimize an all-of-the-above strategy for developing the province's renewable and non-renewable resources."

"This price discovery is monumental for the solar industry in Canada" said Patrick Bateman, CanSIA Director of Policy & Market Development. "At less than five cents per kilowatt hour, this solar electricity has a cost that is less than that of natural gas. Achieving Alberta's legislated 30 per cent by 2030 renewable electricity target just became a whole lot cheaper!".


Quick Facts:

  • The contract price of 4.8 cents/kWh CAD to be paid by Alberta Infrastructure for this solar electricity represents a lower Levelized Cost of Electricity (LCOE) than the average annual wholesale price paid by the power pool to combined-cycle and single-cycle natural gas-fired electricity generation which was 7.1 cents/kWh and 11.2 cents/kWh respectively from 2008 - 2018.
  • Alberta receives more hours of sunshine than Miami, Florida in the summer months. Alberta's electricity supply is most strained in summer, highlighting challenges for solar expansion when high temperatures increase the resistance of the distribution and transmission systems, and reduce the efficiency of cooling thermal power plants. For this reason, solar facilities sited near to electricity demand improves overall grid efficiency. Supply shortages are atypical in Alberta in winter when solar energy is least available. When they do occur, imports are increased and large loads are decreased.
  • In 2018, Alberta's solar electricity generation exceeded 50 MW. While representing much less than 1% of the province's electricity supply today, the Canadian Solar Industries Association (CanSIA) forecasts that solar energy could supply as much as 3 per cent of the province's electricity by 2030, supporting renewable energy job growth across Alberta. A recent supply chain study of the solar electricity sector in Alberta by Solas Energy Consulting Inc. found a potential of $4.1 billion in market value and a labour force rising to 10,000 in 2030.


To learn more about solar energy and the best way for consumers to go solar, please visit the Canadian Solar Industries Association at www.CanSIA.ca.


Related News

View more

Carbon emissions fall as electricity producers move away from coal

Global Electricity Emissions Decline highlights a 2% drop as coal power falls, while wind and solar surge. EU and US decarbonize faster; China expands coal and gas, challenging Paris Agreement climate targets.


Key Points

A 2% annual fall in power-sector CO2, led by less coal and rising wind and solar in the EU and US.

✅ Coal generation fell 3% globally despite China growth

✅ EU and US cut coal; wind and solar up 15% worldwide

✅ Gas gains in US; rapid renewables rollout needed for targets


Carbon emissions from the global electricity system fell by 2% last year, the biggest drop in almost 30 years, as countries began to turn their backs on coal-fired power plants.

A new report on the world’s electricity generation revealed the steepest cut in carbon emissions since 1990, with IEA data indicating global totals flatlined in 2019 as the US and the EU turned to cleaner energy sources.

Overall, power from coal plants fell by 3% last year, even as China’s reliance on coal plants climbed for another year to make up half the world’s coal generation for the first time.

Coal generation in the US and Europe has halved since 2007, and last year collapsed by almost a quarter in the EU and by 16% in the US.

The report from climate thinktank Ember, formerly Sandbag, warned that the dent in the world’s coal-fired electricity generation relied on many one-off factors, including milder winters across many countries.

“Progress is being made on reducing coal generation, but nothing like with the urgency needed to limit climate change,” the report said.

Dave Jones, the lead author of the report, said governments must dramatically accelerate the global energy transition so that global coal generation collapses throughout the 2020s.

“To switch from coal into gas is just swapping one fossil fuel for another. The cheapest and quickest way to end coal generation is through a rapid rollout of carbon-free electricity such as wind and solar,” he said.

“But without concerted policymaker efforts to boost wind and solar, we will fail to meet climate targets. China’s growth in coal, and to some extent gas, is alarming but the answers are all there.”

The EU has made the fastest progress towards replacing coal with wind and solar power, while the US has increased its reliance on gas as Wall Street’s energy strategy shifted following its shale boom in recent years.

The report revealed that renewable wind and solar power rose by 15% in 2019 to make up 8% of the world’s electricity.

In the EU, wind and solar power made up almost a fifth of the electricity generated last year, and Europe’s oil majors are turning electric as the bloc stayed ahead of the US which relied on these renewable sources for 11% of its electricity. In China and India, renewable energy made up 8% and 9% of the electricity system, respectively.

To meet the Paris climate goals, the world needs to record a compound growth rate of 15% for wind and solar generation every year – which will require “a colossal effort”, the report warned.

The electricity generation report was published as a separate piece of research claimed that 38 out of 75 of the world’s largest asset managers are stalling on taking action on environmental, social and governance (ESG) issues, and amid investor pressure on utilities to release climate reports.

The latest ranking by Asset Owners Disclosure Project, a scheme managed by the investment campaign group ShareAction, found that the 38 asset managers have weak or nonexistent policy commitments and fail to account for their real-world impacts across their mainstream assets.

The survey also claimed that the investment managers often lack appropriate engagement and escalation processes on climate change, human rights and biodiversity.

Scores were based on a survey of activities in responsible investment governance, climate change, human rights, and biodiversity and ranged between AAA to E. Not a single asset manager was granted an AAA or AA rating, the top two scores available.

Felix Nagrawala, ShareAction analyst, said: “While many in the industry are eager to promote their ESG credentials, our analysis clearly indicates that few of the world’s largest asset managers can lay claim to having a truly sustainable approach across all their investments.”

ShareAction said the world’s six largest asset managers – including BlackRock (rated D), State Street (D) and Vanguard (E) – were among the worst performers.

Vanguard said it was committed to companies making “appropriate disclosures on governance, strategy and performance on relevant ESG risks”. BlackRock and State Street did not respond to a request for comment.


Related News

View more

Utilities see benefits in energy storage, even without mandates

Utility Battery Storage Rankings measure grid-connected capacity, not ownership, highlighting MW, MWh, and watts per customer across PJM, MISO, and California IOUs, featuring Duke Energy, IPL, ancillary services, and frequency regulation benefits.


Key Points

Rankings that track energy storage connected to utility grids, comparing MW, MWh, and W/customer rather than ownership.

✅ Ranks by MW, MWh, and watts per customer, not asset ownership

✅ Highlights PJM, MISO cases and California IOUs' deployments

✅ Examples: Duke Energy, IPL, IID; ancillary services, frequency response


The rankings do not tally how much energy storage a utility built or owns, but how much was connected to their system. So while IPL built and owns the storage facility in its territory, Duke does not own the 16 MW of storage that connected to its system in 2016. Similarly, while California’s utilities are permitted to own some energy storage assets, they do not necessarily own all the storage facilities connected to their systems.

Measured by energy (MWh), IPL ranked fourth with 20 MWh, and Duke Energy Ohio ranked eighth with 6.1 MWh.

Ranked by energy storage watts per customer, IPL and Duke actually beat the California utilities, ranking fifth and sixth with 42 W/customer and 23 W/customer, respectively.

Duke ready for next step

Given Duke’s plans, including projects in Florida that are moving ahead, the utility is likely to stay high in the rankings and be more of a driving force in development. “Battery technology has matured, and we are ready to take the next step,” Duke spokesman Randy Wheeless told Utility Dive. “We can go to regulators and say this makes economic sense.”

Duke began exploring energy storage in 2012, and until now most of its energy storage efforts were focused on commercial projects in competitive markets where it was possible to earn revenues. Those included its 36 MW Notrees battery storage project developed in partnership with the Department of Energy in 2012 that provides frequency regulation for the Electric Reliability Council of Texas market and two 2 MW storage projects at its retired W.C. Beckjord plant in New Richmond, Ohio, that sells ancillary services into the PJM Interconnection market.

On the regulated side, most of Duke’s storage projects have had “an R&D slant to them,” Wheeless said, but “we are moving beyond the R&D concept in our regulated territory and are looking at storage more as a regulated asset.”

“We have done the demos, and they have proved out,” Wheeless said. Storage may not be ready for prime time everywhere, he said, but in certain locations, especially where it can it can be used to do more than one thing, it can make sense.

Wheeless said Duke would be making “a number of energy storage announcements in the next few months in our regulated states.” He could not provide details on those projects.

More flexible resources
Location can be a determining factor when building a storage facility. For IPL, serving the wholesale market was a driving factor in the rationale to build its 20 MW, 20 MWh storage facility in Indianapolis.

IPL built the project to address a need for more flexible resources in light of “recent changes in our resource mix,” including decreasing coal-fired generation and increasing renewables and natural gas-fired generation, as other regions plan to rely on battery storage to meet rising demand, Joan Soller, IPL’s director of resource planning, told Utility Dive in an email. The storage facility is used to provide primary frequency response necessary for grid stability.

The Harding Street storage facility in May. It was the first energy storage project in the Midcontinent ISO. But the regulatory path in MISO is not as clear as it is in PJM, whereas initiatives such as Ontario storage framework are clarifying participation. In November, IPL with the Federal Energy Regulatory Commission, asking the regulator to find that MISO’s rules for energy storage are deficient and should be revised.

Soller said IPL has “no imminent plans to install energy storage in the future but will continue to monitor battery costs and capabilities as potential resources in future Integrated Resource Plans.”

California legislative and regulatory push

In California, energy storage did not have to wait for regulations to catch up with technology. With legislative and regulatory mandates, including CEC long-duration storage funding announced recently, as a push, California’s IOUs took high places in SEPA’s rankings.

Southern California Edison and San Diego Gas & Electric were first and fourth (63.2 MW and 17.2 MW), respectively, in terms of capacity. SoCal Ed and SDG&E were first and second (104 MWh and 28.4 MWh), respectively, and Pacific Gas and Electric was fifth (17 MWh) in terms of energy.

But a public power utility, the Imperial Irrigation District (IID), ended up high in the rankings – second in capacity (30 MW) and third  in energy (20 MWh) – even though as a public power entity it is not subject to the state’s energy storage mandates.

But while IID was not under state mandate, it had a compelling regulatory reason to build the storage project. It was part of a settlement reached with FERC over a September 2011 outage, IID spokeswoman Marion Champion said.

IID agreed to a $12 million fine as part of the settlement, of which $9 million was applied to physical improvements of IID’s system.

IID ended up building a 30 MW, 20 MWh lithium-ion battery storage system at its El Centro generating station. The system went into service in October 2016 and in May, IID used the system’s 44 MW combined-cycle natural gas turbine at the generating station.

Passing savings to customers
The cost of the storage system was about $31 million, and based on its experience with the El Centro project, Champion said IID plans to add to the existing batteries. “We are continuing to see real savings and are passing those savings on to our customers,” she said.

Champion said the battery system gives IID the ability to provide ancillary services without having to run its larger generation units, such as El Centro Unit 4, at its minimum output. With gas prices at $3.59 per million British thermal units, it costs about $26,880 a day to run Unit 4, she said.

IID’s territory is in southeastern California, an area with a lot of renewable resources. IID is also not part of the California ISO and acts as its own balancing authority. The battery system gives the utility greater operational flexibility, in addition to the ability to use more of the surrounding renewable resources, Champion said.

In May, IID’s board gave the utility’s staff approval to enter into contract negotiations for a 7 MW, 4 MWh expansion of its El Centro storage facility. The negotiations are ongoing, but approval could come in the next couple months, Champion said.

The heart of the issue, though, is “the ability of the battery system to lower costs for our ratepayers,” Champion said. “Our planning section will continue to utilize the battery, and we are looking forward to its expansion,” she said.” I expect it will play an even more important role as we continue to increase our percentage of renewables.”


Related News

View more

U.S. renewable electricity surpassed coal in 2022

2022 US Renewable Power Milestone highlights EIA data: wind and solar outpaced coal and nuclear, hydropower contributed, with falling levelized costs, grid integration, battery storage, and transmission upgrades shaping affordable, reliable clean power growth.


Key Points

The year US renewables, led by wind and solar, generated more power than coal and nuclear, per EIA.

✅ Wind and solar rose; levelized costs fell 70%-90% over decade

✅ Renewables surpassed coal and nuclear in 2022 per EIA

✅ Grid needs storage and transmission to manage intermittency


Electricity generated from renewables surpassed coal in the United States for the first time in 2022, as wind and solar surpassed coal nationwide, the U.S. Energy Information Administration has announced.

Renewables also surpassed nuclear generation in 2022 after first doing so last year, and wind and solar together generated more electricity than nuclear for the first time in the United States.

Growth in wind and solar significantly drove the increase in renewable energy and contributed 14% of the electricity produced domestically in 2022, with solar producing about 4.7% of U.S. power overall. Hydropower contributed 6%, and biomass and geothermal sources generated less than 1%.

“I’m happy to see we’ve crossed that threshold, but that is only a step in what has to be a very rapid and much cheaper journey,” said Stephen Porder, a professor of ecology and assistant provost for sustainability at Brown University.

California produced 26% of the national utility-scale solar electricity followed by Texas with 16% and North Carolina with 8%.

The most wind generation occurred in Texas, which accounted for 26% of the U.S. total, while wind is now the most-used renewable electricity source nationwide, followed by Iowa (10%) and Oklahoma (9%).

“This booming growth is driven largely by economics,” said Gregory Wetstone, president and CEO of the American Council on Renewable Energy, as renewables became the second-most prevalent U.S. electricity source in 2020 nationwide. “Over the past decade, the levelized cost of wind energy declined by 70 percent, while the levelized cost of solar power has declined by an even more impressive 90 percent.”

“Renewable energy is now the most affordable source of new electricity in much of the country,” added Wetstone.

The Energy Information Administration projected that the wind share of the U.S. electricity generation mix will increase from 11% to 12% from 2022 to 2023 and that solar will grow from 4% to 5% during the period, and renewables hit a record 28% share in April according to recent data. The natural gas share is expected to remain at 39% from 2022 to 2023, and coal is projected to decline from 20% last year to 17% this year.

“Wind and solar are going to be the backbone of the growth in renewables, but whether or not they can provide 100% of the U.S. electricity without backup is something that engineers are debating,” said Brown University’s Porder.

Many decisions lie ahead, he said, as the proportion of renewables that supply the energy grid increases, with renewables projected to soon be one-fourth of U.S. electricity generation over the near term.

This presents challenges for engineers and policy-makers, Porder said, because existing energy grids were built to deliver power from a consistent source. Renewables such as solar and wind generate power intermittently. So battery storage, long-distance transmission and other steps will be needed to help address these challenges, he said.


Related News

View more

Sign Up for Electricity Forum’s Newsletter

Stay informed with our FREE Newsletter — get the latest news, breakthrough technologies, and expert insights, delivered straight to your inbox.

Electricity Today T&D Magazine Subscribe for FREE

Stay informed with the latest T&D policies and technologies.
  • Timely insights from industry experts
  • Practical solutions T&D engineers
  • Free access to every issue

Download the 2025 Electrical Training Catalog

Explore 50+ live, expert-led electrical training courses –

  • Interactive
  • Flexible
  • CEU-cerified