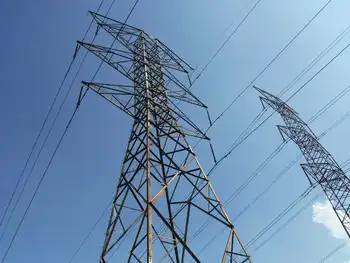
Cambridge and North Dumfries Hydro buys Brant County Power

By Cambridge and North Dumfries Hydro


CSA Z462 Arc Flash Training - Electrical Safety Essentials

Our customized live online or in‑person group training can be delivered to your staff at your location.

  • Live Online
  • 6 hours Instructor-led
  • Group Training Available
Regular Price:
$249
Coupon Price:
$199
Reserve Your Seat Today
The sale of Brant County Power Inc. BCP to Cambridge and North Dumfries Hydro Inc. CND was approved on October 30th, when the Ontario Energy Board OEB issued its Decision and Order, endorsing the purchase to proceed. The transaction is expected to close on November 28, 2014.

“We are pleased that, after a public and detailed review process, the OEB issued a favorable decision in support of the joining together of the two utilities,” said Ian Miles, President & CEO of Cambridge and North Dumfries Hydro Inc. Cambridge and North Dumfries Hydro Inc. and Brant County Power jointly filed applications to the OEB in June 2014. “The OEB approval includes the sale of all issued and outstanding shares of BCP to CND. CND will amend its distribution licence to include BCP’s service area and BCP’s distribution licence will be cancelled.”

As the electricity industry’s regulator, the OEB has a mandate to protect the interests of electricity consumers and to be guided by the “no harm” test. The “no harm” test involved careful and thorough consideration of all proposed transactions and the effect on the interests of consumers with respect to prices and the adequacy, reliability and quality of electricity service.

In issuing its decision, the OEB board staff stated that, “Cambridge has provided a well–delineated account of where it expects to achieve cost savings and operational efficiencies through the proposed transaction and an outline of expected capital expenditure savings”. OEB concluded that the “no harm” test had been met and approved the application.

When completed, the purchase of Brant County Power Inc. will add approximately 10,000 customers a 20 percent increase to Cambridge and North Dumfries Hydro Inc.Â’s current 52,500 customer base.

Related News

$1 billion per year is being spent to support climate change denial

Climate Change Consensus and Disinformation highlights the 97% peer-reviewed agreement on human-caused warming, IPCC warnings, and how fossil fuel lobbying, misinformation, and astroturf tactics echo tobacco denial to mislead media and voters.


Key Points

Explains the 97% scientific consensus and the disinformation that obscures IPCC findings and misleads the public.

✅ 97% peer-reviewed consensus on human-caused climate change

✅ Fossil fuel funding drives denial and media misinformation

✅ IPCC and major scientific bodies confirm severe impacts


Orson Johnson says there is no scientific consensus on climate change. He’s wrong. A 2015 study by Drexel University’s Robert Brulle found that nearly $1 billion per year is being spent to support climate change denial. Electric utilities, fossil fuel and transportation sectors outspent environmental and renewable energy sectors by more than 10-to-1, undermining efforts to achieve net-zero electricity emissions globally. It is virtually the same strategy that tobacco companies used to deny the dangers of tobacco smoke, spending hundreds of millions of dollars to delay recognition of harm from tobacco smoke for decades, and today Trump's oil policies can similarly influence Wall Street's energy strategy. These are the same debunked sources Johnson quotes in his commentary.

The authors of six independent peer-reviewed papers on the consensus for human-caused climate change examined “the available studies and conclude that the finding of 97% consensus in published climate research is robust and consistent with other surveys of climate scientists and peer-reviewed studies,” according to an abstract in Environmental Research Letters, and public support for action is strong, with most Americans willing to contribute financially to climate solutions. Of the 30,000 scientists (people with a bachelor’s degree or higher in science) Johnson cites, only 39 specialized in climate science.

A new study by the U.N. Intergovernmental Panel on Climate Change draws on momentum from the Katowice climate summit to warn that “The consequences for nature and humanity are sweeping and severe.”

California’s Office of Planning and Research says: “Every major scientific organization in the United States with relevant expertise has confirmed the IPCC’s conclusion, including the National Academy of Sciences, the American Meteorological Society, the American Geophysical Union, and the American Association for the Advancement of Science. The list of international scientific organizations affirming the worldwide consensus on climate change is even longer.”

Former President Obama argued that decarbonization is irreversible as the clean-energy transition accelerates.

This issue is a symptom of an even larger problem. Recently, Facebook announced it would continue to allow political ads that contain obvious lies. America’s corporate news media has been following the same policy for years. Printing stories and commentary with information that is clearly not true or where data has been cherry-picked to strongly imply a lie, such as claims that Ottawa is making electricity more expensive for Albertans, sets up a false equivalence fallacy in which two incompatible arguments appear to be logically equivalent when, in fact, they are not.

Conservatives focus exclusively on progressive income taxes to argue that rich people pay a disproportionate share of taxes while ignoring that they take a disproportionate share of income, and federal income taxes account for less than half of taxes collected, with almost all of the other taxes being heavily regressive. Critics of single-payer healthcare disregard that almost every other developed country on earth has been using single-payer for decades to provide better care with universal coverage at roughly half the cost. Other examples abound, including recent policy milestones like the historic U.S. climate deal that nevertheless become targets of misinformation. We live in a society where truth is no longer truth, reality is supplanted by alternative facts and where crippling polarization is driven by the inability to agree on basic facts.


Related News

View more

Why electric buses haven't taken over the world—yet

Electric Buses reduce urban emissions and noise, but require charging infrastructure, grid upgrades, and depot redesigns; they offer lower operating costs and simpler maintenance, with range limits influencing routes, schedules, and on-route fast charging.


Key Points

Battery-electric buses cut emissions and noise while lowering operating and maintenance costs for transit agencies.

✅ Lower emissions, noise; improved rider experience

✅ Requires charging, grid upgrades, depot redesigns

✅ Range limits affect routes; on-route fast charging helps


In lots of ways, the electric bus feels like a technology whose time has come. Transportation is responsible for about a quarter of global emissions, and those emissions are growing faster than in any other sector. While buses are just a small slice of the worldwide vehicle fleet, they have an outsize effect on the environment. That’s partly because they’re so dirty—one Bogotá bus fleet made up just 5 percent of the city’s total vehicles, but a quarter of its CO2, 40 percent of nitrogen oxide, and more than half of all its particulate matter vehicle emissions. And because buses operate exactly where the people are concentrated, we feel the effects that much more acutely.

Enter the electric bus. Depending on the “cleanliness” of the electric grid into which they’re plugged, e-buses are much better for the environment. They’re also just straight up nicer to be around: less vibration, less noise, zero exhaust. Plus, in the long term, e-buses have lower operating costs, and related efforts like US school bus electrification are gathering pace too.

So it makes sense that global e-bus sales increased by 32 percent last year, according to a report from Bloomberg New Energy Finance, as the age of electric cars accelerates across markets worldwide. “You look across the electrification of cars, trucks—it’s buses that are leading this revolution,” says David Warren, the director of sustainable transportation at bus manufacturer New Flyer.

Today, about 17 percent of the world’s buses are electric—425,000 in total. But 99 percent of them are in China, where a national mandate promotes all sorts of electric vehicles. In North America, a few cities have bought a few electric buses, or at least run limited pilots, to test the concept out, and early deployments like Edmonton's first e-bus offer useful lessons as systems ramp up. California has even mandated that by 2029 all buses purchased by its mass transit agencies be zero-emission.

But given all the benefits of e-buses, why aren’t there more? And why aren’t they everywhere?

“We want to be responsive, we want to be innovative, we want to pilot new technologies and we’re committed to doing so as an agency,” says Becky Collins, the manager of corporate initiative at the Southeastern Pennsylvania Transportation Authority, which is currently on its second e-bus pilot program. “But if the diesel bus was a first-generation car phone, we’re verging on smartphone territory right now. It’s not as simple as just flipping a switch.”

One reason is trepidation about the actual electric vehicle. Some of the major bus manufacturers are still getting over their skis, production-wise. During early tests in places like Belo Horizonte, Brazil, e-buses had trouble getting over steep hills with full passenger loads. Albuquerque, New Mexico, canceled a 15-bus deal with the Chinese manufacturer BYD after finding equipment problems during testing. (The city also sued). Today’s buses get around 225 miles per charge, depending on topography and weather conditions, which means they have to re-up about once a day on a shorter route in a dense city. That’s an issue in a lot of places.

If you want to buy an electric bus, you need to buy into an entire electric bus system. The vehicle is just the start.

The number one thing people seem to forget about electric buses is that they need to get charged, and emerging projects such as a bus depot charging hub illustrate how infrastructure can scale. “We talk to many different organizations that get so fixated on the vehicles,” says Camron Gorguinpour, the global senior manager for the electric vehicles at the World Resources Institute, a research organization, which last month released twin reports on electric bus adoption. “The actual charging stations get lost in the mix.”

But charging stations are expensive—about $50,000 for your standard depot-based one. On-route charging stations, an appealing option for longer bus routes, can be two or three times that. And that’s not even counting construction costs. Or the cost of new land: In densely packed urban centers, movements inside bus depots can be tightly orchestrated to accommodate parking and fueling. New electric bus infrastructure means rethinking limited space, and operators can look to Toronto's TTC e-bus fleet for practical lessons on depot design. And it’s a particular pain when agencies are transitioning between diesel and electric buses. “The big issue is just maintaining two sets of fueling infrastructure,” says Hanjiro Ambrose, a doctoral student at UC Davis who studies transportation technology and policy.

“We talk to many different organizations that get so fixated on the vehicles. The actual charging stations get lost in the mix as the American EV boom gathers pace across sectors.”

Then agencies also have to get the actual electricity to their charging stations. This involves lengthy conversations with utilities about grid upgrades, rethinking how systems are wired, occasionally building new substations, and, sometimes, cutting deals on electric output, since electric truck fleets will also strain power systems in parallel. Because an entirely electrified bus fleet? It’s a lot to charge. Warren, the New Flyer executive, estimates it could take 150 megawatt-hours of electricity to keep a 300-bus depot charged up throughout the day. Your typical American household, by contrast, consumes 7 percent of that—per year. “That’s a lot of work by the utility company,” says Warren.

For cities outside of China—many of them still testing out electric buses and figuring out how they fit into their larger fleets—learning about what it takes to run one is part of the process. This, of course, takes money. It also takes time. Optimists say e-buses are more of a question of when than if. Bloomberg New Energy Finance projects that just under 60 percent of all fleet buses will be electric by 2040, compared to under 40 percent of commercial vans and 30 percent of passenger vehicles.

Which means, of course, that the work has just started. “With new technology, it always feels great when it shows up,” says Ambrose. “You really hope that first mile is beautiful, because the shine will come off. That’s always true.”


Related News

View more

COVID-19 Pandemic Puts $35 Billion in Wind Energy Investments at Risk, Says Industry Group

COVID-19 Impact on U.S. Wind Industry: disrupting wind power projects, tax credits, and construction timelines, risking rural revenues, jobs, and $35B investments; AWEA seeks Congressional flexibility as OEM shutdowns like Siemens Gamesa intensify delays.


Key Points

Pandemic disruptions threaten 25 GW of projects, $35B investment, rural revenues, jobs, and tax-credit timelines.

✅ 25 GW at risk; $35B investment jeopardized

✅ Rural taxes and land-lease payments may drop $8B

✅ AWEA seeks Congressional flexibility on tax-credit deadlines


In one of the latest examples of the havoc that the novel coronavirus is wreaking on the U.S. economy and the crisis hitting solar and wind sector alike, the American Wind Energy Association (AWEA) -- the national trade association for the U.S. wind industry -- yesterday stated its concerns that COVID-19 will "pose significant challenges to the American wind power industry." According to AWEA's calculations, the disease is jeopardizing the development of approximately 25 gigawatts of wind projects, representing $35 billion in investments, even as wind additions persist in some markets amid the pandemic.

Rural communities, where about 99% of wind projects are located, in particular, face considerable risk. The AWEA estimates that rural communities stand to lose about $8 billion in state and local tax payments and land-lease payments to private landowners. In addition, it's estimated that the pandemic threatens the loss of over 35,000 jobs, and the U.S. wind jobs outlook underscores the stakes, including wind turbine technicians, construction workers, and factory workers.

The development of wind projects is heavily reliant on the earning of tax credits, and debates over a Solar ITC extension highlight potential impacts on wind. However, in order to qualify for the current credits, project developers are bound to begin construction before Dec. 31, 2020. With local and state governments implementing various measures to stop the spread of the virus, the success of project developers' meeting this deadline is dubious, as utility-scale solar construction slows nationwide due to COVID-19. Addressing this and other challenges, the AWEA is turning to the government for help. In the trade association's press release, it states that "to protect the industry and these workers, AWEA is asking Congress for flexibility in allowing existing policies to continue working for the industry through this period of uncertainty."

Illustrating one of the ways in which COVID-19 is affecting the industry, Siemens Gamesa, a global leader in the manufacturing of wind turbines, closed a second Spanish factory this week after learning that a second of its employees had tested positive for the novel coronavirus.


Related News

View more

Report call for major changes to operation of Nova Scotia's power grid

Nova Scotia Energy Modernization Act proposes an independent system operator, focused energy regulation, coal phase-out by 2030, renewable integration, transmission upgrades, and competitive market access to boost consumer trust and grid reliability across the province.


Key Points

Legislation to create an independent system operator and energy regulator, enabling coal phase-out and renewable integration.

✅ Transfers grid control from Nova Scotia Power to an ISO

✅ Establishes a focused energy regulator for multi-sector oversight

✅ Accelerates coal retirement, renewables build-out, and grid upgrades


Nova Scotia is poised for a significant overhaul in how its electricity grid operates, with the electricity market headed for a reshuffle as the province vows changes, following a government announcement that will strip the current electric utility of its grid access control. This move is part of a broader initiative to help the province achieve its ambitious energy objectives, including the cessation of coal usage by 2030.

The announcement came from Tory Rushton, the Minister of Natural Resources, who highlighted the recommendations from the Clean Electricity Task Force's report to make the electricity system more accountable to Nova Scotians according to the authors. The report suggests the creation of two distinct entities: an autonomous system operator for energy system planning and an independent body for energy regulation.

Minister Rushton expressed the government's agreement with these recommendations, while the premier had earlier urged regulators to reject a 14% rate hike to protect customers, stating plans to introduce a new Energy Modernization Act in the next legislative session.

Under the proposed changes, Nova Scotia Power, a privately-owned entity, will retain its operational role but will relinquish control over the electricity grid. This responsibility will shift to an independent system operator, aiming to foster competitive practices essential for phasing out coal—currently a major source of the province’s electricity.

Additionally, the existing Utility and Review Board, which recently approved a 14% rate increase despite political opposition, will undergo rebranding to become the Nova Scotia Regulatory and Appeals Board, reflecting a broader mandate beyond energy. Its electricity-related duties will be transferred to the newly proposed Nova Scotia Energy Board, which will oversee various energy sectors including electricity, natural gas, and retail gasoline.

The task force, led by Alison Scott, a former deputy energy minister, and John MacIsaac, an ex-executive of Nalcor Energy, was established by the province in April 2023 to determine the needs of the electrical system in meeting Nova Scotia's environmental goals.

Minister Rushton praised the report for providing a clear direction towards achieving the province's 2030 environmental targets and beyond. He estimated that establishing the recommended bodies would take 18 months to two years, and noted the government cannot order the utility to cut rates under current law, promising job security for current employees of Nova Scotia Power and the Utility and Review Board throughout the transition.

The report advocates for the new system operator to improve consumer trust by distancing electricity system decisions from Nova Scotia Power's corporate interests. It also critiques the current breadth of the Utility and Review Board's mandate as overly extensive for addressing the energy transition's long-term requirements.

Nova Scotia Power's president, Peter Gregg, welcomed the recommendations, emphasizing their role in the province's shift towards renewable energy, as neighboring jurisdictions like P.E.I. explore community generation to build resilience, he highlighted the importance of a focused energy regulator and a dedicated system operator in advancing essential projects for reliable customer service.

The task force's 12 recommendations also include the requirement for Nova Scotia Power to submit an annual asset management plan for regulatory approval and to produce reports on vegetation and wood pole management. It suggests the government assess Ontario's hydro policies for potential adaptation in Nova Scotia and calls for upgrades to the transmission grid infrastructure, with projected costs detailed by Stantec.

Alison Scott remarked on the comparative expense of coal power against renewable sources like wind, suggesting that investments in the grid to support renewables would be economically beneficial in the long run.


Related News

View more

Why Nuclear Fusion Is Still The Holy Grail Of Clean Energy

Nuclear fusion breakthrough signals progress toward clean energy as NIF lasers near ignition and net energy gain, while tokamak designs like ITER advance magnetic confinement, plasma stability, and self-sustaining chain reactions for commercial reactors.


Key Points

A milestone as lab fusion nears ignition and net gain, indicating clean energy via lasers and tokamak confinement.

✅ NIF laser shot approached ignition and triggered self-heating

✅ Tokamak path advances with ITER and stronger magnetic confinement

✅ Net energy gain remains the critical milestone for power plants


Just 100 years ago, when English mathematician and astronomer Arthur Eddington suggested that the stars power themselves through a process of merging atoms to create energy, heat, and light, the idea was an unthinkable novelty. Now, in 2021, we’re getting remarkably close to recreating the process of nuclear fusion here on Earth. Over the last century, scientists have been steadily chasing commercial nuclear fusion, ‘the holy grail of clean energy.’ The first direct demonstration of fusion in a lab took place just 12 years after it was conceptualized, at Cambridge University in 1932, followed by the world’s first attempt to build a fusion reactor in 1938. In 1950, Soviet scientists Andrei Sakharov and Igor Tamm propelled the pursuit forward with their development of the tokamak, a fusion device involving massive magnets which is still at the heart of many major fusion pursuits today, including the world’s biggest nuclear fusion experiment ITER in France.

Since that breakthrough, scientists have been getting closer and closer to achieving nuclear fusion. While fusion has indeed been achieved in labs throughout this timeline, it has always required far more energy than it emits, defeating the purpose of the commercial fusion initiative, and elsewhere in nuclear a new U.S. reactor start-up highlights ongoing progress. If unlocked, commercial nuclear fusion would change life as we know it. It would provide an infinite source of clean energy requiring no fossil fuels and leaving behind no hazardous waste products, and many analysts argue that net-zero emissions may be out of reach without nuclear power, underscoring fusion’s promise.

Nuclear fission, the process which powers all of our nuclear energy production now, including next-gen nuclear designs in development, requires the use of radioactive isotopes to achieve the splitting of atoms, and leaves behind waste products which remain hazardous to human and ecological health for up to tens of thousands of years. Not only does nuclear fusion leave nothing behind, it is many times more powerful. Yet, it has remained elusive despite decades of attempts and considerable investment and collaboration from both public and private entities, such as the Gates-backed mini-reactor concept, around the world.

But just this month there was an incredible breakthrough that may indicate that we are getting close. “For an almost imperceptible fraction of a second on Aug. 8, massive lasers at a government facility in Northern California re-created the power of the sun in a tiny hot spot no wider than a human hair,” CNET reported in August. This breakthrough occurred at the National Ignition Facility, where scientists used lasers to set off a fusion reaction that emitted a stunning 10 quadrillion watts of power. Although the experiment lasted for just 100 trillionths of a second, the amount of energy it produced was equal to about “6% of the total energy of all the sunshine striking Earth’s surface at any given moment.”

“This phenomenal breakthrough brings us tantalizingly close to a demonstration of ‘net energy gain’ from fusion reactions — just when the planet needs it,” said Arthur Turrell, physicist and nuclear fusion expert. What’s more, scientists and experts are hopeful that the rate of fusion breakthroughs will continue to speed up, as interest in atomic energy is heating up again across markets, and commercial nuclear fusion could be achieved sooner than ever seemed possible before. At a time when it has never been more important or more urgent to find a powerful and affordable means of producing clean energy, and as policies like the U.K.’s green industrial revolution guide the next waves of reactors, commercial nuclear fusion can’t come fast enough.


Related News

View more

UK low-carbon electricity generation stalls in 2019

UK low-carbon electricity 2019 saw stalled growth as renewables rose slightly, wind expanded, nuclear output fell, coal hit record lows, and net-zero targets demand faster deployment to cut CO2 intensity below 100gCO2/kWh.


Key Points

Low-carbon sources supplied 54% of UK power in 2019, up just 1TWh; wind grew, nuclear fell, and coal dropped to 2%.

✅ Wind up 8TWh; nuclear down 9TWh amid outages

✅ Fossil fuels 43% of generation; coal at 2%

✅ Net-zero needs 15TWh per year added to 2030


The amount of electricity generated by low-carbon sources in the UK stalled in 2019, Carbon Brief analysis shows.

Low-carbon electricity output from wind, solar, nuclear, hydro and biomass rose by just 1 terawatt hour (TWh, less than 1%) in 2019. It represents the smallest annual increase in a decade, where annual growth averaged 9TWh. This growth will need to double in the 2020s to meet UK climate targets while replacing old nuclear plants as they retire.

Some 54% of UK electricity generation in 2019 came from low-carbon sources, including 37% from renewables and 20% from wind alone, underscoring wind's leading role in the power mix during key periods. A record-low 43% was from fossil fuels, with 41% from gas and just 2% from coal, also a record low. In 2010, fossil fuels generated 75% of the total.

Carbon Brief’s analysis of UK electricity generation in 2019 is based on figures from BM Reports and the Department for Business, Energy and Industrial Strategy (BEIS). See the methodology at the end for more on how the analysis was conducted.

The numbers differ from those published earlier in January by National Grid, which were for electricity supplied in Great Britain only (England, Wales and Scotland, but excluding Northern Ireland), including via imports from other countries.

Low-carbon low
In 2019, the UK became the first major economy to target net-zero greenhouse gas emissions by 2050, increasing the ambition of its legally binding Climate Change Act.

To date, the country has cut its emissions by around two-fifths since 1990, with almost all of its recent progress coming from the electricity sector.

Emissions from electricity generation have fallen rapidly in the decade since 2010 as coal power has been almost phased out and even gas output has declined. Fossil fuels have been displaced by falling demand and by renewables, such as wind, solar and biomass.

But Carbon Brief’s annual analysis of UK electricity generation shows progress stalled in 2019, with the output from low-carbon sources barely increasing compared to a year earlier.

The chart below shows low-carbon generation in each year since 2010 (grey bars) and the estimated level in 2019 (red). The pale grey bars show the estimated future output of existing low-carbon sources after old nuclear plants retire and the pale red bars show the amount of new generation needed to keep electricity sector emissions to less than 100 grammes of CO2 per kilowatt hour (gCO2/kWh), the UK’s nominal target for the sector.

 Annual electricity generation in the UK by fuel, terawatt hours, 2010-2019. Top panel: fuel by fuel. Bottom panel: cumulative total generation from all sources. Source: BEIS energy trends, BM Reports and Carbon Brief analysis. Chart by Carbon Brief using Highcharts.
As the chart shows, the UK will require significantly more low-carbon electricity over the next decade as part of meeting its legally binding climate goals.

The nominal 100gCO2/kWh target for 2030 was set in the context of the UK’s less ambitious goal of cutting emissions to 80% below 1990 levels by 2050. Now that the country is aiming to cut emissions to net-zero by 2050, that 100gCO2/kWh indicator is likely to be the bare minimum.

Even so, it would require a rapid step up in the pace of low-carbon expansion, compared to the increases seen over the past decade. On average, low-carbon generation has risen by 9TWh each year in the decade since 2010 – including a rise of just 1TWh in 2019.

Given scheduled nuclear retirements and rising demand expected by the Committee on Climate Change (CCC) – with some electrification of transport and heating – low-carbon generation would need to increase by 15TWh each year until 2030, just to meet the benchmark of 100gCO2/kWh.

For context, the 3.2 gigawatt (GW) Hinkley C new nuclear plant being built in Somerset will generate around 25TWh once completed around 2026. The world’s largest offshore windfarm, the 1.2GW Hornsea One scheme off the Yorkshire coast, will generate around 5TWh each year.

The new Conservative government is targeting 40GW of offshore wind by 2030, up from today’s figure of around 8GW. If policies are put in place to meet this goal, then it could keep power sector emissions below 100gCO2/kWh, depending on the actual performance of the windfarms built.

However, new onshore wind and solar, further new nuclear or other low-carbon generation, such as gas with carbon capture and storage (CCS), is likely to be needed if demand is higher than expected, or if the 100gCO2/kWh benchmark is too weak in the context of net-zero by 2050.

The CCC says it is “likely” to “reflect the need for more rapid deployment” of low-carbon towards net-zero emissions in its advice on the sixth UK carbon budget for 2033-2037, due in September.

Trading places
Looking more closely at UK electricity generation in 2019, Carbon Brief’s analysis shows why there was so little growth for low-carbon sources compared to the previous year.

There was another increase for wind power in 2019 (up 8TWh, 14%), with record wind generation as several large new windfarms were completed including the 1.2GW Hornsea One project in October and the 0.6GW Beatrice offshore windfarm in Q2 of 2019. But this was offset by a decline for nuclear (down 9TWh, 14%), due to ongoing outages for reactors at Hunterston in Scotland and Dungeness in Kent.

(Analysis of data held by trade organisation RenewableUK suggests some 0.6GW of onshore wind capacity also started operating in 2019, including the 0.2GW Dorenell scheme in Moray, Scotland.)

As a result of these movements, the UK’s windfarms overtook nuclear for the first time ever in 2019, becoming the country’s second-largest source of electricity generation, and earlier, wind and solar together surpassed nuclear in the UK as momentum built. This is shown in the figure below, with wind (green line, top panel) trading places with nuclear (purple) and gas (dark blue) down around 25% since 2010 but remaining the single-largest source.

 Annual electricity generation in the UK by fuel, terawatt hours, 2010-2019. Top panel: fuel by fuel. Bottom panel: cumulative total generation from all sources. Source: BEIS energy trends, BM Reports and Carbon Brief analysis. Chart by Carbon Brief using Highcharts.
The UK’s currently suspended nuclear plants are due to return to service in January and March, according to operator EDF, the French state-backed utility firm. However, as noted above, most of the UK’s nuclear fleet is set to retire during the 2020s, with only Sizewell B in Suffolk due to still be operating by 2030. Hunterston is scheduled to retire by 2023 and Dungeness by 2028.

Set against these losses, the UK has a pipeline of offshore windfarms, secured via “contracts for difference” with the government, at a series of auctions. The most recent auction, in September 2019, saw prices below £40 per megawatt hour – similar to current wholesale electricity prices.

However, the capacity contracted so far is not sufficient to meet the government’s target of 40GW by 2030, meaning further auctions – or some other policy mechanism – will be required.

Coal zero
As well as the switch between wind and nuclear, 2019 also saw coal fall below solar for the first time across a full year, echoing the 2016 moment when wind outgenerated coal across the UK, after it suffered another 60% reduction in electricity output. Just six coal plants remain in the UK, with Aberthaw B in Wales and Fiddlers Ferry in Cheshire closing in March.

Coal accounted for just 2% of UK generation in 2019, a record-low coal share since centralised electricity supplies started to operate in 1882. The fuel met 40% of UK needs as recently as 2012, but has plummeted thanks to falling demand, rising renewables, cheaper gas and higher CO2 prices.

The reduction in average coal generation hides the fact that the fuel is now often not required at all to meet the UK’s electricity needs. The chart below shows the number of days each year when coal output was zero in 2019 (red line) and the two previous years (blue).

 Cumulative number of days when UK electricity generation from renewable sources has been higher than that from fossil fuels. Source: BEIS energy trends, BM Reports and Carbon Brief analysis. Chart by Carbon Brief using Highcharts.
The 83 days in 2019 with zero coal generation amount to nearly a quarter of the year and include the record-breaking 18-day stretch without the fuel.

Great Britain has been running for a record TWO WEEKS without using coal to generate electricity – the first time this has happened since 1882.

The country’s grid has been coal-free for 45% of hours in 2019 so far.https://www.carbonbrief.org/countdown-to-2025-tracking-the-uk-coal-phase-out …

Coal generation was set for significant reductions around the world in 2019 – including a 20% reduction for the EU as a whole – according to analysis published by Carbon Brief in November.

Notably, overall UK electricity generation fell by another 9TWh in 2019 (3%), bringing the total decline to 58TWh since 2010. This is equivalent to more than twice the output from the Hinkley C scheme being built in Somerset. As Carbon Brief explained last year, falling demand has had a similar impact on electricity-sector CO2 emissions as the increase in output from renewables.

This is illustrated by the fact that the 9TWh reduction in overall generation translated into a 9TWh (6%) cut in fossil-fuel generation during 2019, with coal falling by 10TWh and gas rising marginally.

Increasingly renewable
As fossil-fuel output and overall generation have declined, the UK’s renewable sources of electricity have continued to increase. Their output has risen nearly five-fold in the past decade and their share of the UK total has increased from 7% in 2010 to 37% in 2019.

As a result, the UK’s increasingly renewable grid is seeing more minutes, hours and days during which the likes of wind, solar and biomass collectively outpace all fossil fuels put together, and on some days wind is the main source as well.

The chart below shows the number of days during each year when renewables generated more electricity than fossil fuels in 2019 (red line) and each of the previous four years (blue lines). In total, nearly two-fifths of days in 2019 crossed this threshold.

 Cumulative number of days when the UK has not generated any electricity from coal. Source: BEIS energy trends, BM Reports and Carbon Brief analysis. Chart by Carbon Brief using Highcharts.
There were also four months in 2019 when renewables generated more of the UK’s electricity than fossil fuels: March, August, September and December. The first ever such month came in September 2018 and more are certain to follow.

National Grid, which manages Great Britain’s high-voltage electricity transmission network, is aiming to be able to run the system without fossil fuels by 2025, at least for short periods. At present, it sometimes has to ask windfarm operators to switch off and gas plants to start running in order to keep the electricity grid stable.

Note that biomass accounted for 11% of UK electricity generation in 2019, nearly a third of the total from all renewables. Some two-thirds of the biomass output is from “plant biomass”, primarily wood pellets burnt at Lynemouth in Northumberland and the Drax plant in Yorkshire. The remainder was from an array of smaller sites based on landfill gas, sewage gas or anaerobic digestion.

The CCC says the UK should “move away” from large-scale biomass power plants, once existing subsidy contracts for Drax and Lynemouth expire in 2027.

Using biomass to generate electricity is not zero-carbon and in some circumstances could lead to higher emissions than from fossil fuels. Moreover, there are more valuable uses for the world’s limited supply of biomass feedstock, the CCC says, including carbon sequestration and hard-to-abate sectors with few alternatives.

Methodology
The figures in the article are from Carbon Brief analysis of data from BEIS Energy Trends chapter 5 and chapter 6, as well as from BM Reports. The figures from BM Reports are for electricity supplied to the grid in Great Britain only and are adjusted to include Northern Ireland.

In Carbon Brief’s analysis, the BM Reports numbers are also adjusted to account for electricity used by power plants on site and for generation by plants not connected to the high-voltage national grid. This includes many onshore windfarms, as well as industrial gas combined heat and power plants and those burning landfill gas, waste or sewage gas.

By design, the Carbon Brief analysis is intended to align as closely as possible to the official government figures on electricity generated in the UK, reported in BEIS Energy Trends table 5.1.

Briefly, the raw data for each fuel is in most cases adjusted with a multiplier, derived from the ratio between the reported BEIS numbers and unadjusted figures for previous quarters.

Carbon Brief’s method of analysis has been verified against published BEIS figures using “hindcasting”. This shows the estimates for total electricity generation from fossil fuels or renewables to have been within ±3% of the BEIS number in each quarter since Q4 2017. (Data before then is not sufficient to carry out the Carbon Brief analysis.)

For example, in the second quarter of 2019, a Carbon Brief hindcast estimates gas generation at 33.1TWh, whereas the published BEIS figure was 34.0TWh. Similarly, it produces an estimate of 27.4TWh for renewables, against a BEIS figure of 27.1TWh.

National Grid recently shared its own analysis for electricity in Great Britain during 2019 via its energy dashboard, which differs from Carbon Brief’s figures.


Related News

View more

Sign Up for Electricity Forum’s Newsletter

Stay informed with our FREE Newsletter — get the latest news, breakthrough technologies, and expert insights, delivered straight to your inbox.

Electricity Today T&D Magazine Subscribe for FREE

Stay informed with the latest T&D policies and technologies.
  • Timely insights from industry experts
  • Practical solutions T&D engineers
  • Free access to every issue

Download the 2025 Electrical Training Catalog

Explore 50+ live, expert-led electrical training courses –

  • Interactive
  • Flexible
  • CEU-cerified