Hybrid renewable energy projects integrate wind, solar, and battery storage to enhance grid reliability, reduce curtailment, and provide dispatchable power in markets like Alberta, leveraging photovoltaic tracking, overbuilt transformers, and improved storage economics.
Key Points
Hybrid renewable energy projects combine wind, solar, and storage to deliver reliable, dispatchable clean power.
✅ Combine wind, solar, and batteries for steady, dispatchable output
✅ Lower curtailment by using shared transformers and smart inverters
✅ Boost farm income via leases; diversify risk from oil and gas
Third-generation farmer James Praskach has been burned by the oil and gas sector and watched wicked weather pound his crops flat, but he is hoping a new kind of energy -- the renewable kind -- will pay dividends.
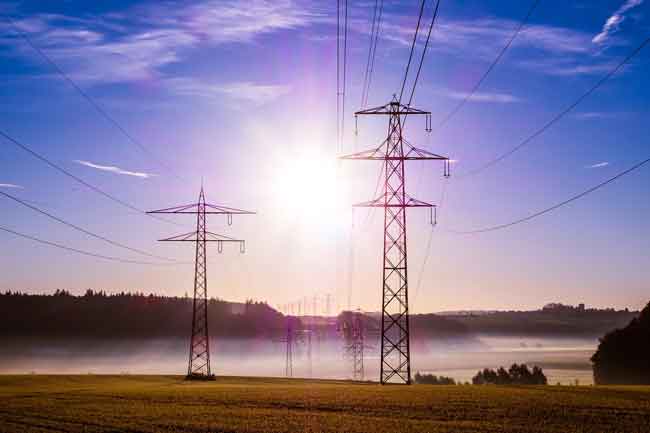
The 39-year-old is part of a landowner consortium that is hosting the sprawling 300-megawatt Blackspring Ridge wind power project in southeastern Alberta.
He receives regular lease payments from the $600-million project that came online in 2014, even though none of the 166 towering wind turbines that surround his land are actually on it.
His lease payments stand to rise, however, when and if the proposed 77-MW Vulcan Solar project, which won regulatory approval in 2016, is green-lighted by developer EDF Renewables Inc.
The panels would cover about 400 hectares of his family's land with nearly 300,000 photovoltaic solar panels in Alberta, installed on racks designed to follow the sun. It would stand in the way of traditional grain farming of the land, but that wouldn't have been a problem this year, Praskach says.
"This year we actually had a massive storm roll through. And we had 100 per cent hail damage on all of (the Vulcan Solar lands). We had canola, peas and barley on it this year," he said, adding the crop was covered by insurance.
Meanwhile, poor natural gas prices and a series of oilpatch financial failures mean rents aren't being paid for about half of the handful of gas wells on his land, showing how a province that is a powerhouse for both fossil and green energy can face volatility -- he's appealed to the Alberta surface Rights Board for compensation.
"(Solar power) would definitely add a level of security for our farming operations," said Praskach.
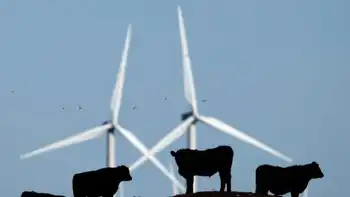
Hybrid power projects that combine energy sources are a growing trend as selling renewable energy gains traction across markets. Solar only works during the day and wind only when it is windy so combining the two -- potentially with battery storage or natural gas or biomass generation -- makes the power profile more reliable and predictable.
Globally, an oft-cited example is on El Hierro, the smallest of the Canary Islands, where wind power is used to pump water uphill to a reservoir in a volcanic crater so that it can be released to provide hydroelectric power when needed. At times, the project has provided 100 per cent of the tiny island's energy needs.
Improvements in technology such as improving solar and wind power and lower costs for storage mean it is being considered as a hybrid add-on for nearly all of its renewable power projects, said Dan Cunningham, manager of business development at Greengate Power Corp. of Calgary.
Grant Arnold, CEO of developer BluEarth Renewables, agreed.
"The barrier to date, I would say, has been cost of storage but that is changing rapidly," he said. "We feel that wind and storage or solar and storage will be a fundamental way we do business within five years. It's changing very, very rapidly and it's the product everybody wants."
Vulcan Solar was proposed after Blackspring Ridge came online, said David Warner, associate director of business development for EDF Renewables, which now co-owns the wind farm with Enbridge Inc.
"Blackspring actually had incremental capacity in the main power transformers," he said. "Essentially, it was capable of delivering more energy than Blackspring was producing. It was overbuilt."
Vulcan Solar has been sized to utilize the shortfall without producing so much energy that either will ever have to be constrained, he said. Much of the required environmental work has already been done for the wind farm.
Storage is being examined as a potential addition to the project but implementing it depends on the regulatory system. At present, Alberta's regulators are still working on how to permit and control what they call "dispatchable renewables and storage" systems.
EDF announced last spring it would proceed with the Arrow Canyon Solar Project in Nevada which is to combine 200 MW of solar with 75 MW of battery storage by 2022 -- the batteries are to soak up the sun's power in the morning and dispatch the electricity in the afternoon when Las Vegas casinos' air conditioning is most needed.
What is clear is that renewable energy will continue to grow, with Alberta renewable jobs expected to follow -- in a recent report, the International Energy Agency said global electricity capacity from renewables is set to rise by 50 per cent over the next five years, an increase equivalent to adding the current total power capacity of the United States.
The share of renewables is expected to rise from 26 per cent now to 30 per cent in 2024 but will remain well short of what is needed to meet long-term climate, air quality and energy access goals, it added.
Related News