Nearly 600 Hong Kong families still without electricity after power supply cut by Typhoon Mangkhut


typhoon radar image

CSA Z462 Arc Flash Training - Electrical Safety Essentials

Our customized live online or in‑person group training can be delivered to your staff at your location.

  • Live Online
  • 6 hours Instructor-led
  • Group Training Available
Regular Price:
$249
Coupon Price:
$199
Reserve Your Seat Today

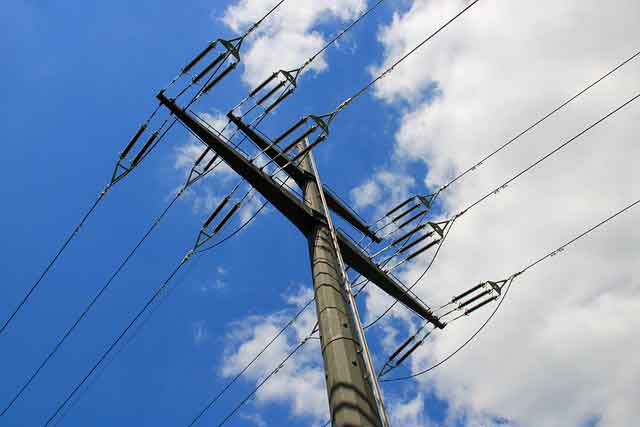
Hong Kong Typhoon Mangkhut Power Outages strain households with blackouts, electricity disruption, and humid heat, impacting Tin Ping Estate in Sheung Shui and outlying islands; contractor-led restoration faces fines for delays and infrastructure repairs.


Key Points

They are blackout events after Typhoon Mangkhut, bringing heat stress, food spoilage, and delayed power restoration.

✅ 16 floors in Tin Ping Estate lost power after meter room blast.

✅ Contractor faces HK$100,000 daily fines for late restoration.

✅ Kat O and Ap Chau families remain off-grid in humid heat.


Nearly 600 Hong Kong families are still sweltering under the summer heat and facing dark nights without electricity after Typhoon Mangkhut cut off power supply to areas, echoing mass power outages seen elsewhere.

At Sheung Shui’s Tin Ping Estate in the New Territories, 384 families were still without power, a situation similar to the LA-area blackout that left many without service. They were told on Tuesday that a contractor would rectify the situation by Friday, or be fined HK$100,000 for each day of delay.

In remote areas such as outlying islets Kat O and Ap Chau, there were some 200 families still without electricity, similar to Tennessee storm outages affecting rural communities.

The power outage at Tin Ping Estate affected 16 floors – from the 11th to 26th – in Tin Cheung House after a blast from the meter room on the 15th floor was heard at about 5pm on Sunday, and authorities urged residents to follow storm electrical safety tips during repairs.

“I was sitting on the sofa when I heard a loud bang,” said Lee Sau-king, 61, whose flat was next to the meter room. “I was so scared that my hands kept trembling.”

While the block’s common areas and lifts were not affected, flats on the 16 floors encountered blackouts.

As her fridge was out of power, Lee had to throw away all the food she had stocked up for the typhoon. With the freezer not functioning, her stored dried seafood became soaked and she had to dry them outside the window when the storm passed.

Daily maximum temperatures rose back to 30 degrees Celsius after the typhoon, and nights became unbearably humid, as utilities worldwide pursue utility climate adaptation to maintain reliability. “It’s too hot here. I can’t sleep at all,” Lee said.


Related News

Related News

California's future with income-based flat-fee utility bills is getting closer

California Income-Based Utility Fees would overhaul electricity bills as CPUC weighs fixed charges tied to income, grid maintenance costs, AB 205 changes, and per-kilowatt-hour rates, shifting from pure usage pricing to hybrid utility rate design.


Key Points

Income-based utility fees are fixed monthly charges tied to earnings, alongside per-kWh rates, to help fund grid costs.

✅ CPUC considers fixed charges by income under AB 205

✅ Separates grid costs from per-kWh energy charges

✅ Could shift rooftop solar and EV charging economics


Electricity bills in California are likely to change dramatically in 2026, with major changes under discussion statewide.

The California Public Utilities Commission (CPUC) is in the midst of an unprecedented overhaul of the way most of the state’s residents pay for electricity, as it considers revamping electricity rates to meet grid and climate goals.

Utility bills currently rely on a use-more pay-more system, where bills are directly tied to how much electricity a resident consumes, a setup that helps explain why prices are soaring for many households.

California lawmakers are asking regulators to take a different approach, and some are preparing to crack down on utility spending as oversight intensifies. Some of the bill will pay for the kilowatt hours a customer uses and a monthly fixed fee will help pay for expenses to maintain the electric grid: the poles, the substations, the batteries, and the wires that bring power to people’s homes.

The adjustments to the state’s public utility code, section 739.9, came about because of changes written into a sweeping energy bill passed last summer, AB 205, though some lawmakers now aim to overturn income-based charges in subsequent measures.

A stroke of a pen, a legislative vote, and the governor’s signature created a move toward unprecedented income-based fixed charges across the state.

“This was put in at the last minute,” said Ahmad Faruqui, a California economist with a long professional background in utility rates. “Nobody even knew it was happening. It was not debated on the floor of the assembly where it was supposedly passed. Of course, the governor signed it.”

Faruqui wonders who was responsible for legislation that was added to the energy bill during the budget writing process. That process is not transparent.

“It’s a very small clause in a very long bill, which is mostly about other issues,” Faruqui said.

But that small adjustment could have a massive impact on California residents, because it links the size of a monthly flat fee for utility service to a resident’s income. Earn more money and pay a higher flat fee.

That fee must be paid even before customers are charged for how much power they draw.

Regulators interpreted legislative change as a mandate, but Faruqui is not sold.

“They said the commission may consider or should consider,” Faruqui said. “They didn’t mandate it. It’s worth re-reading it.”

In fact, the legislative language says the commission “may” adopt income-based flat fees for utilities. It does not say the commission “should” adopt them.

Nevertheless, the CPUC has already requested and received nine proposals for how a flat fee should be implemented, as regulators face calls for action amid soaring electricity bills.

The suggestions came from consumer groups, environmentalists, the solar industry and utilities.


Related News

View more

Parked Electric Cars Earn $1,530 From Europe's Power Grids

Vehicle-to-Grid Revenue helps EV owners earn income via V2G, demand response, and ancillary services by exporting stored energy, supporting grid balancing, smart charging, and renewable integration with two-way charging infrastructure.


Key Points

Income EV owners earn by selling battery power to the grid for balancing, response, and flexibility services.

✅ Earn up to about $1,530 annually in Denmark trials

✅ Requires V2G-compatible EVs and two-way smart chargers

✅ Provides ancillary services and supports renewable integration


Electric car owners are earning as much as $1,530 a year just by parking their vehicle and feeding excess power back into the grid, effectively selling electricity back to the grid under V2G schemes.

Trials in Denmark carried out by Nissan and Italy’s biggest utility Enel Spa showed how batteries inside electric cars could, using vehicle-to-grid technology, help balance supply and demand at times and provide a new revenue stream for those who own the vehicles.

Technology linking vehicles to the grid marks another challenge for utilities already struggling to integrate wind and solar power into their distribution system. As the use of plug-in cars spreads, grid managers will have to pay closer attention and, with proper management, to when motorists draw from the system and when they can smooth variable flows.

For example, California's grid stability efforts include leveraging EVs as programs expand.

“If you blindingly deploy in the market a massive number of electric cars without any visibility or control over the way they impact the electricity grid, you might create new problems,” said Francisco Carranza, director of energy services at Nissan Europe in an interview with Bloomberg New Energy Finance.


While the Tokyo-based automaker has trials with more than 100 cars across Europe, only those in Denmark are able to earn money by feeding power back into the grid. There, fleet operators collected about 1,300 euros ($1,530) a year using the two-way charge points, said Carranza.

Restrictions on accessing the market in the U.K. means the company needs to reach about 150 cars before they can get paid for power sent back to the grid. That could be achieved by the end of this year, he said.

“It’s feasible,” he said. “It’s just a matter of finding the appropriate business model to deploy the business wide-scale.’’

Electric car demand globally is expected to soar, challenging state power grids and putting further pressure on grid operators to find new ways of balancing demand. Power consumption from vehicles will grow to 1,800 terawatt-hours in 2040 from just 6 terawatt-hours now, according to Bloomberg New Energy Finance.


Related News

View more

Here are 3 ways to find out where your electricity comes from

US energy mix shows how the electric grid blends renewables, fossil fuels, nuclear, and hydro, varying by ISO/RTO markets, utilities, and state policies, affecting carbon emissions, pricing, reliability, and access.


Key Points

The US energy mix is the grid's source breakdown by region: fossil fuels, renewables, nuclear, and hydro.

✅ Check ISO or RTO dashboards for real-time generation by fuel source.

✅ Utilities may offer green power plans or RECs at modest premiums.

✅ Energy mix shifts with policy, pricing, and grid reliability needs.


There are few resources more important than energy. Sure, you may die if you don't eat for days. But your phone will die if you go too long without charging it. Energy feeds tech, the internet, city infrastructure, refrigerators, lights, and has evolved throughout U.S. history in profound ways. You get the idea. Yet unlike our other common needs, such as food, energy sources aren't exactly front of mind for most people. 

"I think a lot of people don't put a lot of bandwidth into thinking about this part of their lives," said Richard McMahon, the SVP of energy supply and finance at Edison Electric Institute, a trade group that represents investor-owned electric companies in the US. 

It makes sense. For most Americans, electricity is always there, and in many locations, there's not much of a choice involved, even as electricity demand is flat across the U.S. today. You sign up with a utility when you move into a new residence and pay your bills when they're due. 

But there's an important reality that indifference eschews: In 2018, a third of the energy-related carbon-dioxide emissions in the US came from the electric power sector, according to the US Energy Information Administration (EIA). 

A good chunk of that is from the residential sector, which consistently uses more energy than commercial customers, per EIA data.

Just as many people exercise choice when they eat, you typically also have a choice when it comes to your energy supply. That's not to say your current offering isn't what you want, or that switching will be easy or affordable, but "if you're a customer and want power with a certain attribute," McMahon said, "you can pretty much get it wherever you are." 

But first, you need to know the energy mix you have right now. As it turns out, it's not so straightforward. At all.

This brief guide may help. 

For some utility providers, you can find out if it publishes the energy mix online. Dominion Energy, which serves Idaho, North Carolina, Ohio, South Carolina, Utah, Virginia, West Virginia, and Wyoming, provides this information in a colored graphic. 

"Once you figure out who your utility is you can figure out what mix of resources they use," said Heidi Ratz, an electricity markets researcher at the World Resources Institute.

But not all utilities publish this information.

It has to do with their role in the grid and reflects utility industry trends in structure and markets. Some utility companies are vertically integrated; they generate power through nuclear plants or wind farms and distribute those electrons directly to their customers. Other utilities just distribute the power that different companies produce. 

Consider Consolidated Edison, or Con Ed, which distributes energy to parts of New York City. While reporting this story, Business Insider could not find information about the utility's energy mix online. When reached for comment, a spokesperson said, "we're indifferent to where it comes from."

That's because, in New York, distribution utilities like Con Ed often buy energy through a wholesale marketplace.

Take a look at this map. If you live in one of the colored regions, your electricity is sold on a wholesale market regulated by an organization called a regional transmission organization (RTO) or independent system operator (ISO). Distribution utilities like Con Ed often buy their energy through these markets, based on availability and cost, while raising questions about future utility revenue models as prices shift. 

Still, it's pretty easy to figure out where your energy comes from. Just look up the ISO or RTO website (such as NYISO or CAISO). Usually, these organizations will provide energy supply information in near-real time. 

That's exactly what Con Edison (which buys energy on the NYISO marketplace) suggested. As of Friday morning, roughly 40% of the energy on the market place was natural gas or other fossil fuels, 34% was nuclear, and about 22% was hydro. 

If you live in another region governed by an ISO or RTO, such as in most of California, you can do the same thing. Like NYISO, CAISO has a dashboard that shows (again, as of Friday morning) about 36% of the energy on the market comes from natural gas and more than 20% comes from renewables. 

In the map linked above, you'll notice that some of the ISOs and RTOs like MISO encompass enormous regions. That means that even if you figure out where the energy in your market comes from, it's not going to be geographically specific. But there are a couple of ways to drill down even further. 

The Environmental Protection Agency has a straightforward tool called Power Profiler. You can enter your zip code to see the fuel mix in your area. But it's not perfect. The data are from 2016 and, in some regions of the country like the upper Midwest, they aren't much more localized, and some import dirty electricity due to regional trading. 

The World Resources Institute also has a tool that allows you to see the electricity mix by state, based on 2017 data from EIA. These numbers represent power generation, not the electricity actually flowing into your sockets, but they offer a rough idea of what energy resources are operating in your state. 

One option is to check with your utility to see if it has a "green power" offering. Over 600 utilities across the country have one, according to the Climate Reality Project, though they often come at a slightly higher cost. It's typically on the scale of just a few more cents per kilowatt-hour. 

There are also independent, consumer-facing companies like Arcadia and Green Mountain Energy that allow you to source renewable energy, by virtually connecting you to community solar projects or purchasing Renewable Energy Certificates, or RECs, on your behalf, as America goes electric and more options emerge. 

"RECs measure an investment in a clean energy resource," Ratz said, in an email. "The goal of putting that resource on the grid is to push out the need for dirtier resources."

The good news: Even if you do nothing, your energy mix will get cleaner. Coal production has fallen to lows not seen since the 1980s, amid disruptions in coal and nuclear sectors that affect reliability and costs, while renewable electricity generation has doubled since 2008. So whether you like it or not, you'll be roped into the clean energy boom one way or another. 


Related News

View more

Hydro One announces pandemic relief fund for Hydro One customers

Hydro One Pandemic Relief Fund offers COVID-19 financial assistance, payment flexibility, and Winter Relief to Ontario electricity customers facing hardship, with disconnection protection and customer support to help manage bills during the health crisis.


Key Points

COVID-19 aid offering bill credits, payment flexibility, and disconnection protection for electricity customers.

✅ Financial assistance and bill credits for hardship cases

✅ Flexible payment plans and extended Winter Relief

✅ No-disconnect policy and dedicated customer support hours


We are pleased to announce a Pandemic Relief Fund to assist customers affected by the novel coronavirus (COVID-19). As part of our commitment to customers, we will offer financial assistance as well as increased payment flexibility to customers experiencing hardship. The fund is designed to support customers impacted by these events and those that may experience further impacts.

In addition to this, we've also extended our Winter Relief program, aligning with our ban on disconnections policy so no customer experiencing any hardship has to worry about potential disconnection.

We recognize that this is a difficult time for everyone and we want our customers to know that we’re here to support them. We hope this fund and the added measures, such as extended off-peak rates that help provide our customers peace of mind so they can concentrate on what matters most — keeping their loved ones safe.

If you are concerned about paying your bill, are experiencing hardship or have been impacted by the pandemic, including electricity relief announced by the province, we want to help you. Call us to discuss the fund and see what options are available for you.


CUSTOMER CONTACT CENTRE HOURS
Call us at 1-888-664-9376

Monday to Friday from 7:30 a.m. to 8:00 p.m.

Saturdays from 9:00 a.m. to 3:00 p.m.


KEEPING ONTARIANS AND OUR ELECTRICITY SYSTEM SAFE
We recognize the critical role we play in powering communities across the province and our support for the Province of Ontario during COVID-19. This is a responsibility to employees, customers, businesses and the people of Ontario that we take very seriously.

Since the novel coronavirus (COVID-19) outbreak began, Hydro One’s Pandemic Team along with our leadership, have been actively monitoring the issues to ensure we can continue to deliver the service Ontarians depend on while keeping our employees, customers and the public safe, even as there has been no cut in peak hydro rates yet for self-isolating customers across Ontario. While the risk in Ontario remains low, we believe we can best protect our people and our operations by taking proactive measures.

As information continues to evolve, our leadership team along with the Pandemic Planning Team and our Emergency Operations Centre are committed to maintaining business continuity while minimizing risk to employees and communities.

Over the days and weeks to come, we will work with the sector and government, which is preparing to extend disconnect moratoriums across the province, to enhance safety protocols and champion the needs of electricity customers in Ontario.


Related News

View more

Canada expected to miss its 2035 clean electricity goals

Canada 2035 Clean Electricity Target faces a 48.4GW shortfall as renewable capacity lags; accelerating wind, solar PV, grid upgrades, and coherent federal-provincial policy is vital to reach zero-emissions power and strengthen transmission and distribution.


Key Points

Canada's plan to supply nearly 100% of electricity from zero-emitting sources by 2035, requiring renewable buildout.

✅ Average adds 2.6GW; shortfall totals 48.4GW by 2035

✅ Expand wind, solar PV, storage, and grid modernization

✅ Align federal-province policy; retire or convert thermal plants


GlobalData’s latest report, ‘Canada Power Market Size and Trends by Installed Capacity, Generation, Transmission, Distribution and Technology, Regulations, Key Players and Forecast, 2022-2035’, discusses the power market structure of Canada and, amid looming power challenges, provides historical and forecast numbers for capacity, generation and consumption up to 2035. Detailed analysis of the country’s power market regulatory structure, competitive landscape and a list of major power plants are provided. The report also gives a snapshot of the power sector in the country on broad parameters of macroeconomics, supply security, generation infrastructure, transmission and distribution infrastructure, electricity import and export scenario, degree of competition, regulatory scenario, and future potential. An analysis of the deals in the country’s power sector is also included in the report.

Canada is expected to fall short of its 2035 clean electricity target after reviewing the country’s current renewable capacity activity. The country has targeted to produce nearly 100% of its electricity from zero-emitting sources by 2035, while electricity associations' net-zero goals extend to 2050; however, the country is adding only 2.6GW of annual renewable capacity additions on average every year, which would mean a cumulative shortfall of 48.4GW.

Canada has good governmental support, but it is not doing enough to ensure its targets are met. If the country is to meet its target to produce nearly 100% of electricity from zero-emitting sources by 2035, the country should both increase the capacity and efficiency of renewable power plants, as well as provide comprehensive end-to-end policies at both the federal and provincial levels, as debates over whether Ontario is embracing clean power continue across provinces. It should also involve communities and businesses in raising awareness of the benefits of adopting renewable energy.

The country has a large amount of proven natural gas and oil reserves that are proving too tempting an opportunity, and the Canadian Government is planning to increase the capacity of its gas-based plants under net-zero regulations permit some gas in the power mix, to secure real-time demand and supply. However, the country’s dependency on gas-based plants creates a major challenge to achieve its 2035 clean electricity target.

If the Canadian Government is to meet its 2035 targets, it should draw on examples from its European counterparts and add renewable capacity at a rapid pace, while balancing demand and emissions in key provinces. One advantage for Canada here is that it does not have land constraints, which is common in other major renewable power-generating countries. This could give the country an estimated 6.1GW of renewable capacity every year on average during the 2021-2035 period: enough capacity to meet its target. Most of these installations are expected to be for wind and solar PV.

Changing provincial governments are not helpful when it comes to implementing long-term projects, especially as Ontario faces looming electricity shortfalls that heighten planning risks, and continued stopping and starting of projects like this will only be damaging to renewable goals. Another way the country can achieve its target is by converting thermal power plants into clean energy plants and providing a roadmap or timeline for provinces to retire thermal power plants completely, even as scrapping coal can be costly for some systems.

Canada’s GDP (at constant prices) increased from $1,617.3bn in 2010 to $1,924.5bn in 2021, at a CAGR of 1.6%. The GDP (at constant prices) of the country declined sharply from $1,943.8bn in 2019 to $1,840.5bn in 2020 because of Covid-19 pandemic. After the recommencement of regular industrial and trade activities, the GDP grew by 4.6% in 2021 from 2020. The GDP is expected to cross pre-pandemic levels by the end of 2022.


Related News

View more

BC Hydro cryptic about crypto mining electricity use

BC Hydro Crypto Mining Moratorium pauses high-load connection requests, as BCUC reviews electricity demand, gigawatt-hours and megawatt load forecasts, data center growth, and potential rate impacts on the power grid and industrial customers.


Key Points

A BC order pausing crypto mining connections while BC Hydro and BCUC assess load, grid impacts, and ratepayer risks.

✅ 18-month pause on new high-load crypto connections

✅ 1,403 MW in requests suspended; 273 MW existing or pending

✅ Seeks to manage demand, rates, and grid reliability


In its Nov. 1, 2022 load update briefing note to senior executives of the Crown corporation, BC Hydro shows that the entire large industrial sector accounted for 6,591 gigawatt-hours during the period – one percent less than forecast in the service plan.

BC Hydro censored load statistics about crypto mining, coal mining and chemicals from the briefing note, which was obtained under the freedom of information law and came amid scrutiny over B.C. electricity imports because it feared that disclosure would harm Crown corporation finances and third-party business interests.

Crypto mining requires high-powered computers to run and be cooled around the clock constantly. So much so that cabinet ordered the BC Utilities Commission (BCUC) last December to place an 18-month moratorium on crypto mining connection requests, while other jurisdictions, such as the N.B. Power crypto review, undertook similar pauses to assess impacts.


In a news release, the government said 21 projects seeking 1,403 megawatts were temporarily suspended. The government said that would be enough to power 570,000 homes or 2.1 million electric vehicles for a year.

A report issued by BC Hydro before Christmas said there were already 166 megawatts of power from operational projects at seven sites. Another six projects with 107 megawatts were nearing connection, bringing its total load to 273 megawatts.

Richard McCandless, a retired assistant deputy minister who analyzes the performance of BC Hydro and the Insurance Corp of British Columbia, said China's May 2021 ban on crypto mining had a major ripple effect on those seeking cheap and reliable power.

"When China cracked down, these guys fled to different areas," McCandless said in an interview. "So they took their computers and went somewhere else. Some wound up in B.C."

He said BC Hydro's secrecy about crypto loads appears rooted in the Crown corporation underestimating load demand, even as new generating stations were commissioned to bolster capacity.

"Crypto is up so dramatically; they didn't want to show that," McCandless said. "Maybe they didn't want to be seen as being asleep at the switch."

Indeed, BCUC's April 21 decision on BC Hydro's 2021 revenue forecasts through the 2025 fiscal year included BC Hydro's forecast increase for crypto and data centres of about 100 gigawatt-hours through fiscal 2024 before returning to 2021 levels by 2025. In addition, the BCUC document said that BC Hydro's December 2020 load forecast was lower than the previous one because of project cancellations and updated load requests, amid ongoing nuclear power debate in B.C.

"Given the segment's continued uncertainty and volatility, the forecast assumes these facilities are not long-lived," the BC Hydro application said.

A September 2022 report to the White House titled "Crypto-Assets in the United States" said increased electricity demand from crypto-asset mining could lead to rate increases.

"Crypto-asset mining in upstate New York increased annual household electric bills by [US]$82 and annual small business electric bills by [US]$164, with total net losses from local consumers and businesses estimated to be [US]$179 million from 2016-2018," the report said. The information mentioned Plattsburgh, New York's 18-month moratorium in 2018. Manitoba announced a similar suspension almost a month before B.C.

B.C.'s total core domestic load of 23,666 gigawatt-hours was two percent higher than the service plan amid BC Hydro call for power planning, with commercial and light industrial (9,198 gigawatt-hours) and residential (7,877 gigawatt-hours) being the top two customer segments.

"A cooler spring and warmer summer supported increased loads, as the Western Canada drought strained hydropower production regionally. However, warmer daytime temperatures in September impacted heating more than cooling," said the briefing note.

"Commercial and light industrial consumption benefited from warmer temperatures in August but has also been impacted to a lesser degree by the reduced heating load in the first three weeks of October."

Loads improved relative to 2021, but offices, retail businesses and restaurants remained below pre-pandemic levels. Education, recreation and hotel sectors were in line with pre-pandemic levels. Light industrial sector growth offset the declines.

For heavy industry, pulp and paper electricity use was 15 percent ahead of forecast, but wood manufacturing was 16 percent below forecast. The briefing note said oil and gas grew nine percent relative to the previous year but, alongside ongoing LNG power demand, fell nine percent below the service plan.


Related News

View more

Sign Up for Electricity Forum’s Newsletter

Stay informed with our FREE Newsletter — get the latest news, breakthrough technologies, and expert insights, delivered straight to your inbox.

Electricity Today T&D Magazine Subscribe for FREE

Stay informed with the latest T&D policies and technologies.
  • Timely insights from industry experts
  • Practical solutions T&D engineers
  • Free access to every issue

Live Online & In-person Group Training

Advantages To Instructor-Led Training – Instructor-Led Course, Customized Training, Multiple Locations, Economical, CEU Credits, Course Discounts.

Request For Quotation

Whether you would prefer Live Online or In-Person instruction, our electrical training courses can be tailored to meet your company's specific requirements and delivered to your employees in one location or at various locations.