NFPA 70E Training
Our customized live online or in‑person group training can be delivered to your staff at your location.

- Live Online
- 6 hours Instructor-led
- Group Training Available
Regular Price:
$199
Coupon Price:
$149
NEW YORK
—
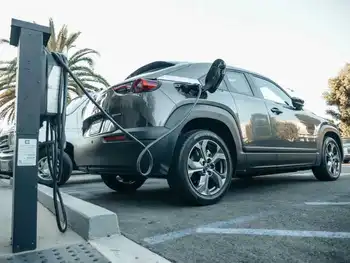
US Plug-in EV Miles 2021 highlight BEV and PHEV growth, DOE and Argonne data, 19.1 billion electric miles, 6.1 TWh consumed, gasoline savings, rising market share, and battery capacity deployed across the US light-duty fleet.
Inside the Issue
They represent 19.1 billion electric miles by US BEVs and PHEVs in 2021, consuming 6.1 TWh of electricity.
700 million gallons gasoline avoided in 2021
$1.3 billion fuel cost savings estimated
Cumulative 68 billion EV miles since 2010
Plug-in electric cars are gradually increasing their market share in the US (reaching about 4% in 2021), which starts to make an impact even as the U.S. EV market share saw a brief dip in Q1 2024.
The Department of Energy (DOE)’s Vehicle Technologies Office highlights in its latest weekly report that in 2021, plug-ins traveled some 19.1 billion miles (31 billion km) on electricity - all miles traveled in BEVs and the EV mode portion of miles traveled in PHEVs, underscoring grid impacts that could challenge state power grids as adoption grows.
This estimated distance of 19 billion miles is noticeably higher than in 2020 (nearly 13 billion miles), which indicates how quickly the electrification of driving progresses, with U.S. EV sales continuing to soar into 2024. BEVs noted a 57% year-over-year increase in EV miles, while PHEVs by 24% last year (mostly proportionally to sales increase).
According to Argonne National Laboratory's Assessment of Light-Duty Plug-in Electric Vehicles in the United States, 2010–2021, the cumulative distance covered by plug-in electric cars in the US (through December 2021) amounted to 68 billion miles (109 billion miles).
U.S. Department of Transportation, Federal Highway Administration, December 2021 Traffic Volume Trends, 2022.
The report estimates that over 2.1 million plug-in electric cars have been sold in the US through December 2021 (about 1.3 million all-electric and 0.8 million plug-in hybrids), equipped with a total of more than 110 GWh of batteries, even as EV sales remain behind gas cars in overall market share.
It's also estimated that 19.1 billion electric miles traveled in 2021 reduced the national gasoline consumption by 700 million gallons of gasoline or 0.54%.
On the other hand, plug-ins consumed some 6.1 terawatt-hours of electricity (6.1 TWh is 6,100 GWh), which sounds like almost 320 Wh/mile (200 Wh/km), aligning with projections that EVs could drive a rise in U.S. electricity demand over time.
The difference between the fuel cost and energy cost in 2021 is estimated at $1.3 billion, with Consumer Reports findings further supporting the total cost advantages.
Cumulatively, 68 billion electric miles since 2010 is worth about 2.5 billion gallons of gasoline. So, the cumulative savings already is several billion dollars.
Those are pretty amazing numbers and let's just imagine that electric cars are just starting to sell in high volume, a trend that mirrors global market growth seen over the past decade. Every year those numbers will be improving, thus tremendously changing the world that we know today.
Related News
Related News
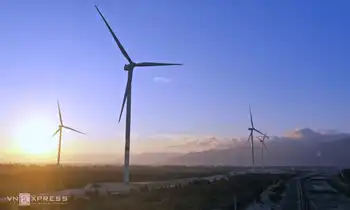
UK firm plans to operate Vietnam mega wind power project by 2025
ThangLong Wind Project Vietnam targets $12b, 3,400 MW offshore wind in Binh Thuan, aligned with…
View more

Solar panel sales double in the UK as homeowners look to cut soaring bills
UK Home Solar Panel Installation drives self-consumption as PV panels, hybrid inverters, and smart meters…
View more

Netherlands' Renewables Drive Putting Pressure On Grid
The Netherlands grid crisis exposes how rapid renewable energy growth is straining transmission capacity. Solar,…
View more
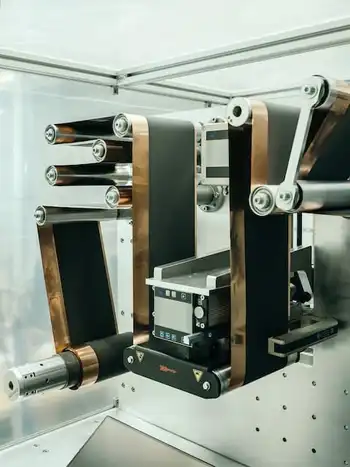
Texas battery rush: Oil state's power woes fuel energy storage boom
Texas Battery Storage Investment Boom draws BlackRock, SK, and UBS, leveraging ERCOT price volatility, renewable…
View more
The Age of Electric Cars Is Dawning Ahead of Schedule
EV Price Parity is nearing reality in Europe as subsidies, falling battery costs, higher energy…
View more
Enabling storage in Ontario's electricity system
OEB Energy Storage Integration advances DERs and battery storage through CDM guidelines, streamlined connection requirements,…
View more
Sign Up for Electricity Forum’s Newsletter
Stay informed with our FREE Newsletter — get the latest news, breakthrough technologies, and expert insights, delivered straight to your inbox.
Electricity Today T&D Magazine Subscribe for FREE

Stay informed with the latest T&D policies and technologies.
- Timely insights from industry experts
- Practical solutions T&D engineers
- Free access to every issue
